Creating and maintaining a record of surface temperatures around the world isn’t as easy as it sounds, even if you rightly don’t think that sounds easy. Lots of work goes into combining different kinds of measurements in the most accurate way possible. When new studies provide slightly better accounting for some of the complications involved, the records need to get updated.
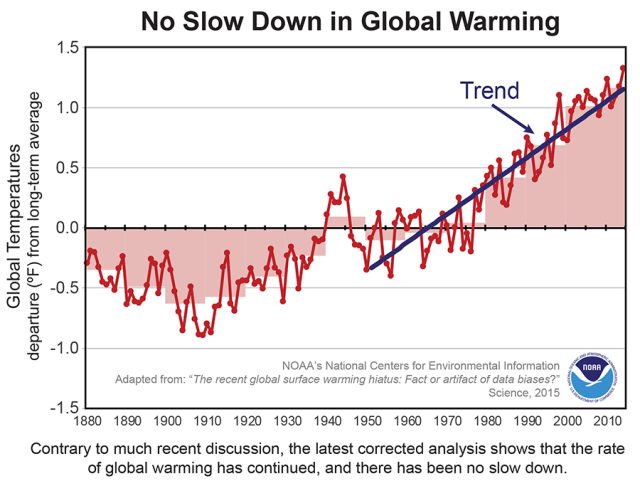
An update to the US National Oceanographic and Atmospheric Administration’s temperature record is out this week, and the researchers behind it say it has an impact on discussions about the slower rise of global average surface temperatures in recent years. That is, it doesn’t look much slower.
In this case, the update was spurred by two efforts. The first was simply a new database of weather stations on land that more than doubles the number available by folding in many smaller collections. The second was research into sources of sea surface temperature measurements. A large number of buoys are now dedicated to making these measurements, but commercial ships have also been a major source of data. Those ships haven’t always used the same methods, though, so researchers have to be careful to account for differences between the data those methods produce.
For a long time, the standard method was to pull up a bucket of water and drop a thermometer in it. But over time—and especially around World War II—this was increasingly abandoned for measurements made of water in the engine room intake pipe. Intake pipes give you a slightly warmer temperature than the buckets, and so a correction has to be applied to make the two comparable.
Scientists hadn’t used those corrections for data after World War II, but recent research discovered that the bucket method didn’t completely go away. As a result, the sea surface temperature database now includes a correction to deal with this up to the present day. This makes a non-trivial difference.
The researchers also developed an improved correction for systematic differences between buoy measurements and ship measurements by examining measurements made by ships while they were near buoys. The buoy measurements averaged 0.12 degrees Celsius cooler, necessitating an adjustment, but the measurements are also higher quality and come with a smaller margin of error.
Because buoys are becoming more prevalent, the effects of these adjustments were stronger in recent years, bringing average temperatures up a tick compared to years previous.
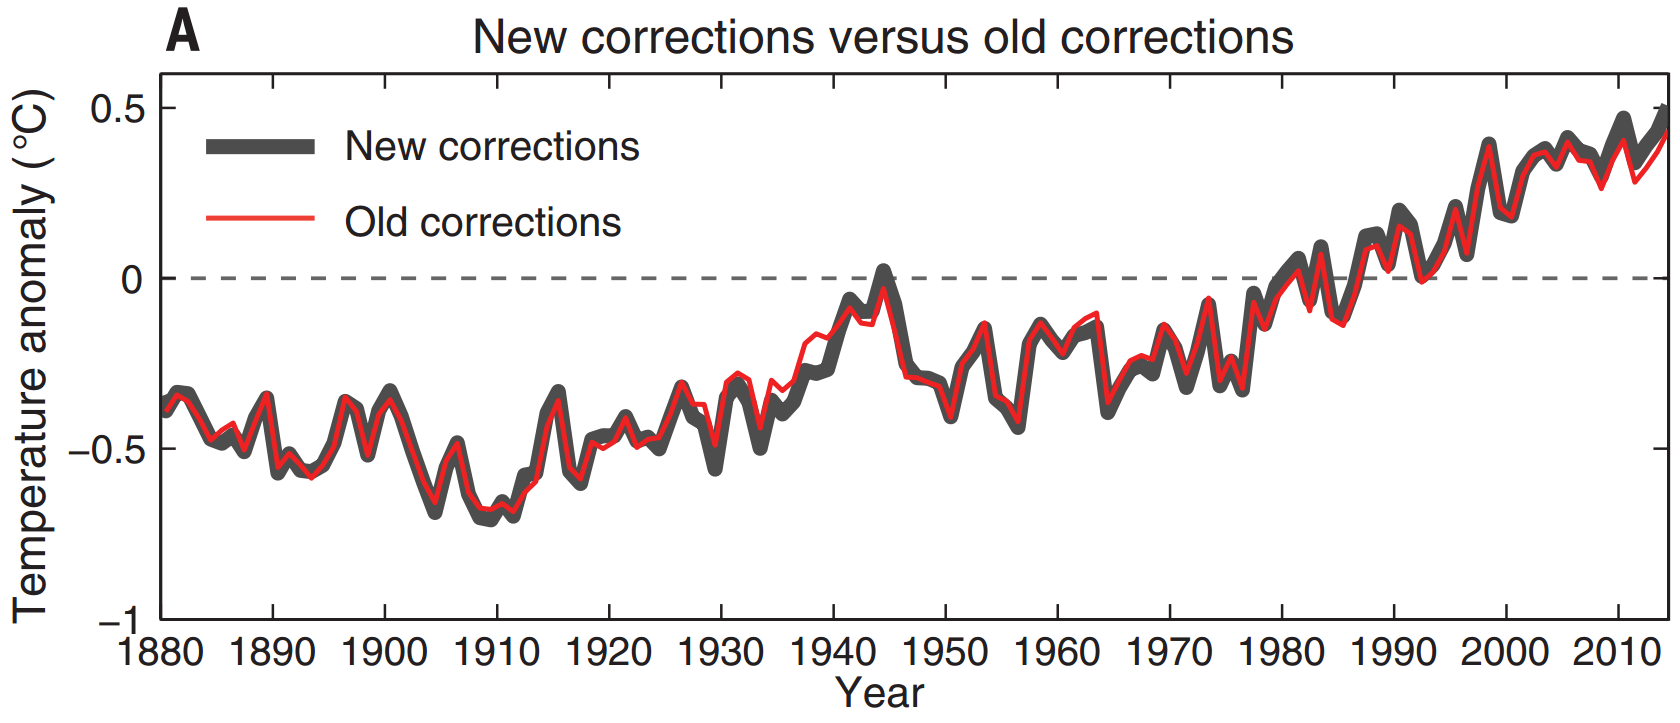
Incorporating these changes results in small shifts in the global average surface temperature estimates. Some years moved upward a bit; some years moved downward. The change over the entire record, which extends back to 1880, is miniscule. But over short time periods, this wiggling can alter trends a bit.
This paper focuses on the period after the anomalously warm El Niño year of 1998, a starting point that has inspired some politicians to claim that the Earth hasn't warmed since. That already wasn’t true, but the updated numbers make that even more obvious. In the previous version of the dataset, the average trend from 1998 to 2014 was 0.059±0.063 degrees Celsius warming per decade. Now, however, it is 0.106±0.058 degrees Celsius per decade.
(Of course, given that 1998 was warmer than surrounding years, that start date gives you the smallest trend. The trend over 2000 to 2014, for example, increases to 0.116 degrees Celsius per decade. Such is the danger of cherry-picking endpoints over short periods.)
Specifically, the paper revisits a statement from the most recent IPCC report, which was first published in 2013. The report compared the most recent trend to the trend going back to 1950, noting that the trend between 1998 and 2012 was half to one-third the trend between 1951 and 2012. That statement was based on the old NOAA numbers, which yielded trends of 0.039 degrees Celsius per decade and 0.117 degrees Celsius per decade, respectively. Using the updated numbers, that gap closes considerably: 0.086 degrees Celsius per decade (1998-2012) compared to 0.129 degrees Celsius per decade (1951-2012).
As a result, the researchers write that the IPCC’s description of a much slower trend after 1998 is “no longer valid.” For example, the new 2000 to 2014 trend is actually very slightly greater than the 1950 to 1999 trend.
Of course, NOAA isn’t the only game in town, and a couple of other datasets—like NASA’s—estimated higher temperatures for the last few years. We covered a 2013 analysis that used satellite data to fill in around the sparse weather stations in the Arctic, calculating even warmer global averages than NASA. NOAA’s Huai-Min Zhang told Ars that the 2000 to 2014 trend in their updated dataset is comparable to that analysis, making it a little steeper than NASA’s.
However, NASA uses the same land station and sea surface temperature databases as NOAA—when they incorporate these updates (which NASA’s Reto Ruedy told Ars will eventually happen after careful testing), the NASA record will likely experience similar shifts. That would probably move NASA’s numbers for recent years back on top. (The two groups handle the sparse sampling of the Arctic differently, and NASA’s method of filling in between stations rather than leaving out the blanks gives the rapidly warming Arctic a little more weight in the global average.)
Got all that? Basically, it seems that the recent slowdown in surface warming has been exaggerated by our imperfect records. But while the researchers write that “newly corrected and updated global surface temperature data from [NOAA] do not support the notion of a global warming ‘hiatus,’” we also know that ocean patterns have held down surface temperatures in recent years. And we know that we have to account for those ocean patterns, as well as solar and volcanic activity, in order to bring recent temperatures up to the average trend of climate model projections.
Of course, there will be predictable accusations of “fudging data” made by those who invariably reject the results of climate science. For that reason, it’s worth remembering that the net result of all the adjustments climate scientists make to these records is less warming over the last century.
Getting this exactly right isn’t easy, and scientists have to cross every “t” they can find to produce accurate estimates of the fever Earth’s climate system is running. If you’re curious enough about the details, t-crossing can be pretty interesting—but if you take a few steps back, the big picture will look nearly the same. And yes, the big picture shows that the Earth didn’t miraculously stop warming in 1998.
Open Access at Science, 2015. DOI: 10.1126/science.aaa5632 (About DOIs).
reader comments
633