In the Home Run Derby, players score points by hitting home runs. That seems obvious, doesn't it? However, what's not so obvious is the dependence on atmospheric conditions. Does higher humidity make it more difficult to hit a home run?
Clearly I'm not going to go out a MLB park and start hitting home runs. I'm also not going to put that park in a giant dome so that I can change the ambient humidity and other factors. No, that would be silly. Instead, I am going to make a model. If I can make a computational model that shows the motion of a baseball, I can then change different parameters and see what happens.
One quick note about models. Just because I am going to use a computational model for the motion of the ball doesn't mean this is a real experiment. It's just a model, it's not real. I've written about this before, so if you want to read more about models and the nature of science, here you go.
But back to baseballs. After the baseball has been hit by the bat, there are really just two forces that act on the ball. There is the gravitational force and the air resistance force. I can write these two forces as:

The gravitational force is pretty easy to deal with. In fact, if there was only a gravitational force on the ball the motion would be fairly simple. We would call this "projectile motion." The ball would have a constant horizontal velocity and a constant vertical acceleration. This falls in the realm of introductory physics. It's fun, but it's not too challenging.
You already know about air resistance. If you put your hand out the window of a moving car, you can feel the air pushing on your hand. When the car drives faster, the force on your hand is greater. If you decrease the size of your hand (by making a fist), the force is smaller.
In a basic model of air resistance, we say that the air force depends on the following:
- The object's speed with respect to the air. Of course this, is v. The v-hat at the end of the equation above is just a unit vector to make sure the force is a vector.
- The cross sectional area of the object (A).
- The density of air (ρ). This would change with a changing humidity.
- The drag coefficient (C). This is a parameter that depends on the shape of the object. A flat circle would be different than a sphere.


I could easily just look up some values for the size and mass of a baseball and start calculating stuff. However, I want something better than just a guess.
Let's take a look at a home run. If I can make a model that agrees with actual real life, then it would be a great place to start. Here is a hit from 2014 by Giancarlo Stanton (at t=21 s).
From this hit, I know two things. First, the ball traveled 381 feet (116 m) and second the flight time was 6.87 seconds. But wait. There's more. If you look at the end of the ball's flight, you can see that it is moving mostly vertical. If I assume the height of the green wall is 8 feet, then I can scale the video and get the following for the motion of the ball.

Here you can see the ball has a vertical velocity of about 22.8 m/s. Why isn't it accelerating? This plot only shows the motion of the ball over just 0.367 seconds. So during that time, the change in speed would be too small to see.
I just need a few more things for my model. First, the mass of a baseball. Both the gravitational force and the change in velocity depend on the mass. I will use a mass of 145 grams. I also need the diameter (7.468 cm) and the drag coefficient (I'll use 0.3). Finally, I need a value for the density of air. Let's start with 1.2 kg/m3
You really have to use a computer to solve a problem with air resistance. The problem is that forces change the velocity of the ball but the air resistance force depends on the velocity. On paper, it's a tough problem—but it's fairly straight forward with a numerical calculation. Here is the plan.
- Based on the speed of the ball, calculate the net force.
- Using the net force, find the change in momentum of the ball after a short time interval (assume a constant force).
- With the momentum, find the new position of the ball after this short time interval.
- Repeat these steps until the ball gets back down to the ground (or however long you want to do it).
That's it. Here is a bit of python code that shows the trajectory of a baseball. I guessed at the launch speed and velocity, but it seems fairly close to values from the video.
Feel free to play around with the initial speed and angle. See if you can get a better fit to the data from the video.
In the above calculation, I had an air density of 1.2 kg/m3. Of course this isn't a constant value. Instead it depends on lots of other variables like:
- Temperature
- Air pressure
- Altitude
- Humidity
All of these factors can change such that the highest density air would be at sea level with a cold, dry day. Yes, it is common to think of humid air to have higher density but the mass of a water molecule is less than that of either oxygen (O2) or nitrogen (N2).
Considering the highest density and the lowest (high altitude and warm) and the highest, I get a range from about 0.873 kg/m3 to 1.243 kg/m3. Now I can use these values along with the numerical model above to see how the range changes with air density. Oh, two more things. First, here is a fairly awesome air density calculator. Second, it appears that baseball people talk about air density in terms of the Neeley air density index (a number between 0 and 100).
Using this range of air density along with the initial conditions (velocity and angle) from the example above, I can create this plot of baseball range for different densities.
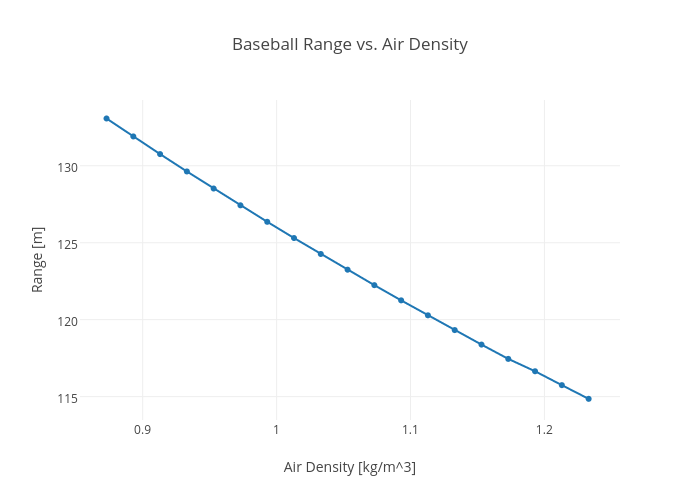
From this plot you can see that going from the lowest air density to the highest gives a change in range of about 18 meters (59 feet). Does the density of air matter? Yes.