
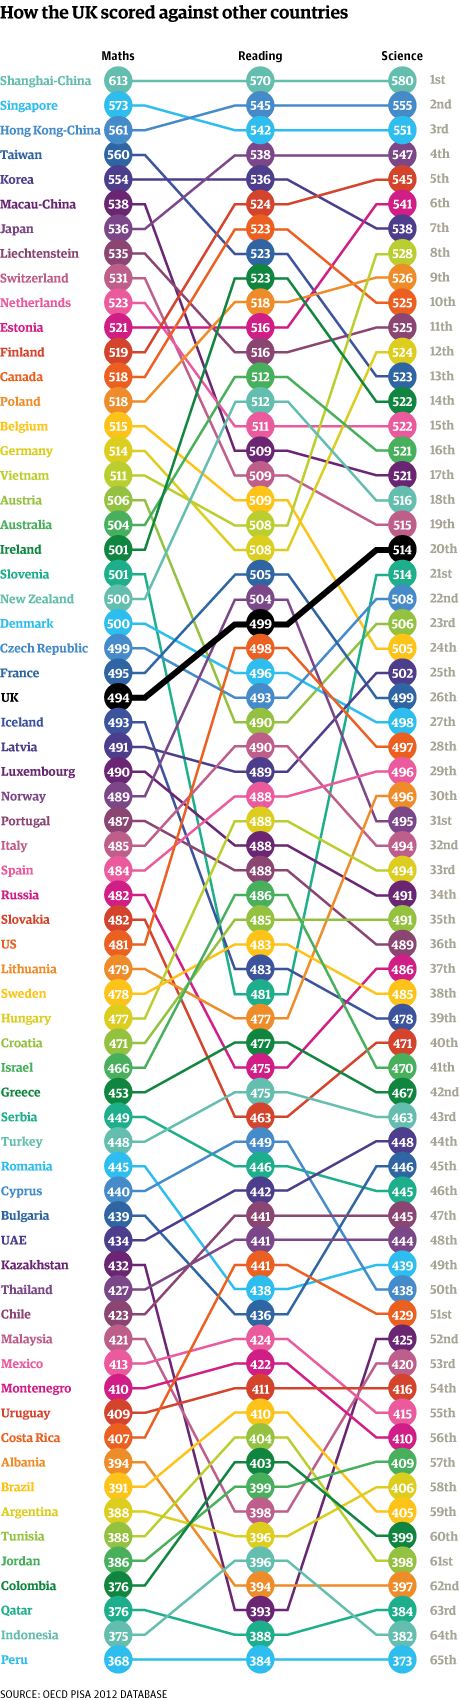
The latest Programme for International Assessment (Pisa) results are out today. The release by the Organisation for Economic Co-operation and Development (OECD) shows that the UK has seen slight improvements in maths and reading performance but has slipped down four places in the overall ranking for science.
The UK is ranked 23rd for reading, 26th for maths and 20th for science. In 2009 it was placed 25th, 28th and 16th respectively. Shanghai tops the overall ranking with Singapore and Hong Kong being placed second and third place respectively.
Since 2000, the OECD has attempted to evaluate the knowledge and skills of 15-year olds across the world through its Pisa test. More than 510,000 students in 65 economies took part in the latest test, which covered maths, reading and science, with the main focus on maths - which the OECD state is a "strong predictor of participation in post-secondary education and future success."
The triennial results provide a wealth of data - from which countries are making the biggest improvements in education ranking to how the gender gap varies by subject. We've picked out some key figures from the report:
Who's top of the class?
"Asian countries outperform the rest of the world", according to the OECD, with Shanghai, Singapore, Hong Kong, Taiwan, South Korea, Macau and Japan amongst the top performing countries and economies. Students in Shanghai performed so well in maths that the OECD report compares their scoring to the equivalent of nearly three years of schooling above most OECD countries.
Of the 64 countries with comparable data up to 2012, 32 improved their reading performance while 22 showed no change and 10 deteriorated. If you look at performance at maths, 25 show an average annual improvement, 25 show no change, and 14 show a deterioration in performance.
Qatar, Kazakhstan and Malaysia recorded an average improvement in maths performance of more than eight points per year. The OECD report also praises Brazil, Chile, Germany, Israel, Italy, Mexico, Poland, Portugal, Tunisia and Turkey who it claims have "shown a consistent improvement" over time in maths performance.
Qatar had the highest reading score-point difference associated with one calendar year although the OECD warn that when looking at annualised change that "the average change experienced over successive PISA assessments doesn't capture the extent to which this change is steady, or whether it is decelerating or accelerating".
Of 64 countries with comparable data, 19 reported an average annual improvement in science performance, 37 showed no change and eight recorded a decline.
Kazakhstan, Turkey and Qatar all reported annualised change of more than five points in science performance.
Boys perform better than girls in maths
Boys scored higher than girls in maths in 37 out of the 65 countries and economies, while girls outperformed boys in just five countries; Jordan, Qatar, Thailand, Malaysia and Iceland. The OECD claim though that the gender gap is relatively small - in only six countries is it greater than the equivalent of half a year of schooling.
According to the OECD, girls "feel less motivated to learn maths and have less confidence in their abilities than boys".
The OECD also found that between 2000 and 2012, the gender gap in reading performance - favouring girls - widened in 11 countries.
The Pisa results show that when it comes to science, boys and girls perform similarly. But in Colombia, Japan and Spain a gender gap in favour of boys was observed in 2012 despite no significant difference existing in 2006.
Adjusted for income
The report also looks at how the wealth of a country affected the success of its students in mathematical tests. There is a correlation between a higher GDP per capita and a successful performance.
The report says:
The relationship suggests that 21% of the variation in countries' mean scores can be predicted on the basis of their per capita GDP (12% of the variation in OECD countries). Countries with higher national incomes are thus at a relative advantage, even if the chart provides no indications about the causal nature of this relationship.
This should be taken into account particularly when interpreting the performance of countries with comparatively low levels of national income, such as Viet Nam and Indonesia (Mexico and Turkey among OECD countries).
The scatter graph below shows how nations GDP per capita correlates with their performance in mathematical tests. Although it is worth noting there are some exceptions to this rule. For example, Qatar, which had a relatively low mean mathematics score of 376 despite its way above average $77,000 GDP per capita.
Correlation with spending on education
Similarly, spending on education has an even stronger match with performance in mathematical tests. It accounts for 30% of the variation in performance between countries and 17% of the variation within OECD countries.
However, South Korea, which has the best mean performance of any country in the tests spends well below the average on education, one of several anomalies showing the pattern is not universally applicable.
The table below shows the mean scores across the three subjects tested in the Pisa assessments. The table has been colour coded to show how the scores compare against the OECD average. Green shows a score above the OECD average, blue signifies in line with the OECD average and red illustrates a score below the OECD average. Pisa results for 2009 and 2012 can be found in our downloadable spreadsheet.
Download the data
• DATA: download the full spreadsheet
More open data
Data journalism and data visualisations from the Guardian
Development and aid data
• Search the world's global development data with our gateway
Can you do more with this data?
• Contact us at data@guardian.co.uk
• Follow us on Twitter
• Like us on Facebook
