


It’s no secret that all across the web, people are generating billions of gigabytes of data per day. This huge amount of information termed “Big Data,” is impossible to keep track of without first organizing it into an easily digestible format.
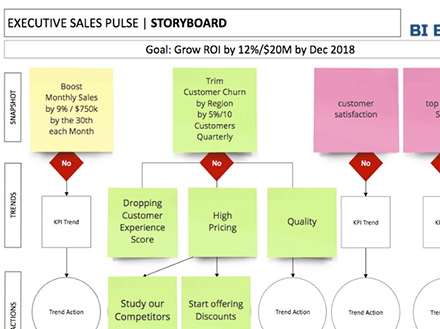
Turning Big Data into Understandable Visuals
Data visualization can help you to pare down the extensive influxes of data such as customer interactions, changing industry trends, and daily company operations. The right data visualization turns overwhelming data into beautiful interactive charts and graphics that you can use to improve the way that you do business. Below are a list of sites that we use for daily creative stimulation and motivation. We thought it would be great to share!
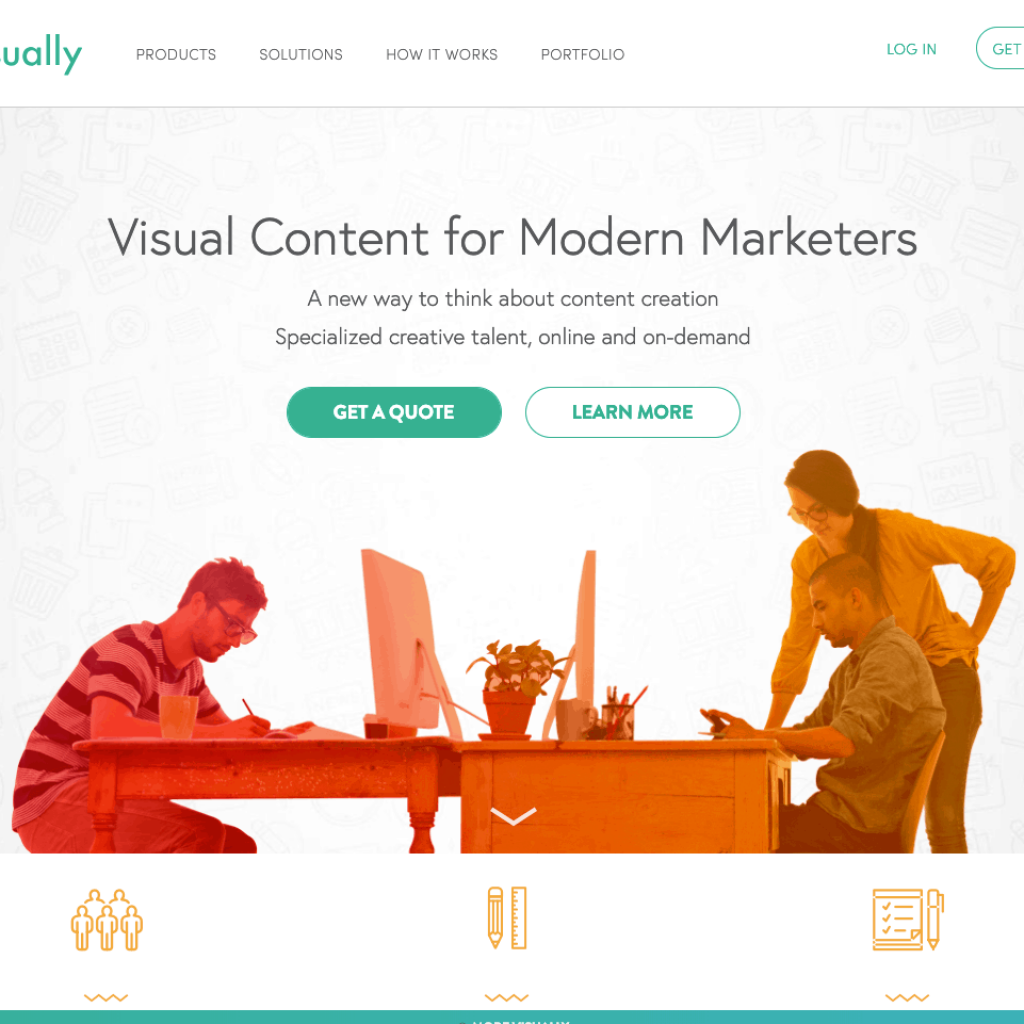
As the founders of the largest online infographic community, Visual.ly is definitely one of our favorite go-to sites for creative inspiration. It’s a huge variety of infographics proves how easy it is to build a data visualization for just about anything. It is particularly useful when you need good ideas on how to start visualizing your big data story. Recently, the folks at Visual.ly started to offer their services to help you to take any size data and convert it into a compelling infographic. Based on our research they start at around $2,500 and can go as high as $25,000! They are however the best in business. We plan to give them a try and will post an update.
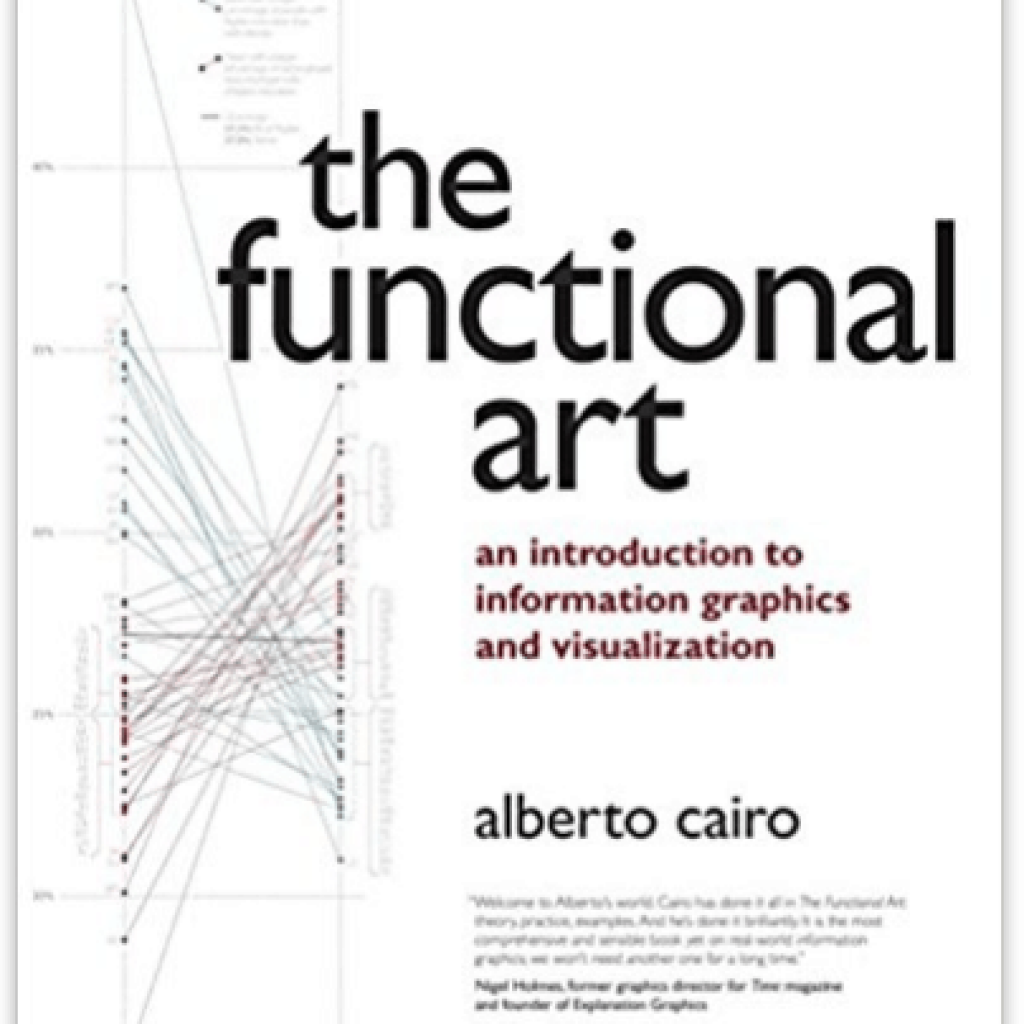
While Alberto Cairo is a bit new to the Data Visualization space, and seemed to have popped up online out of nowhere, since the release of his book and blog ‘Functional Art’ in 2012, he has definitely caught up quickly. Now known as a highly regarded speaker on the topic of data visualization, his blog quickly nabbed the number two spot on our list. The one thing to note is that Alberto mainly focuses on visualizing journalism data, but a lot of what he teaches applies to the analytics and business intelligence field of practice. In addition to subscribing to his blog, his @albertocairo twitter account has over 22,000 followers at the time of this posting. We’ve had the pleasure to meet him and he’s such an amazing guy!
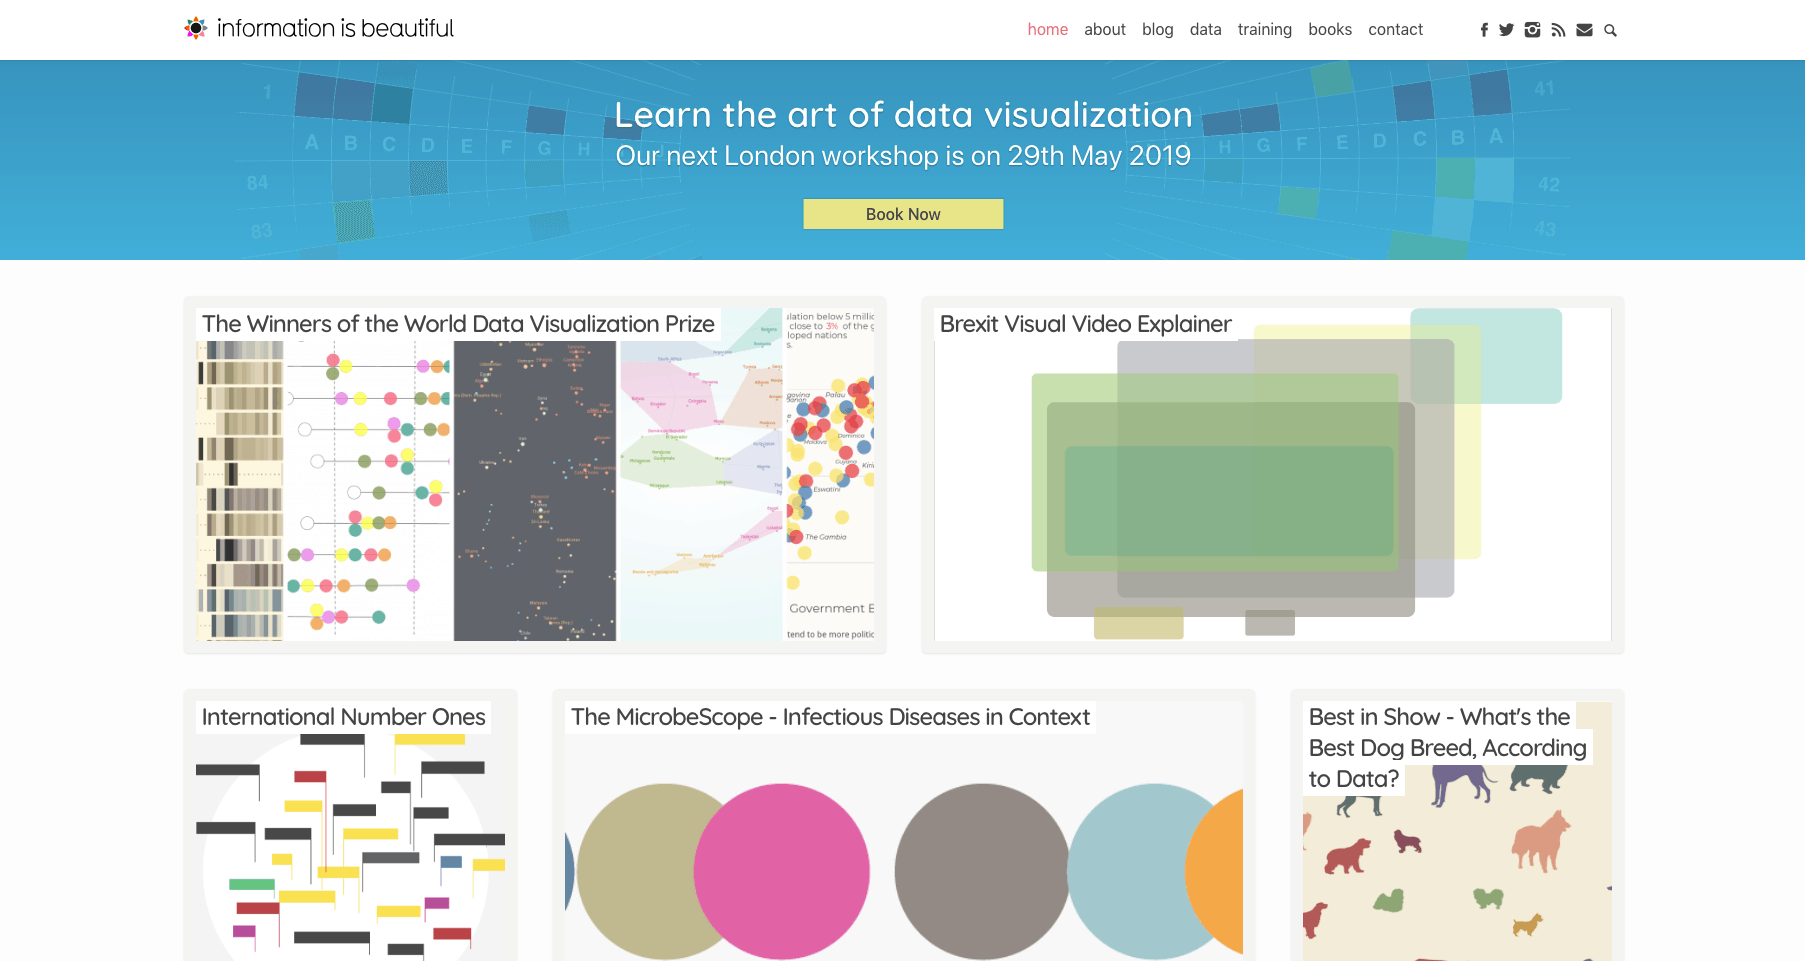
We were big fans of this book before meeting David McCandless back in May. Not only is his work compelling, but his very ‘British’ approach to the data viz topic was quite fun to listen to. While Information is Beautiful type visualizations may be a bit out of reach for most of ‘us’ regular folks, following his blog is great to keep the creative juices running. He often focuses on displaying world related data, so it’s always fun to see what he comes up with next. We’re big fans!
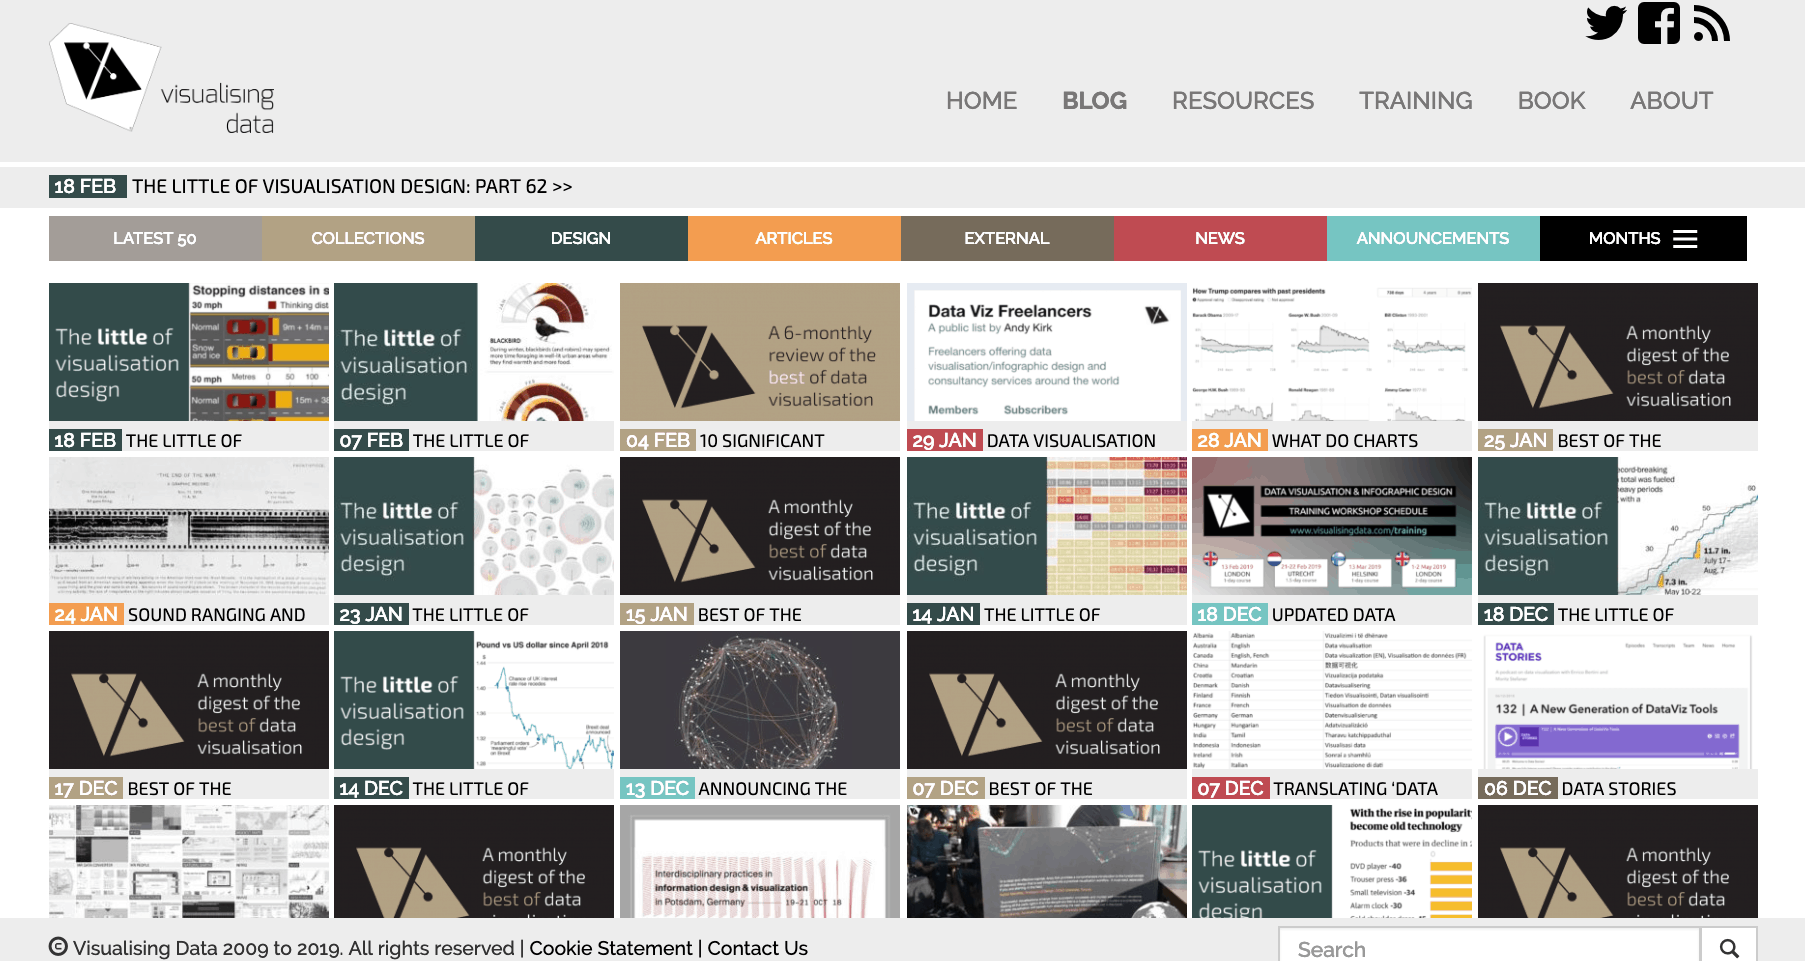
Founded by another famed author, Andy Kirk, we love the Visualizing Data blog for its diversity in information but strict focus on data visualization. You can get everything from best practices to a long list of wild big data visualization examples. Our favorite blog category is ‘Collections’ where Kirk gives a monthly recap of articles he pulls together with some of the best content on the web. We’re looking forward to his new book!
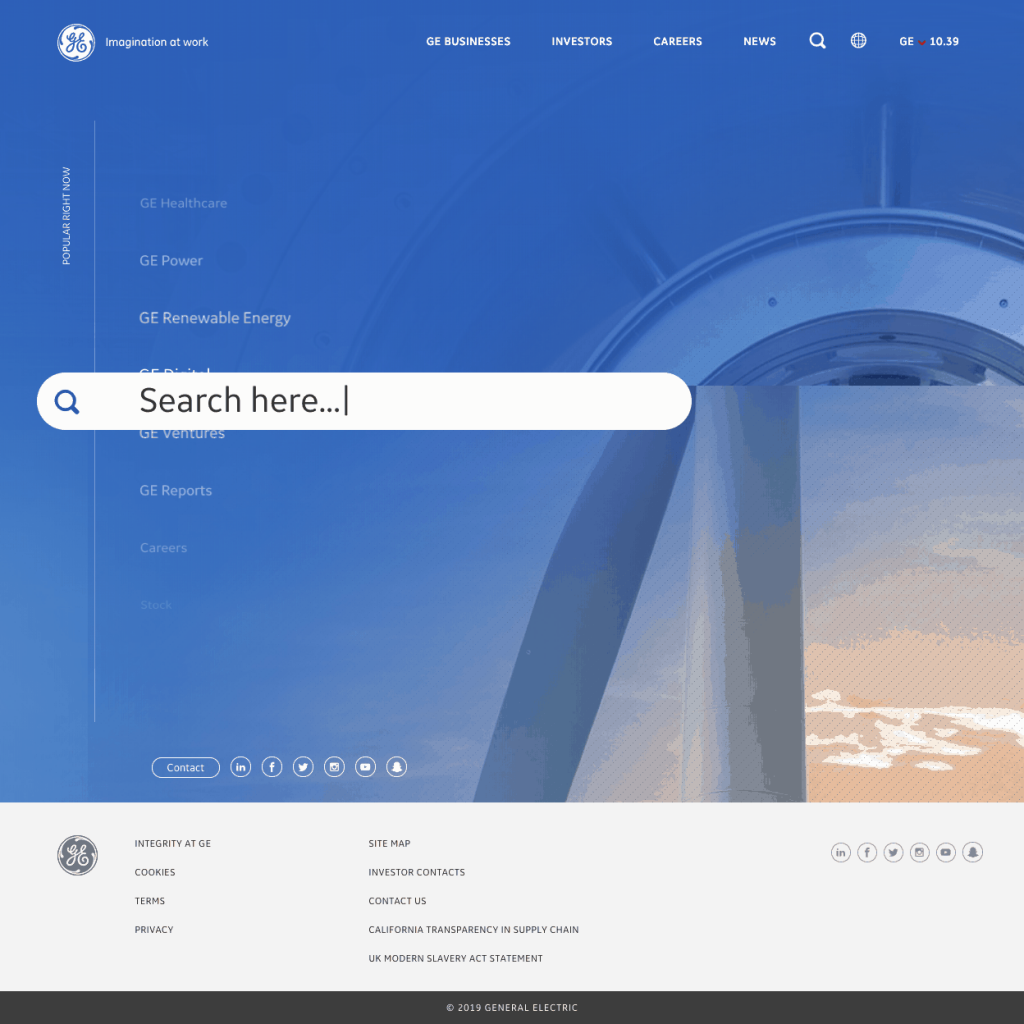
It’s seldom that we’ll feature a big company like GE as one of our favorite community sites (we tend to find individual run communities a bit more interesting), but GE’s Visualization blog has truly done a great job with their visualization site. They keep the site updated with amazing use cases of how they use data to literally change the world. Even if you’re not into the ‘energy’ topic, this blog is intriguing to follow. Perhaps other big companies will follow suit. Most just talk a good game. Due to its ‘vast’ budget, GE also posts amazing videos showcasing what they are doing. Great job for a big enterprise.
These are our favorites, but I’d like to hear yours.
Which sites do you follow to get your creative fix?