Short-Term Effects of a High Nitrate Diet on Nitrate Metabolism in Healthy Individuals

 and
and
Abstract
:1. Introduction
2. Method
2.1. Participants
2.2. Study Design
2.3. Nitrate and Nitrite Analysis
2.4. Statistics
3. Results
3.1. Participants and Dietary Nitrate Intake
3.2. Saliva, Plasma and Urine Nitrate and Nitrite

| Saliva/Plasma/Urine | Nitrate/nitrite | D0 | D7 | +2D | +7D | +14D |
|---|---|---|---|---|---|---|
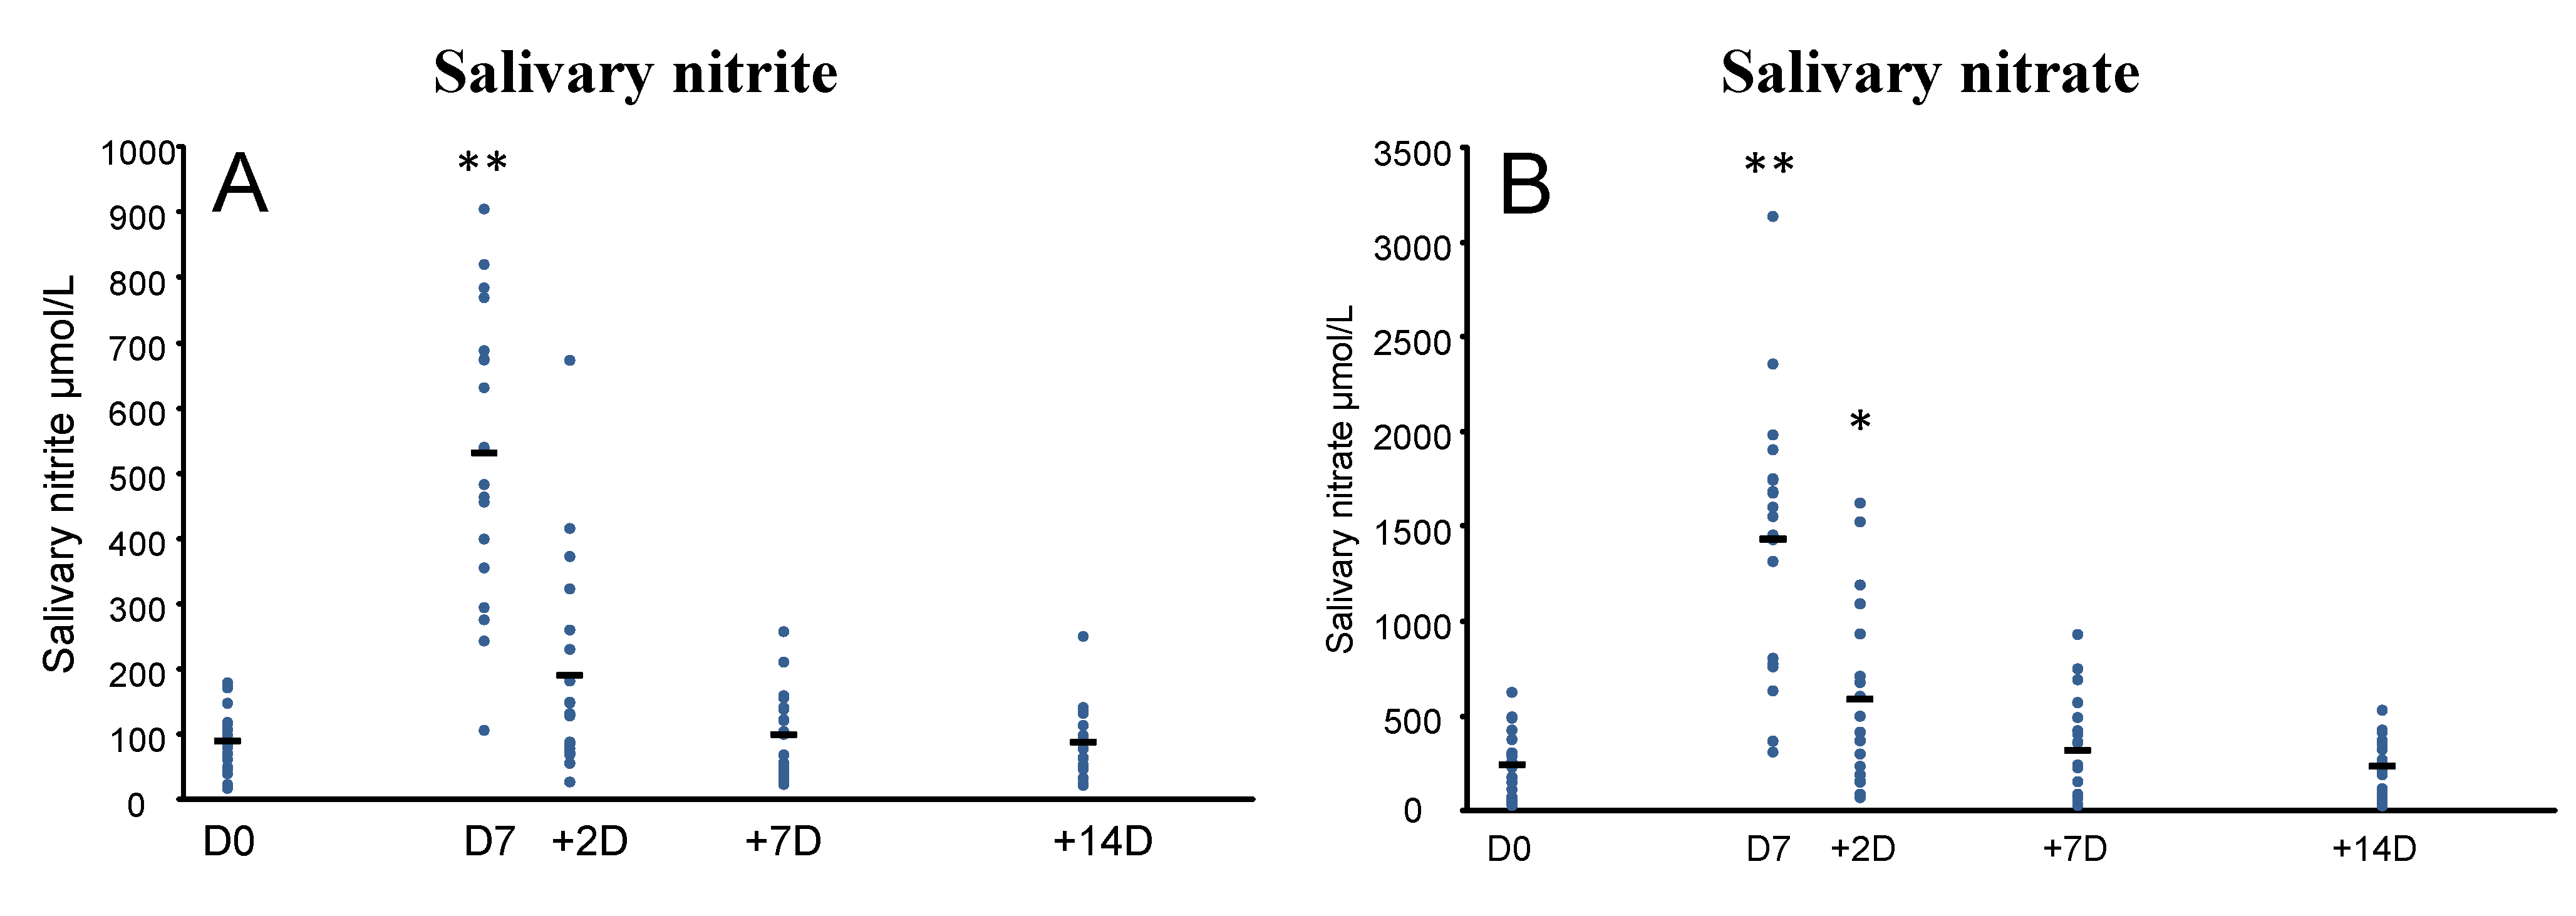
| Saliva b | Nitrate μmol/L | 246.3 (174.8) | 1437.8 ** (706.5) | 593.2 * (477.7) | 322.4 (270.0) | 238.3 (143.7) |
| Nitrite μmol/L | 90.6 (50.9) | 532.4 ** (219.3) | 191.3 (160.4) | 100.2 (66.6) | 89.0 (53.4) | |
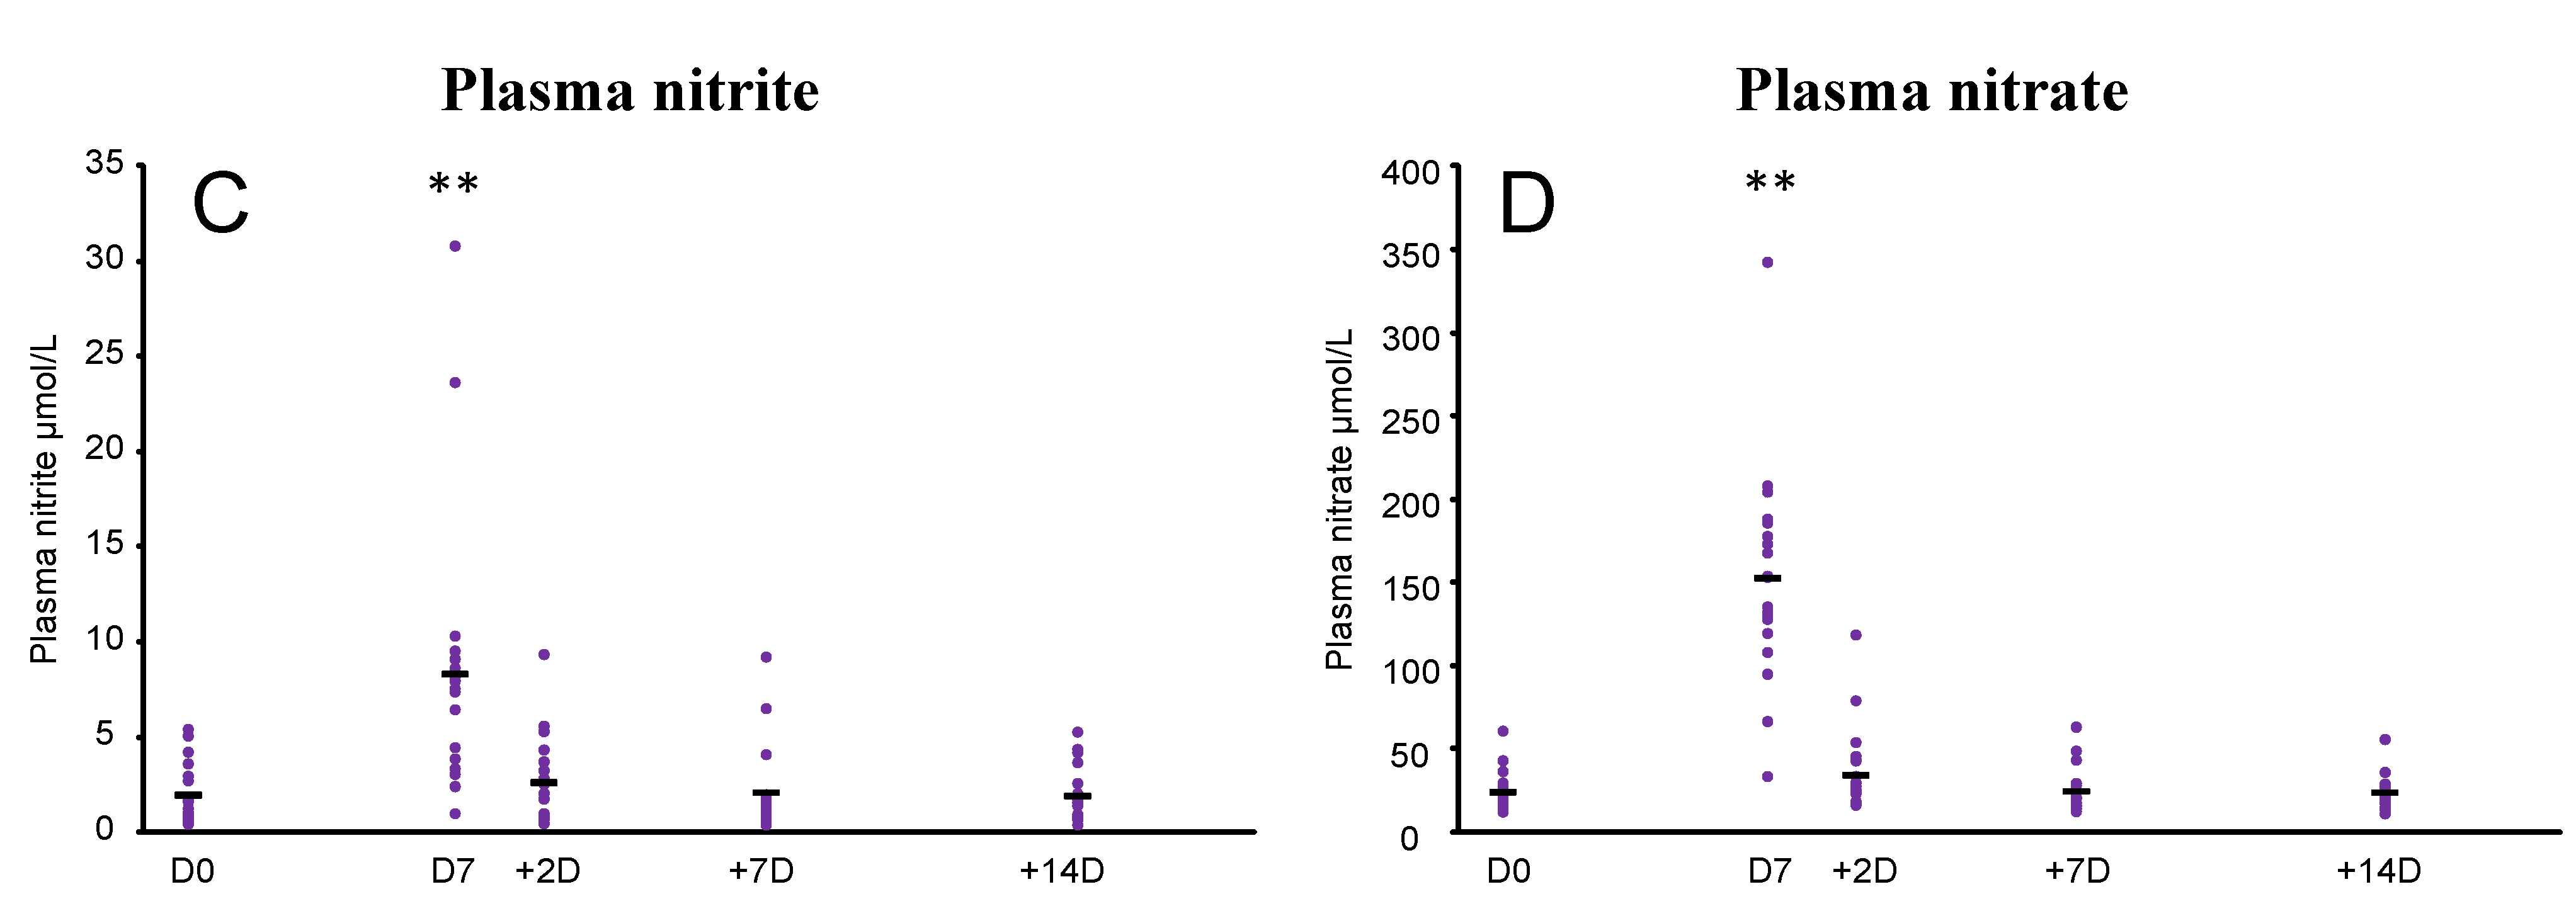
| Plasma b | Nitrate μmol/L | 24.8 (11.9) | 154.8 ** (66.0) | 36.7 (26.3) | 25.0 (13.9) | 24.2 (9.2) |
| Nitrite μmol/L | 2.0 (1.6) | 8.3 ** (7.3) | 2.8 (2.3) | 2.1 (2.2) | 1.9 (1.4) | |
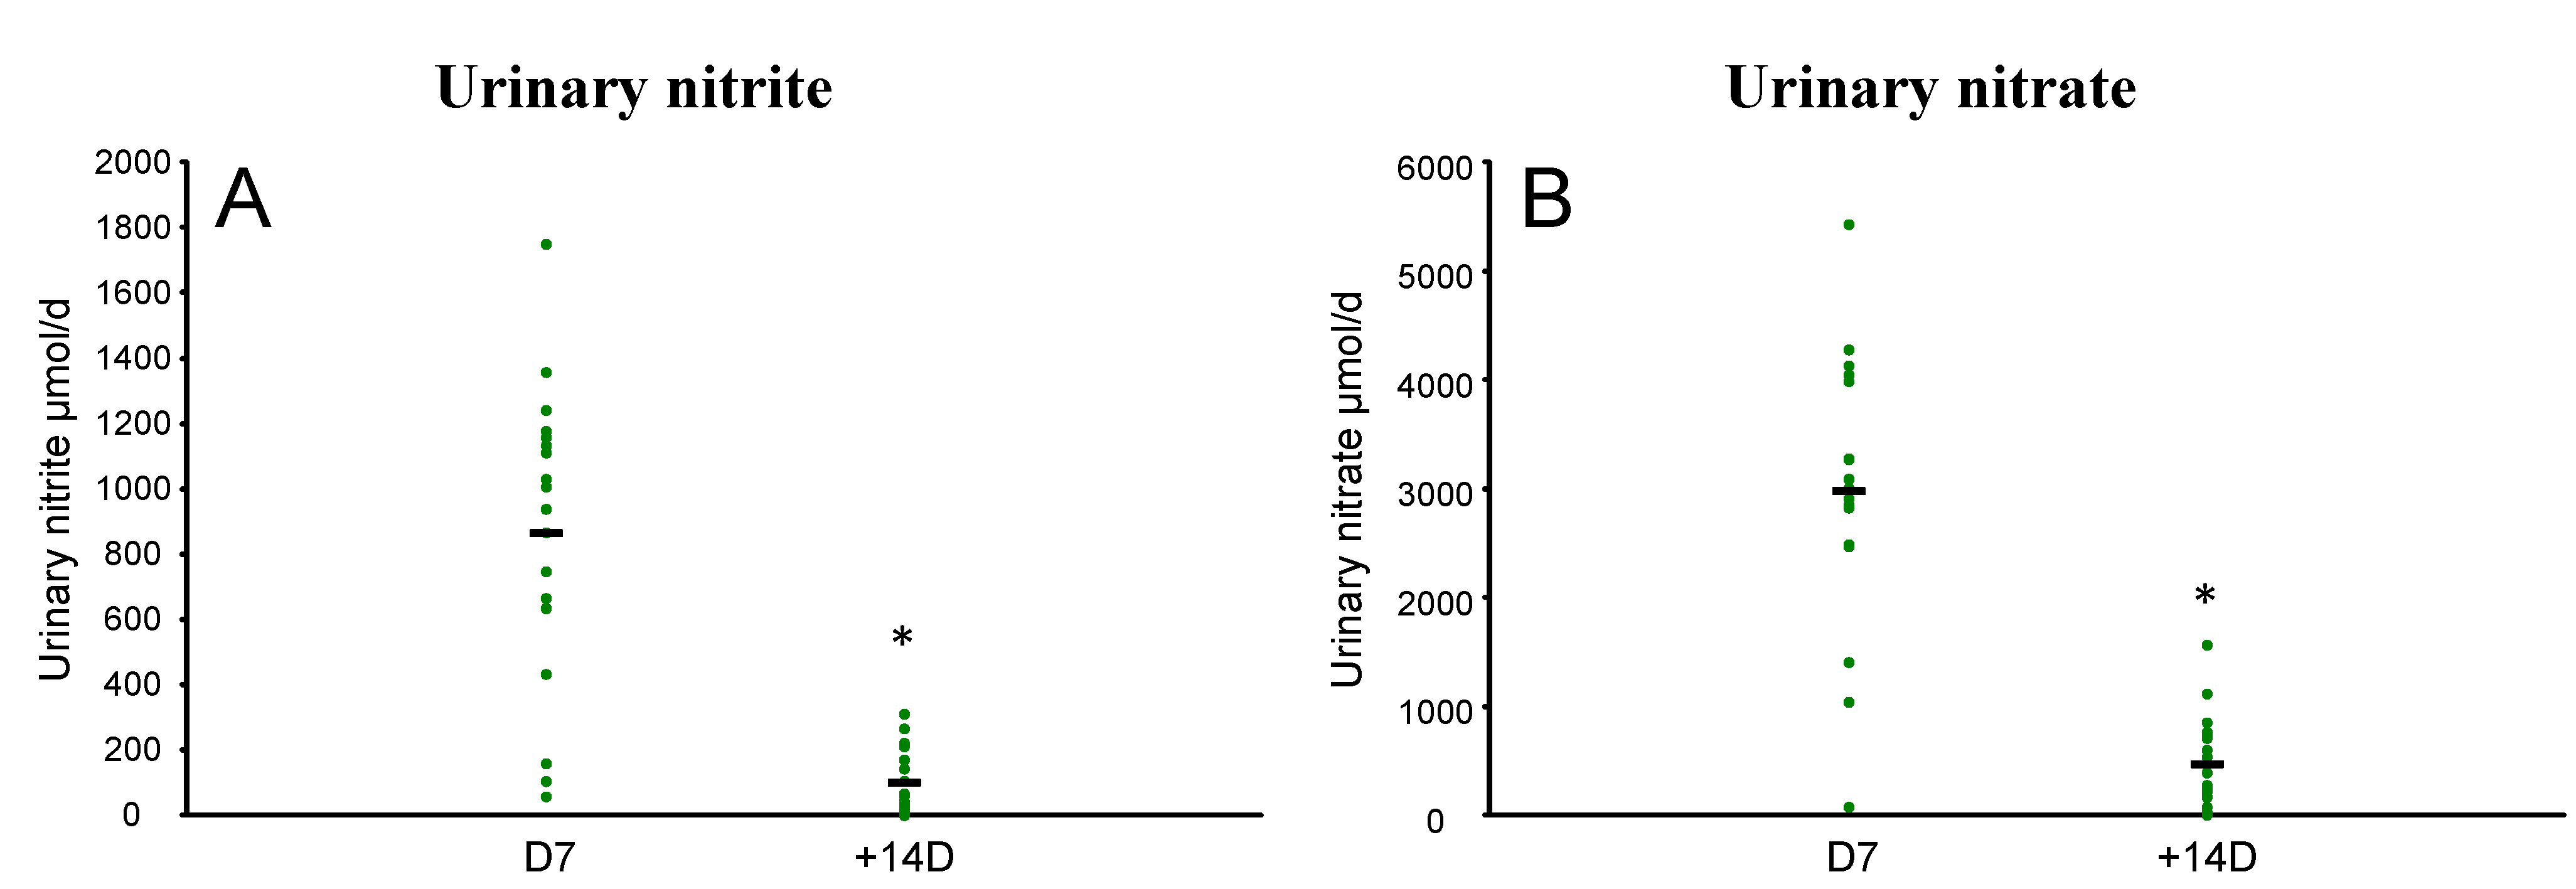
| Urine c | Nitrate μmol/day | 2985.7 (1250.4) | 427.7 ** (100.8) | |||
| Nitrite μmol/day | 865.7 (457.5) | 102.0 ** (96.2) |
 ), and mean (-). Effects were analysed using paired t-tests in SPSS (* p < 0.001 compared to D7).
), and mean (-). Effects were analysed using paired t-tests in SPSS (* p < 0.001 compared to D7).
), and mean (-). Effects were analysed using paired t-tests in SPSS (* p < 0.001 compared to D7).
 ), and mean (-). Effects were analysed using repeated measures ANOVA in SPSS (* p < 0.05; ** p < 0.001 compared to D0). Bonferroni’s adjustment was used for multiple comparisons.
), and mean (-). Effects were analysed using repeated measures ANOVA in SPSS (* p < 0.05; ** p < 0.001 compared to D0). Bonferroni’s adjustment was used for multiple comparisons.
), and mean (-). Effects were analysed using repeated measures ANOVA in SPSS (* p < 0.05; ** p < 0.001 compared to D0). Bonferroni’s adjustment was used for multiple comparisons.

4. Discussion
Acknowledgments
Author Contributions
Conflicts of Interest
References
- Webb, A.J.; Patel, N.; Loukogeorgakis, S.; Okorie, M.; Aboud, Z.; Misra, S.; Rashid, R.; Miall, P.; Deanfield, J.; Benjamin, N.; et al. Acute blood pressure lowering, vasoprotective, and antiplatelet properties of dietary nitrate via bioconversion to nitrite. Hypertension 2008, 51, 784–790. [Google Scholar] [CrossRef] [PubMed]
- Cosby, K.; Partovi, K.S.; Crawford, J.H.; Patel, R.P.; Reiter, C.D.; Martyr, S.; Yang, B.K.; Waclawiw, M.A.; Zalos, G.; Xu, X.; et al. Nitrite reduction to nitric oxide by deoxyhemoglobin vasodilates the human circulation. Nat. Med. 2003, 9, 1498–1505. [Google Scholar] [CrossRef] [PubMed]
- Bondonno, C.P.; Yang, X.; Croft, K.D.; Considine, M.J.; Ward, N.C.; Rich, L.; Puddey, I.B.; Swinny, E.; Mubarak, A.; Hodgson, J.M. Flavonoid-rich apples and nitrate-rich spinach augment nitric oxide status and improve endothelial function in healthy men and women: A randomized controlled trial. Free Radic. Biol. Med. 2012, 52, 95–102. [Google Scholar] [CrossRef] [PubMed]
- Liu, A.H.; Bondonno, C.P.; Croft, K.D.; Puddey, I.B.; Woodman, R.J.; Rich, L.; Ward, N.C.; Vita, J.A.; Hodgson, J.M. Effects of a nitrate-rich meal on arterial stiffness and blood pressure in healthy volunteers. Nitric Oxide 2013, 35, 123–130. [Google Scholar] [CrossRef] [PubMed]
- Bailey, S.J.; Fulford, J.; Vanhatalo, A.; Winyard, P.G.; Blackwell, J.R.; DiMenna, F.J.; Wilkerson, D.P.; Benjamin, N.; Jones, A.M. Dietary nitrate supplementation enhances muscle contractile efficiency during knee-extensor exercise in humans. J. Appl. Physiol. 2010, 109, 135–148. [Google Scholar] [CrossRef] [PubMed]
- Bondonno, C.P.; Liu, A.H.; Croft, K.D.; Ward, N.C.; Yang, X.; Considine, M.J.; Puddey, I.B.; Woodman, R.J.; Hodgson, J.M. Short-term effects of nitrate-rich green leafy vegetables on blood pressure and arterial stiffness in individuals with high-normal blood pressure. Free Radic. Biol. Med. 2014. [Google Scholar] [CrossRef]
- Cermak, N.M.; Gibala, M.J.; van Loon, L.J. Nitrate supplementation’s improvement of 10-km time-trial performance in trained cyclists. Int. J. Sport Nutr. Exerc. Metab. 2012, 22, 64–71. [Google Scholar] [PubMed]
- Gilchrist, M.; Winyard, P.G.; Aizawa, K.; Anning, C.; Shore, A.; Benjamin, N. Effect of dietary nitrate on blood pressure, endothelial function and insulin sensitivity in type 2 diabetes. Free Radic. Biol. Med. 2013, 60, 89–97. [Google Scholar] [CrossRef] [PubMed] [Green Version]
- Kapil, V.; Khambata, R.S.; Robertson, A.; Caulfield, M.J.; Ahluwalia, A. Dietary nitrate provides sustained blood pressure lowering in hypertensive patients a randomized, phase 2, double-blind, placebo-controlled study. Hypertension 2015, 65, 320–327. [Google Scholar] [CrossRef] [PubMed]
- Lundberg, J.O.; Weitzberg, E. No-synthase independent no generation in mammals. Biochem. Biophys. Res. Commun. 2010, 396, 39–45. [Google Scholar] [CrossRef] [PubMed]
- Van Velzen, A.G.; Sips, A.J.A.M.; Schothorst, R.C.; Lambers, A.C.; Meulenbelt, J. The oral bioavailability of nitrate from nitrate-rich vegetables in humans. Toxicol. Lett. 2008, 181, 177–181. [Google Scholar] [CrossRef] [PubMed]
- Yang, X.; Bondonno, C.P.; Indrawan, A.; Hodgson, J.M.; Croft, K.D. An improved mass spectrometry-based measurement of no metabolites in biological fluids. Free Radic. Biol. Med. 2013, 56, 1–8. [Google Scholar] [CrossRef] [PubMed]
- Griesenbeck, J.S.; Steck, M.D.; Huber, J.C., Jr.; Sharkey, J.R.; Rene, A.A.; Brender, J.D. Development of estimates of dietary nitrates, nitrites, and nitrosamines for use with the short willet food frequency questionnaire. Nutr. J. 2009, 8. [Google Scholar] [CrossRef] [PubMed]
- Lundberg, J.O.; Govoni, M. Inorganic nitrate is a possible source for systemic generation of nitric oxide. Free Radic. Biol. Med. 2004, 37, 395–400. [Google Scholar] [CrossRef] [PubMed]
- Hord, N.G.; Tang, Y.; Bryan, N.S. Food sources of nitrates and nitrites: The physiologic context for potential health benefits. Am. J. Clin. Nutr. 2009, 90, 1–10. [Google Scholar] [CrossRef] [PubMed]
- Jin, R.C.; Loscalzo, J. Vascular nitric oxide: Formation and function. J. Blood Med. 2010, 1, 147–162. [Google Scholar]
- Dejam, A.; Hunter, C.J.; Tremonti, C.; Pluta, R.M.; Hon, Y.Y.; Grimes, G.; Partovi, K.; Pelletier, M.M.; Oldfield, E.H.; Cannon, R.O.; et al. Nitrite infusion in humans and nonhuman primates. Circulation 2007, 116, 1821–1831. [Google Scholar] [CrossRef] [PubMed]
- Lundberg, J.O.; Weitzberg, E.; Gladwin, M.T. The nitrate-nitrite-nitric oxide pathway in physiology and therapeutics. Nat. Rev. Drug Discov. 2008, 7, 156–167. [Google Scholar] [CrossRef] [PubMed]
- Miller, G.D.; Marsh, A.P.; Dove, R.W.; Beavers, D.; Presley, T.; Helms, C.; Bechtold, E.; King, S.B.; Kim-Shapiro, D. Plasma nitrate and nitrite are increased by a high-nitrate supplement but not by high-nitrate foods in older adults. Nutr. Res. 2012, 32, 160–168. [Google Scholar] [CrossRef] [PubMed]
- Lundberg, J.O.; Weitzberg, E.; Lundberg, J.M.; Alving, K. Intragastric nitric oxide production in humans: Measurements in expelled air. Gut 1994, 35, 1543–1546. [Google Scholar] [CrossRef] [PubMed]
- Wagner, D.A.; Schultz, D.S.; Deen, W.M.; Young, V.R.; Tannenbaum, S.R. Metabolic fate of an oral dose of 15n-labeled nitrate in humans: Effect of diet supplementation with ascorbic acid. Cancer Res. 1983, 43, 1921–1925. [Google Scholar] [PubMed]
- Bondonno, C.P.; Downey, L.A.; Croft, K.D.; Scholey, A.; Stough, C.; Yang, X.; Considine, M.J.; Ward, N.C.; Puddey, I.B.; Swinny, E. The acute effect of flavonoid-rich apples and nitrate-rich spinach on cognitive performance and mood in healthy men and women. Food Funct. 2014, 5, 849–858. [Google Scholar] [CrossRef] [PubMed]
- Pannala, A.S.; Mani, A.R.; Spencer, J.P.; Skinner, V.; Bruckdorfer, K.R.; Moore, K.P.; Rice-Evans, C.A. The effect of dietary nitrate on salivary, plasma, and urinary nitrate metabolism in humans. Free Radic. Biol. Med. 2003, 34, 576–584. [Google Scholar] [CrossRef] [PubMed]
© 2015 by the authors; licensee MDPI, Basel, Switzerland. This article is an open access article distributed under the terms and conditions of the Creative Commons Attribution license (http://creativecommons.org/licenses/by/4.0/).
Share and Cite
Bondonno, C.P.; Liu, A.H.; Croft, K.D.; Ward, N.C.; Puddey, I.B.; Woodman, R.J.; Hodgson, J.M. Short-Term Effects of a High Nitrate Diet on Nitrate Metabolism in Healthy Individuals. Nutrients 2015, 7, 1906-1915. https://doi.org/10.3390/nu7031906
Bondonno CP, Liu AH, Croft KD, Ward NC, Puddey IB, Woodman RJ, Hodgson JM. Short-Term Effects of a High Nitrate Diet on Nitrate Metabolism in Healthy Individuals. Nutrients. 2015; 7(3):1906-1915. https://doi.org/10.3390/nu7031906
Chicago/Turabian StyleBondonno, Catherine P., Alex H. Liu, Kevin D. Croft, Natalie C. Ward, Ian B. Puddey, Richard J. Woodman, and Jonathan M. Hodgson. 2015. "Short-Term Effects of a High Nitrate Diet on Nitrate Metabolism in Healthy Individuals" Nutrients 7, no. 3: 1906-1915. https://doi.org/10.3390/nu7031906