
4 types of user
I’ve been working with Neo4j full time for slightly more than a year now and from interacting with the community I’ve noticed that while using different features of the product people fall into 4 categories.
These are as follows:
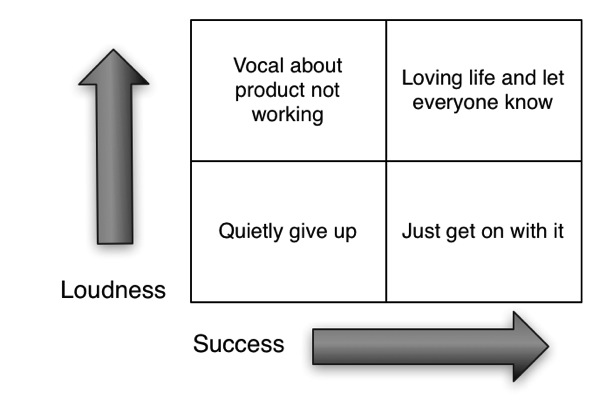
On one axis we have 'loudness' i.e. how vocal somebody is either on twitter, StackOverflow or by email and on the other we have 'success' which is how well a product feature is working for them.
The people in the top half of the diagram will get the most attention because they’re the most visible.
Of those people we’ll tend to spend more time on the people who are unhappy and vocal to try and help them solve the problems their having.
When working with the people in the top left it’s difficult to understand how representative they are for the whole user base.
It could be the case that they aren’t representative at all and actually there is a quiet majority who the product is working for and are just getting on with it with no fuss.
However, it could equally be the case that they are absolutely representative and there are a lot of users quietly suffering / giving up using the product.
I haven’t come up with a good way to come across the less vocal users but in my experience they’ll often be passive users of the user group or Stack Overflow i.e. they’ll read existing issues but not post anything themselves.
Given this uncertainty I think it makes sense to assume that the silent majority suffer the same problems as the more vocal minority.
Another interesting thing I’ve noticed about this quadrant is that the people in the top right are often the best people in the community to help those who are struggling.
It’d be interesting to know whether anyone has noticed a similar thing with the products they worked on, and if so what approach do you take to unveiling the silent majority?
About the author
I'm currently working on short form content at ClickHouse. I publish short 5 minute videos showing how to solve data problems on YouTube @LearnDataWithMark. I previously worked on graph analytics at Neo4j, where I also co-authored the O'Reilly Graph Algorithms Book with Amy Hodler.