Finding the Needle in a Haystack: Anomaly Detection with the ELK Stack

The following scenario might sound familiar.
It’s the middle of the night. Your mobile starts vibrating. On the other end, it’s a frantic customer (or your boss) complaining that the website is down. You enter crisis mode and start the troubleshooting process, which involves ingesting a large amount of caffeine and — usually — ends with the problem being solved.
Sometimes, this scenario can be avoided by using the correct logging and monitoring strategy. Centralized logging, for example, is a useful strategy to implement but not easy to use. The biggest challenge, of course, is sifting through the huge volumes of log data that come into the system and identifying correlations and anomalies.
One of the reasons that the ELK Stack is so popular is that it is a very useful tool for streaming large sets of data from different sources, identifying correlations using queries and searches, and creating rich visualizations and monitoring dashboards on top of them.
This post describes a simple workflow process to troubleshoot a website crash by analyzing different types of logs and finding a correlation between them. To do this, we will use the enterprise-grade ELK Stack hosted by Logz.io — but most of the described steps can be performed with any installation of open source ELK.
The scenario that I will use consists of a simple web application that is based on an Apache web server and MySQL database. In this case, the ELK Stack is ingesting Apache logs, database logs, and server performance metrics using the Logz.io performance agent.
It’s crisis time
To start the troubleshooting process, we’re going to access our Kibana interface and begin querying Elasticsearch for relevant log messages.
First, I’m going to set the time frame to “Today” to get an overview of all of the recent events being logged:
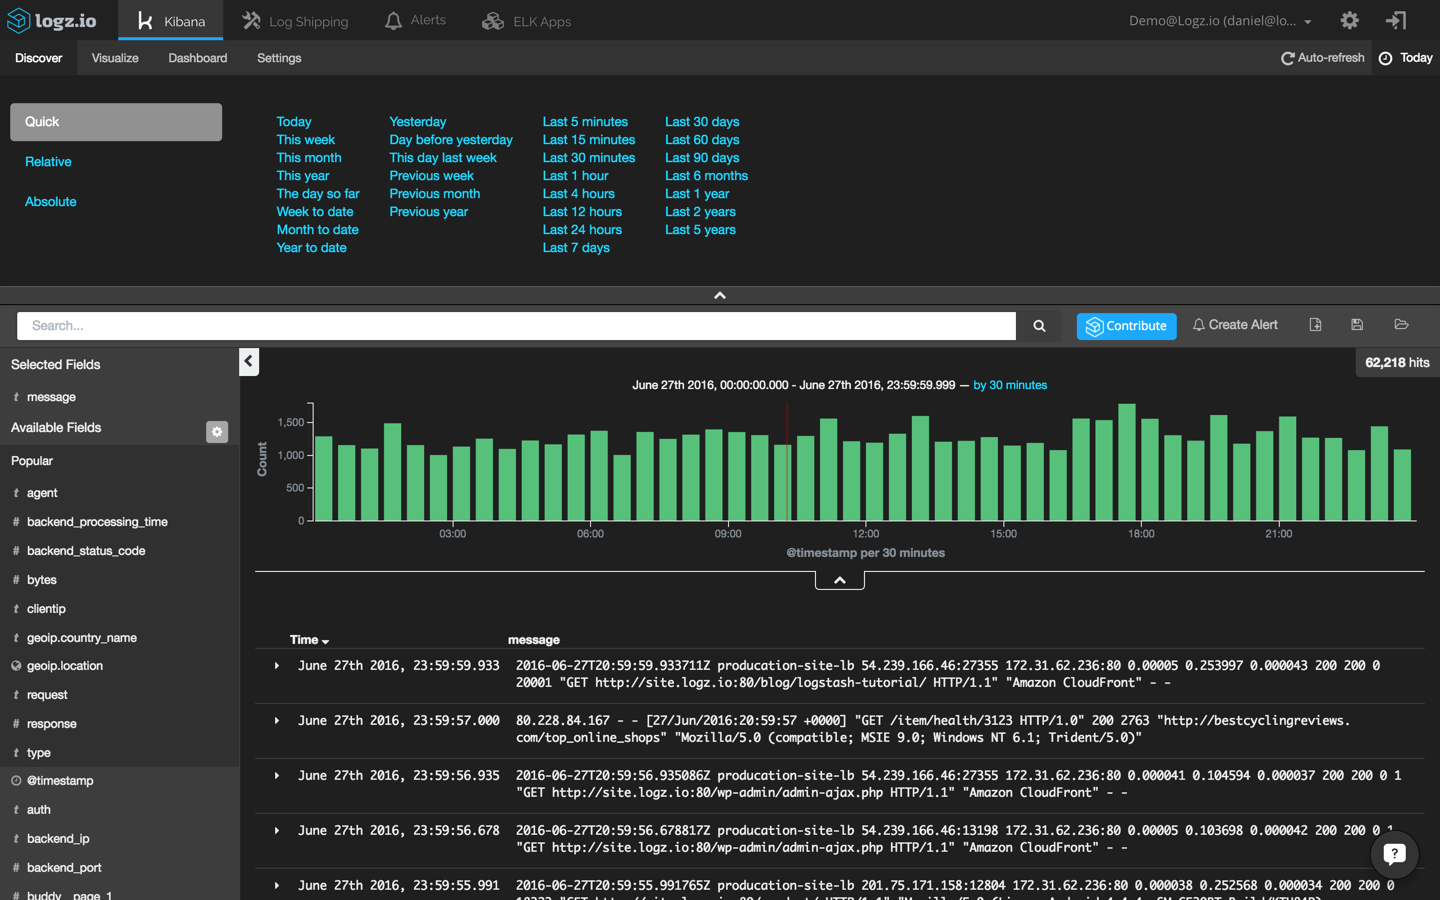
In this case, I can see more than 60,000 log messages within this time frame. Not very useful, right? It’s time to try and find our needle in the haystack by querying Elasticsearch in Kibana.
Querying is Kibana’s bread and butter and an art unto itself, but the truth is that it is not always easy. I’d recommend reading up on the topic in our Kibana tutorial to acquaint yourself with the various types of searches.
Now, since we’re investigating a site crash, a good place to start would be our Apache logs (you can also read more here about using the ELK Stack as an Apache log analyzer). Specifically, we’re going to use a field-level search to pinpoint Apache error messages:
type:apache_access AND response:[500 TO *]
This returns a list of 730 Apache errors with response codes of 500 and above:
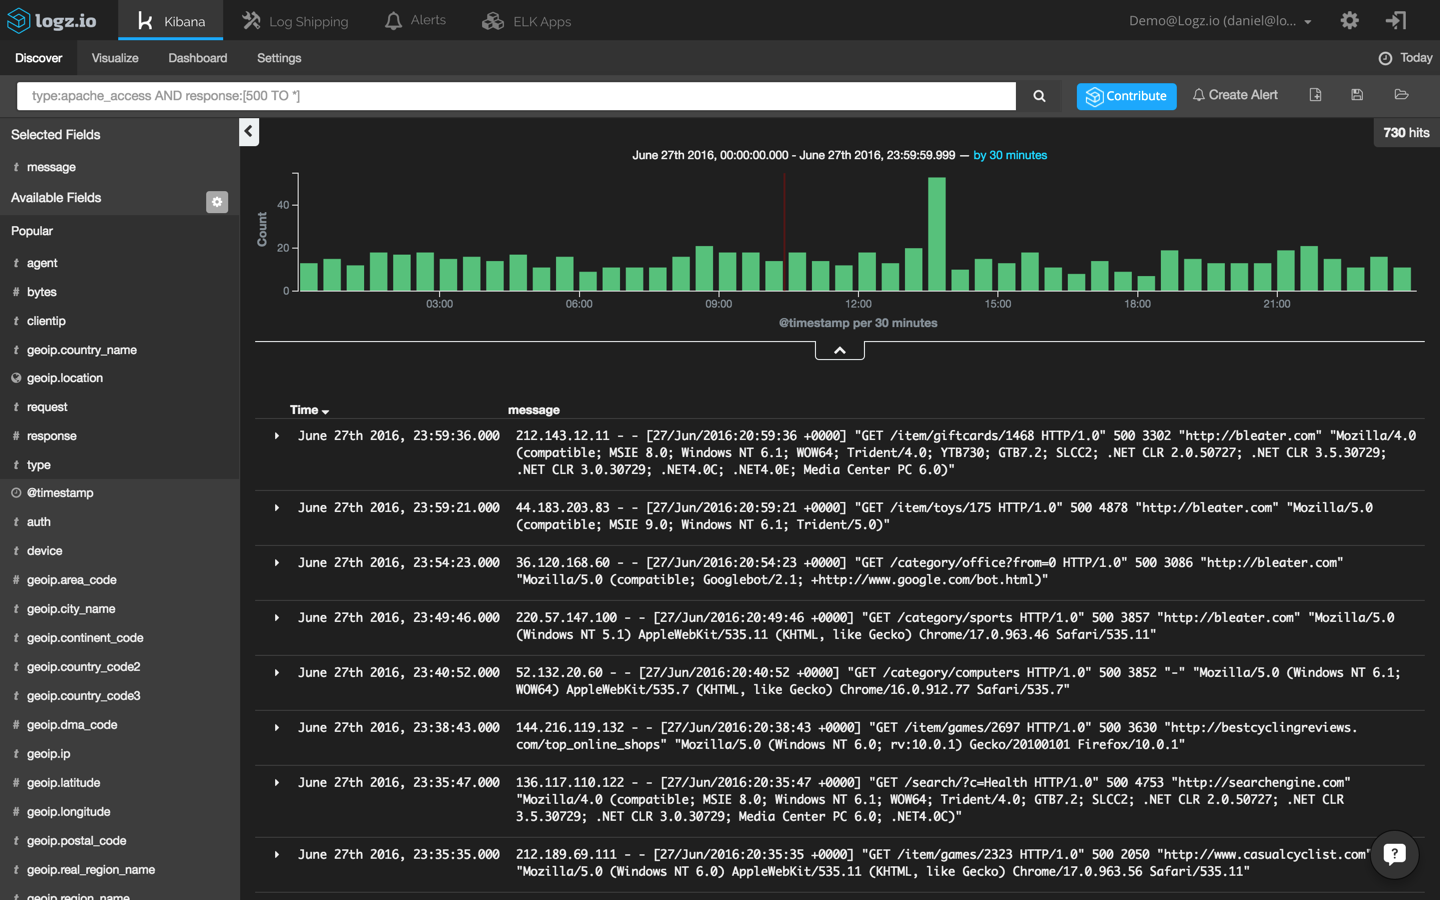
Our haystack is still a bit too large to be able to return useful information. To narrow it down further, I’m going to have to be more specific and focus on 504 responses:
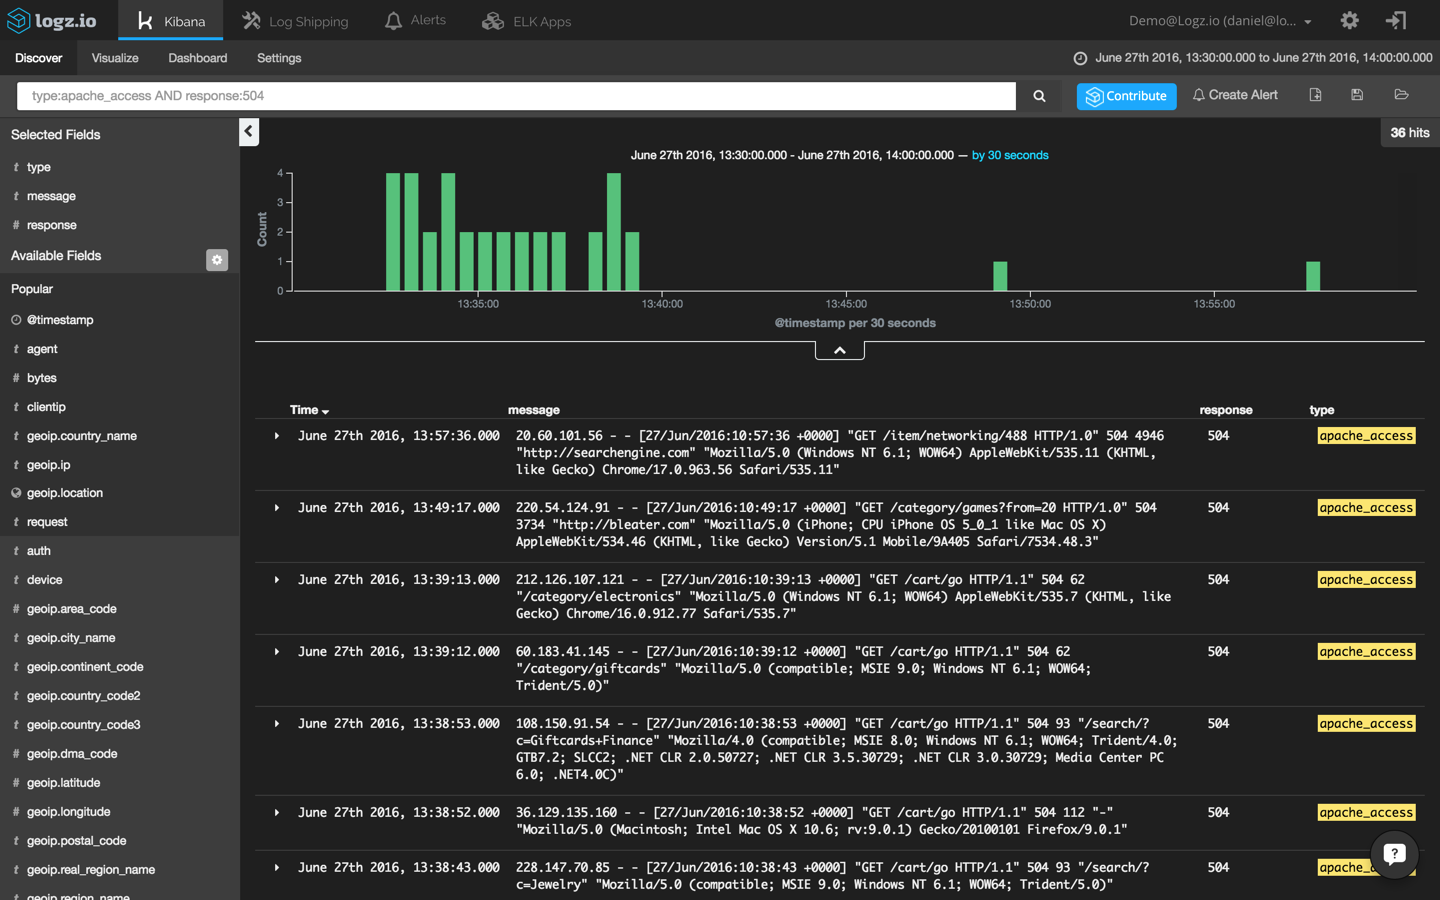
type:apache_access AND response:504
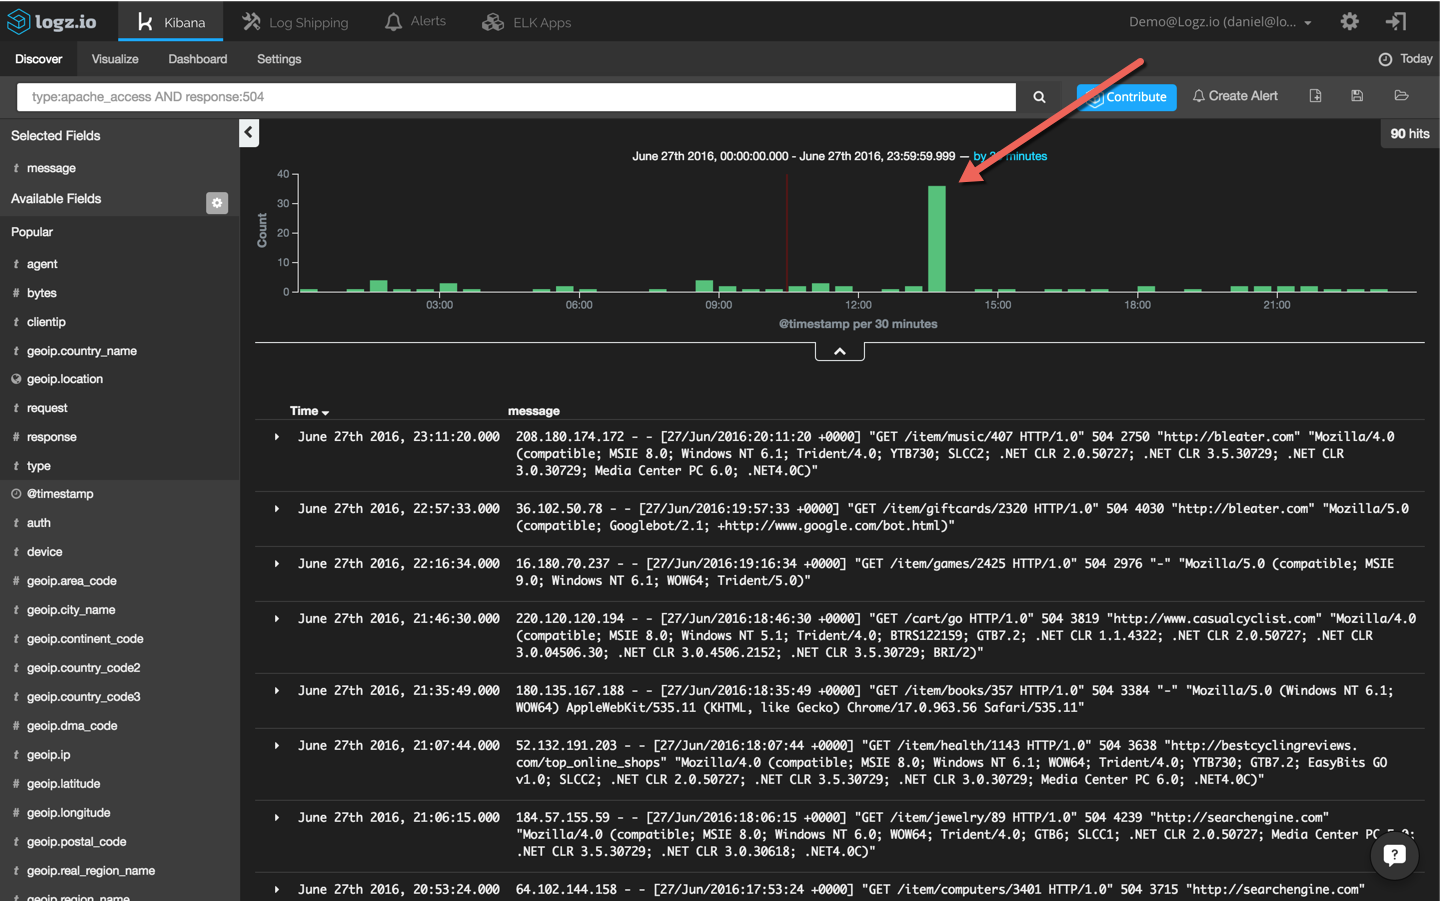
Now, we’re talking. This search results in an obvious and visible peak in events. To drill down further, I’m going to click on the bucket and add the ‘response’ and ‘type’ fields to the message list to make the list of events more readable:
If we select one of the displayed log messages, we will get a detailed view of the event — a list of the message fields and their values (select the JSON tab to see the message in JSON format):
{
   "_index": "logz-xmywsrkbovjddxljvcahcxsrbifbccrh-160627_v1",
   "_type": "apache_access",
   "_id": "AVWPKMnATxyubhgJppgh",
   "_score": null,
   "_source": {
      "request": "/cart/go",
      "agent": "\"Mozilla/5.0 (compatible; Googlebot/2.1; +https://www.google.com/bot.html)\"",
      "minor": "1",
      "auth": "-",
      "ident": "-",
      "type": "apache_access",
      "major": "2",
      "clientip": "128.93.102.172",
      "geoip": {
         "timezone": "Europe/Paris",
         "ip": "128.93.102.172",
         "latitude": 46,
         "country_code2": "FR",
         "country_name": "France",
         "country_code3": "FRA",
         "continent_code": "EU",
"location": [
            2,
            46
         ],
         "longitude": 2
      },
      "os": "Other",
      "verb": "GET",
      "message": "128.93.102.172 - - [27/Jun/2016:10:34:53 +0000] \"GET /cart/go HTTP/1.1\" 504 93 \"-\" \"Mozilla/5.0 (compatible; Googlebot/2.1; +https://www.google.com/bot.html)\"",
      "tags": [
         "_logz_upload_8021",
         "apache-geoip"
      ],
      "referrer": "\"-\"",
      "@timestamp": "2016-06-27T10:34:53.000Z",
      "response": 504,
      "bytes": 93,
      "name": "Googlebot",
      "os_name": "Other",
      "httpversion": "1.1",
      "device": "Spider"
   },
   "fields": {
      "@timestamp": [
         1467023693000
      ]
   },
   "highlight": {
      "type": [

"@kibana-highlighted-field@apache_access@/kibana-highlighted-field@"
      ]
   },
   "sort": [
      1467023693000
   ]
   }
This is great, but how do we translate this information into something actionable?
Pinpointing the cause
To get a wider perspective and try to understand whether there is a correlation between our Apache errors and the other events taking place in the environment, let’s “zoom out” while we are logged into ELK.
To do this, we’re going to use a useful feature that is specific to the Logz.io ELK stack — the +/- button that is in the top-right corner of each log message. This gives you the option of easily displaying other events that have taken place within one second, ten seconds, thirty seconds, or sixty seconds of the initially selected event. (If you’re using the open source version of Kibana, you can do the exact same thing by manually configuring the time frame.)
Clicking +/- ten seconds and removing the search filter we used to find the Apache 504 events gives us an aggregated view of all events coming within our entire system and taking place ten seconds before and after our 504 events:
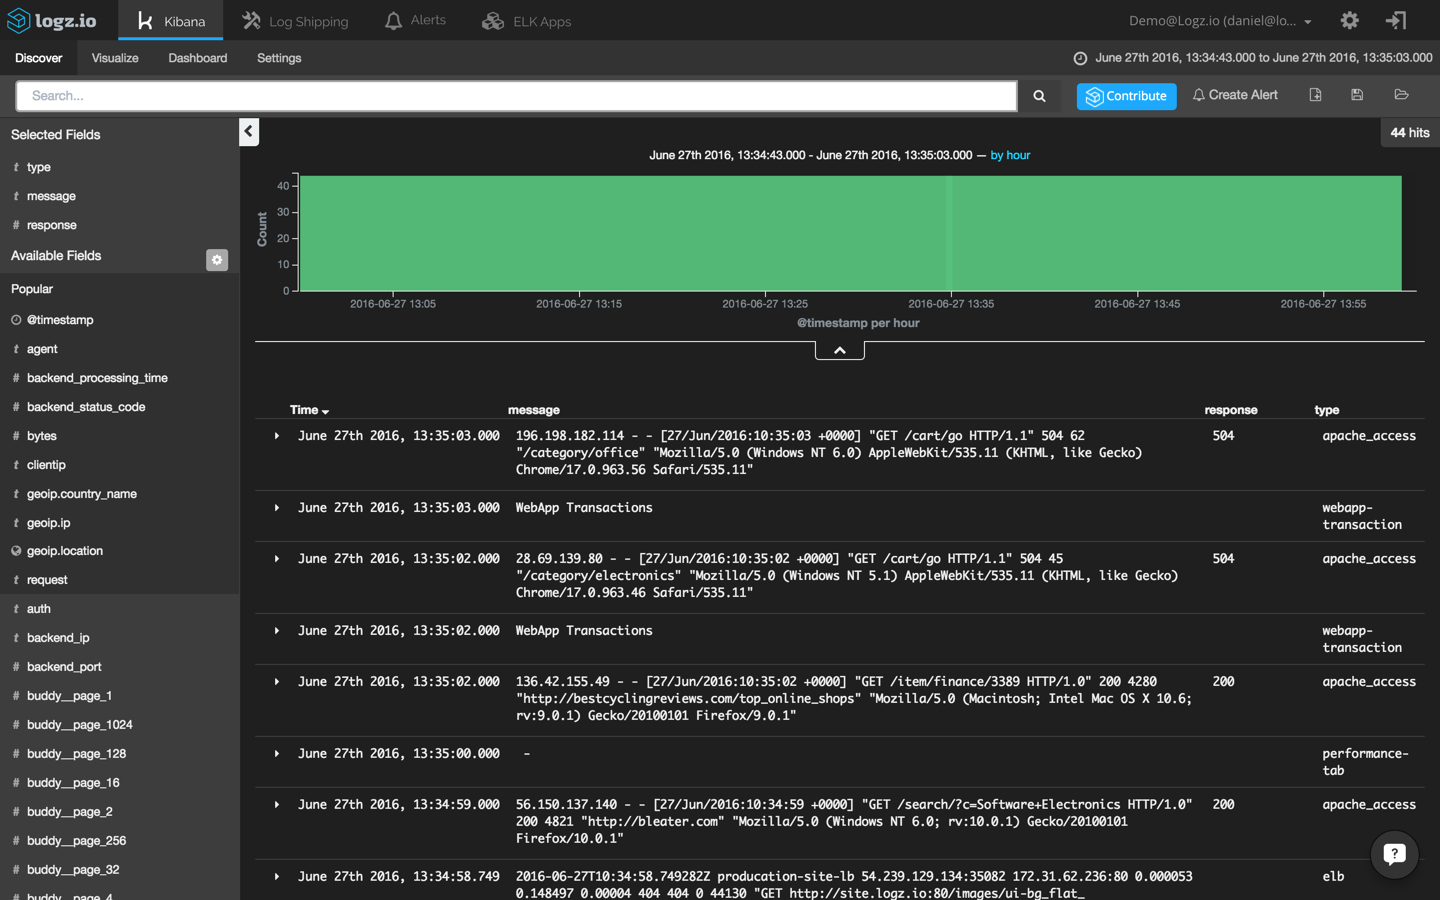
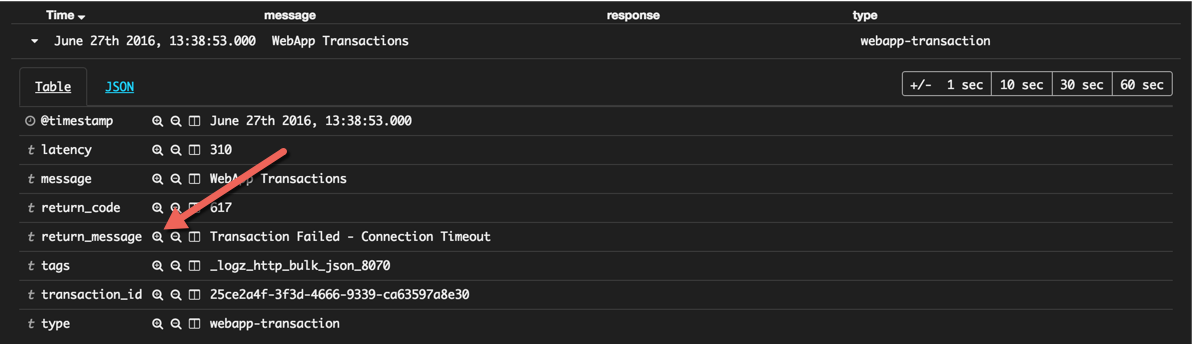
What suddenly becomes visible is that Apache 504 responses are being logged right after WebApp Transaction errors. Opening one of these errors reveals that transactions are failing because of connection timeouts with our backend:
{
   "_index": "logz-xmywsrkbovjddxljvcahcxsrbifbccrh-160627_v1",
   "_type": "webapp-transaction",
   "_id": "AVWPKMuFbofAsbciXwUI",
   "_score": null,
   "_source": {
      "transaction_id": "25ce2a4f-3f3d-4666-9339-ca63597a8e30",
      "latency": "403",
      "return_message": "Transaction Failed - Connection Timeout",
      "message": "WebApp Transactions",
      "type": "webapp-transaction",
      "tags": [
         "_logz_http_bulk_json_8070"
      ],
      "@timestamp": "2016-06-27T10:35:03.000+00:00",
      "return_code": "617"
   },
   "fields": {
      "@timestamp": [
         1467023703000
      ]
   },
   "sort": [
      1467023703000
   ]
}
Start the monitoring game
It’s time to pat ourselves on the back. We have successfully detected the anomaly, made a correlation between logs, and troubleshooted the root cause. The good news is that this is the hard part of the process. The bad news is that we are far from done.
To keep tabs on these events, it’s now time to set up some monitoring graphs. In ELK lingo, these are the Kibana visualizations and dashboards.
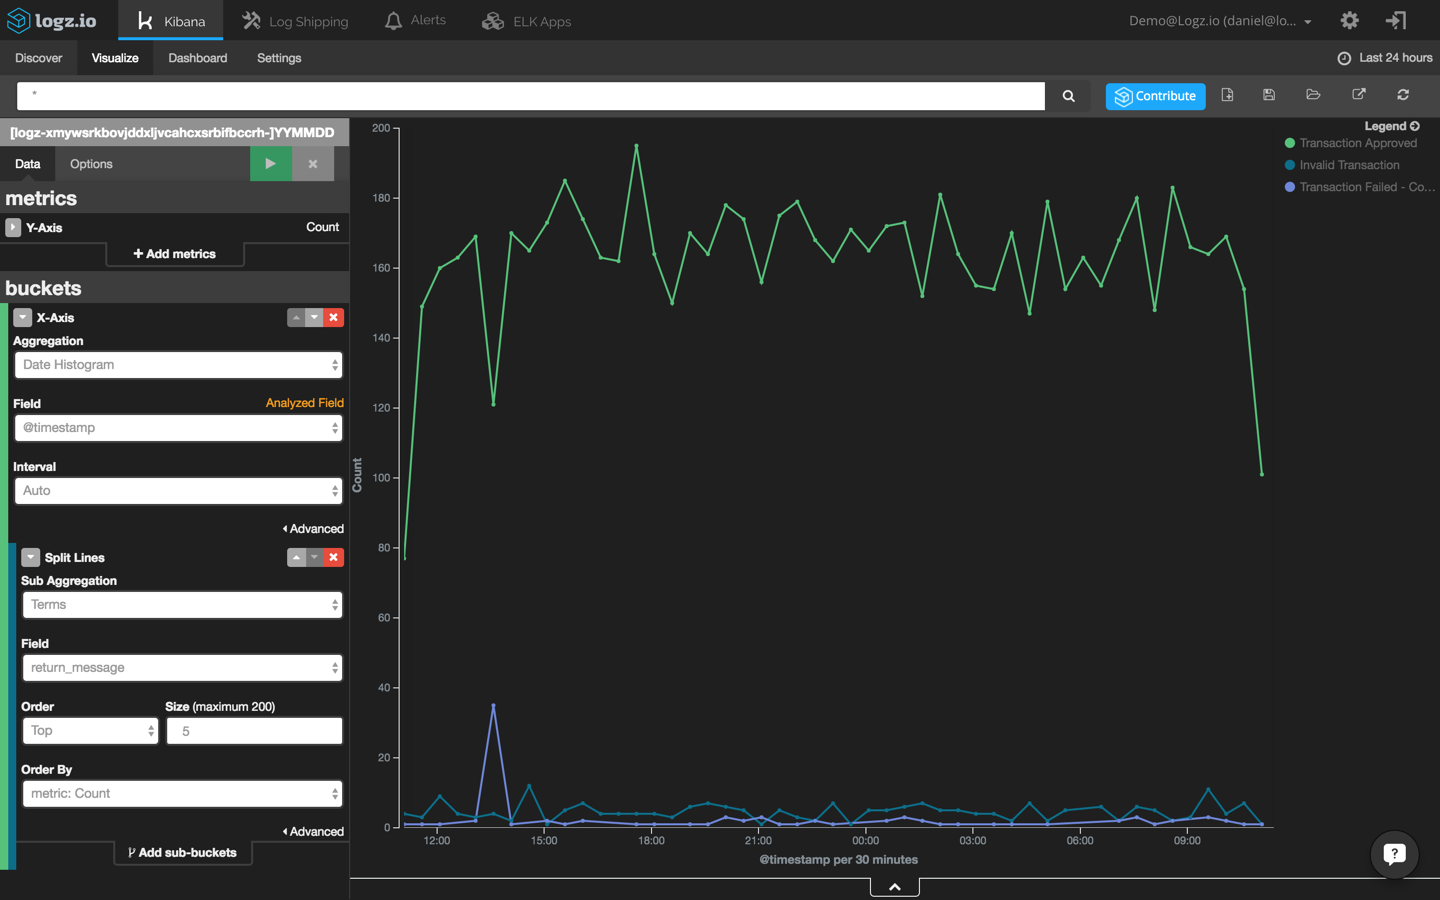
First, we are going to create a new line chart that shows webapp transactions across time. To do this, we will use the ‘return_message’ field:
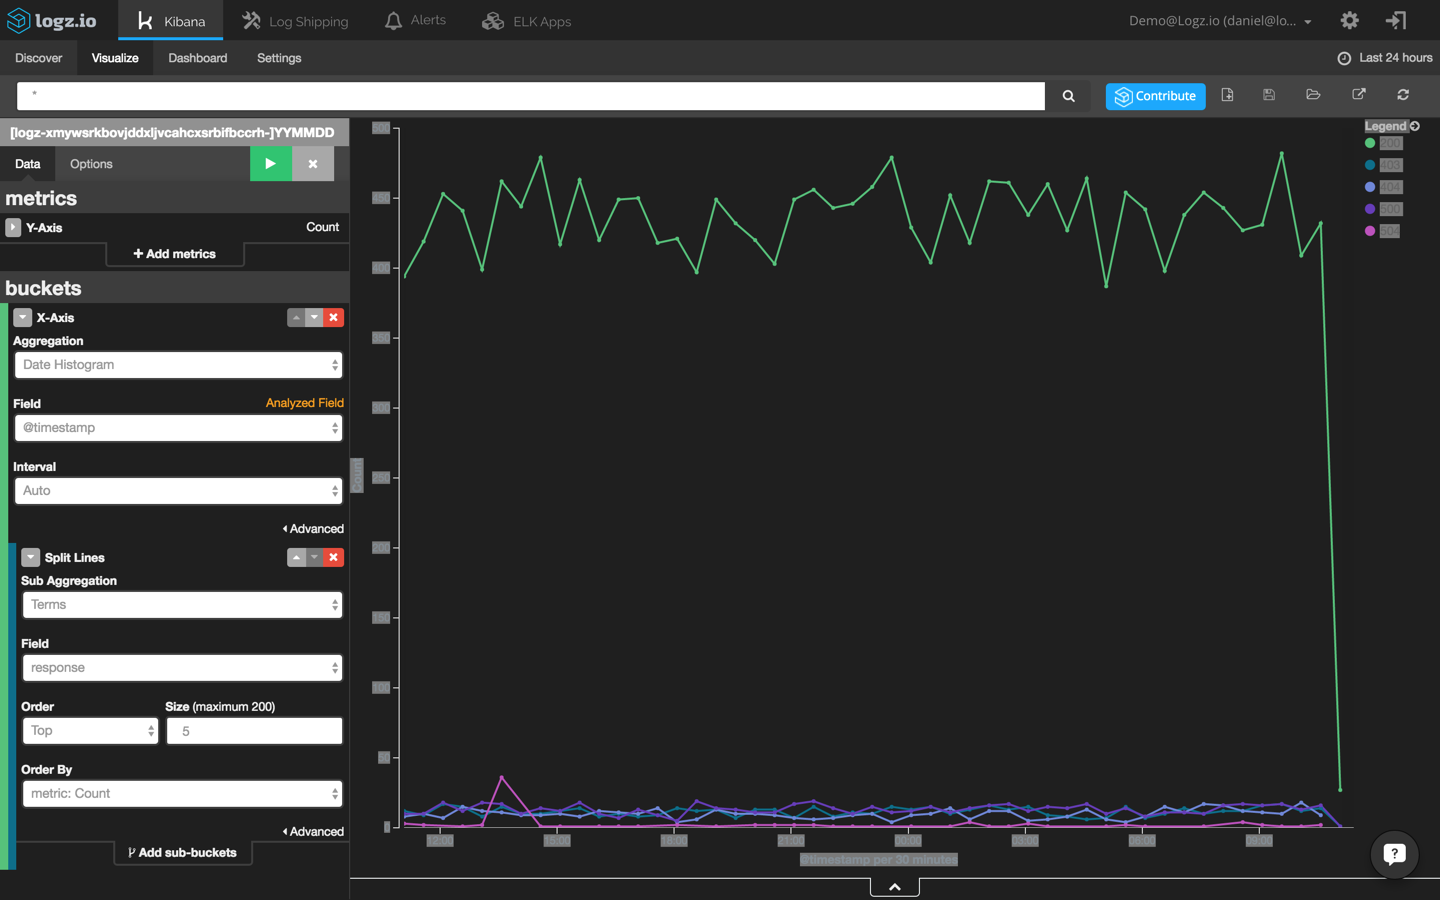
Next, we are going to create a new line chart that shows HTTP response transactions across time. To do this, will use the ‘response’ field:
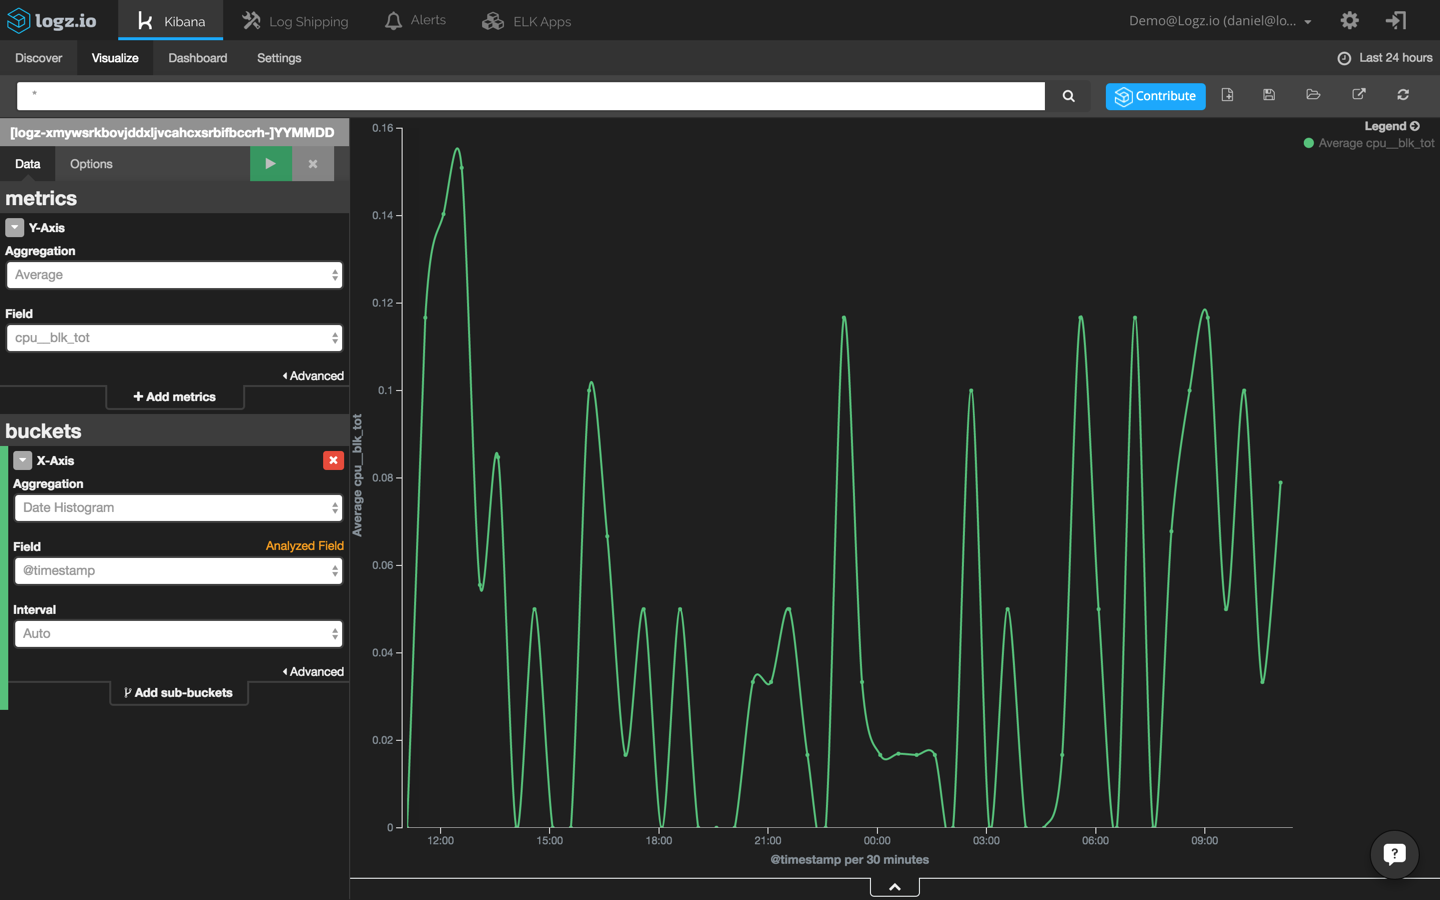
Last but not least, we are going to create another visualization that shows CPU usage across time using the ‘cpu_blk_tot’ field:
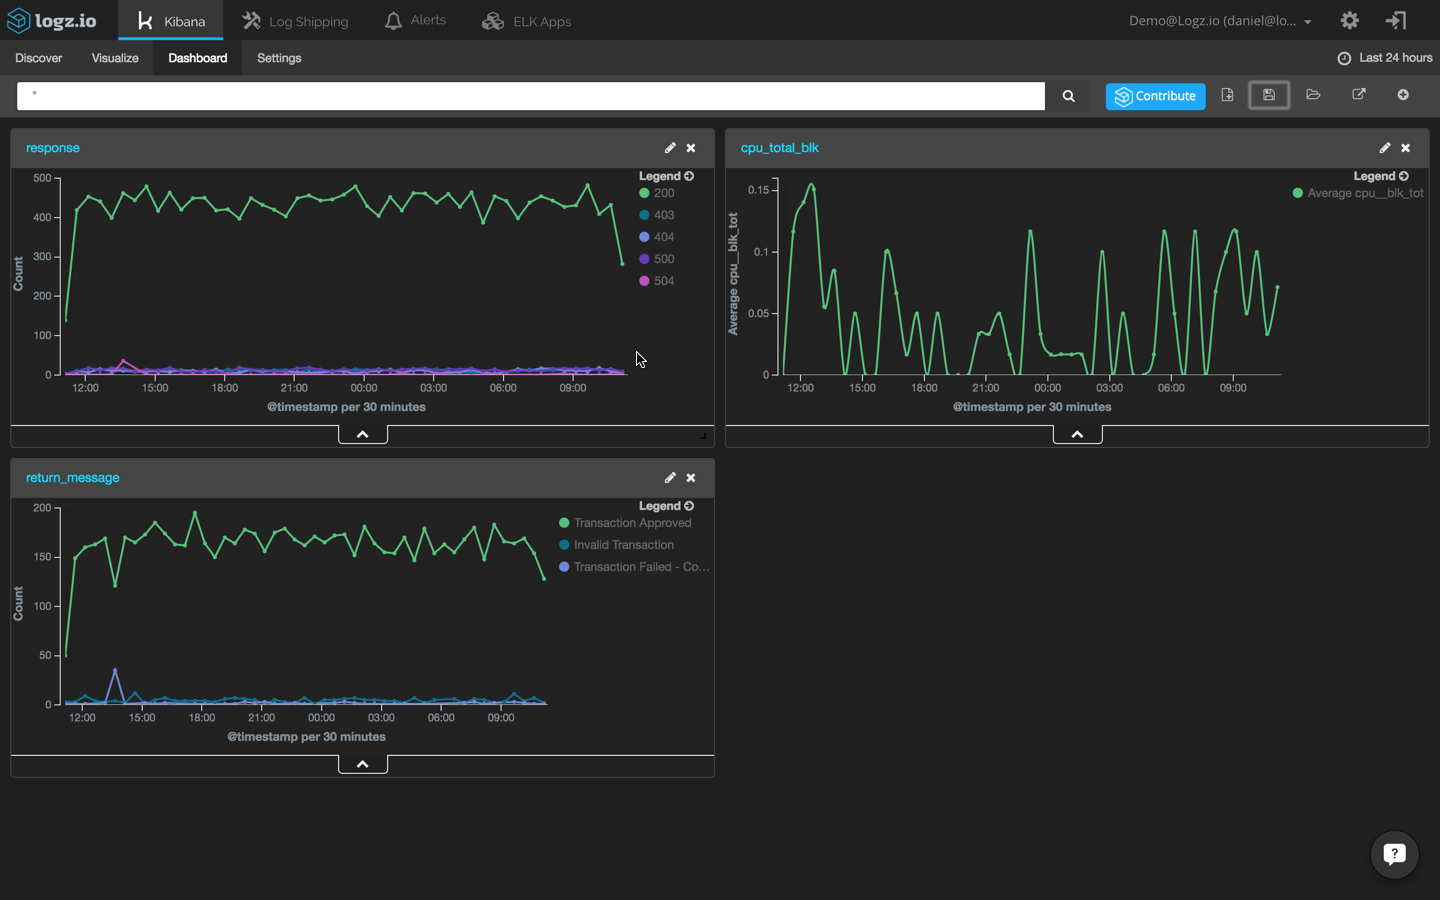
Add these three visualizations to a single dashboard to identify event correlations easily:
Of course, these are only a few examples of how to visualize log data. You can slice and dice the data any way you want, it all depends on which events you are monitoring and the set up of your environment.
Getting proactive
Now, how do we prevent such events from happening in the future?
There is usually no effective way for DevOps engineers to prevent website crashes that result from bad code that developers have written. However, there are ways for DevOps crews to be more proactive in their logging strategies so that they can find the causes of the crashes more quickly.
For example, creating alerts based on queries will alert you to events in real time. As an example, I will use the Logz.io alerting mechanism. If you’re using your own ELK Stack, you will need to configure your own alerting system.
First, let’s filter the list of events displayed in Kibana to show only transaction errors. To do this, we’re going to click this magnifying icon adjacent to the ‘return_message’ field:
Also, we’re going to change the time frame to back to ‘today’ to get a wide perspective:
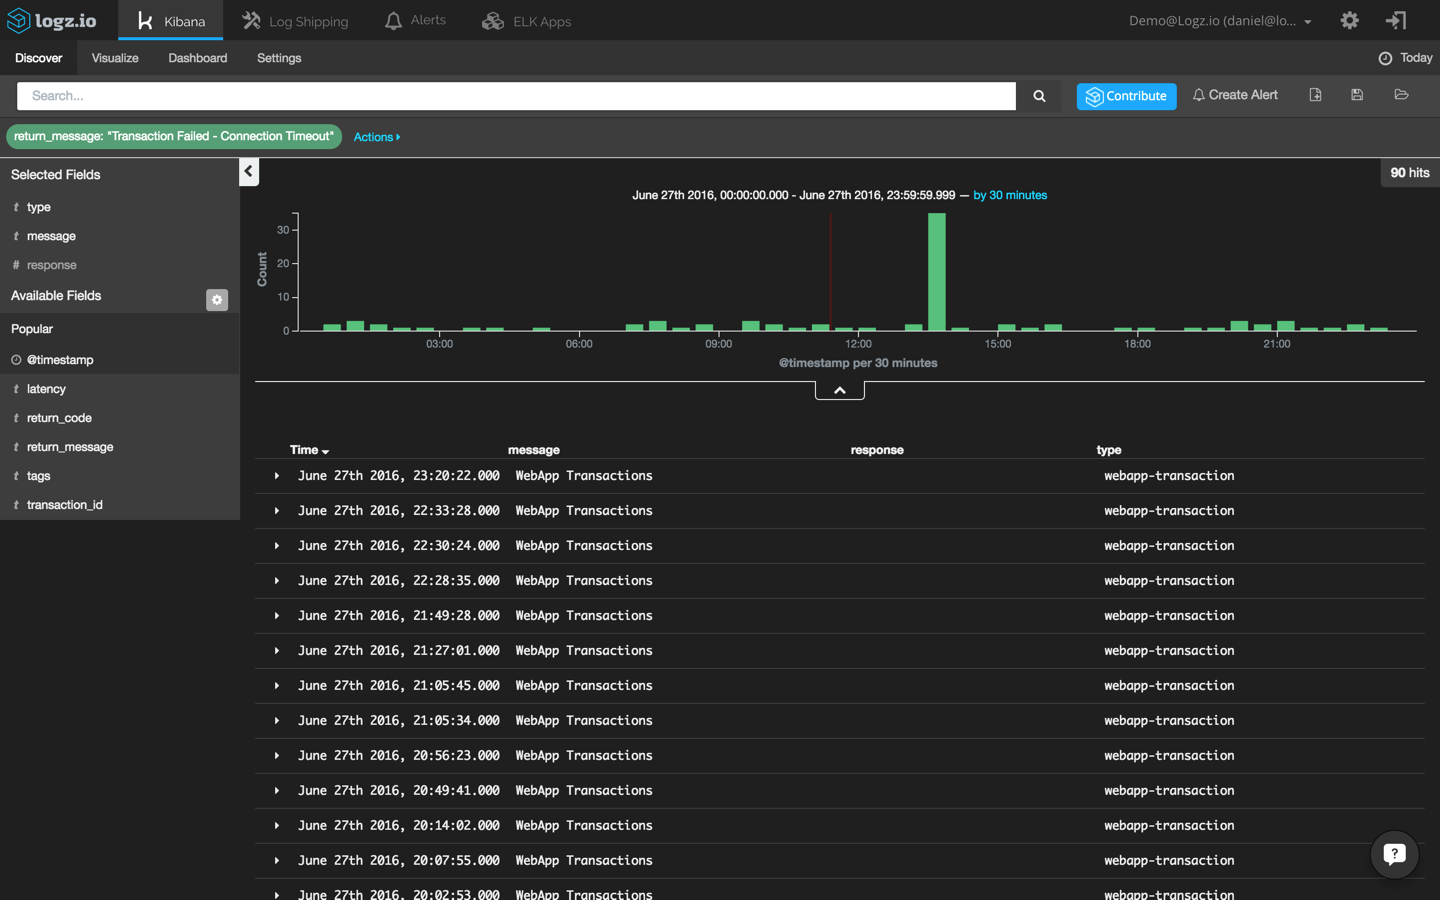
This helps us to identify what can be considered an “anomaly” in the context of transaction errors. We can see that up to three errors occur every thirty minutes. Also, we can see a peak of thirty-five events during our reported crash.
In the Kibana interface built into the Logz.io UI, I’m going to click the “Create Alert” button in the top right-hand corner:
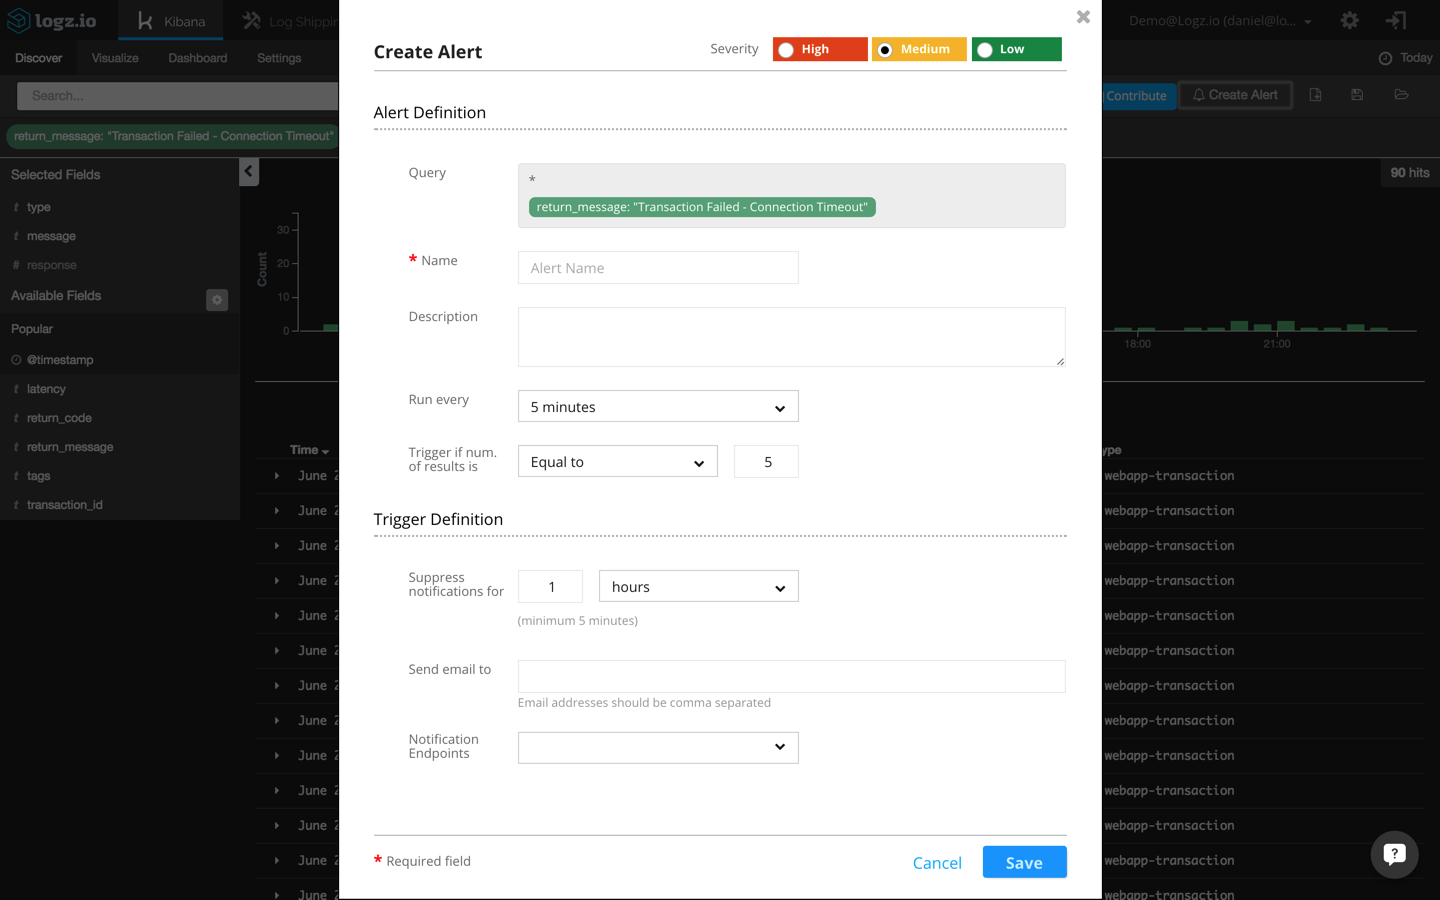
The actual query to be monitored is automatically entered in the alert definition dialog:
return_message: "Transaction Failed - Connection Timeout"
Additional fields to be entered here are a name and description for the alert, a threshold configuration, and the trigger definition (how you want to be notified when an alert is triggered).
For the threshold in this example, I’m going to configure Logz.io to send me a notification whenever more than three events occur within a five-minute timeframe.
More on the subject:
Last but not least, I’m going to configure the alert to send me the notifications over email. Other available options are to use webhooks to receive notifications via a messaging app such as HipChat or Slack.
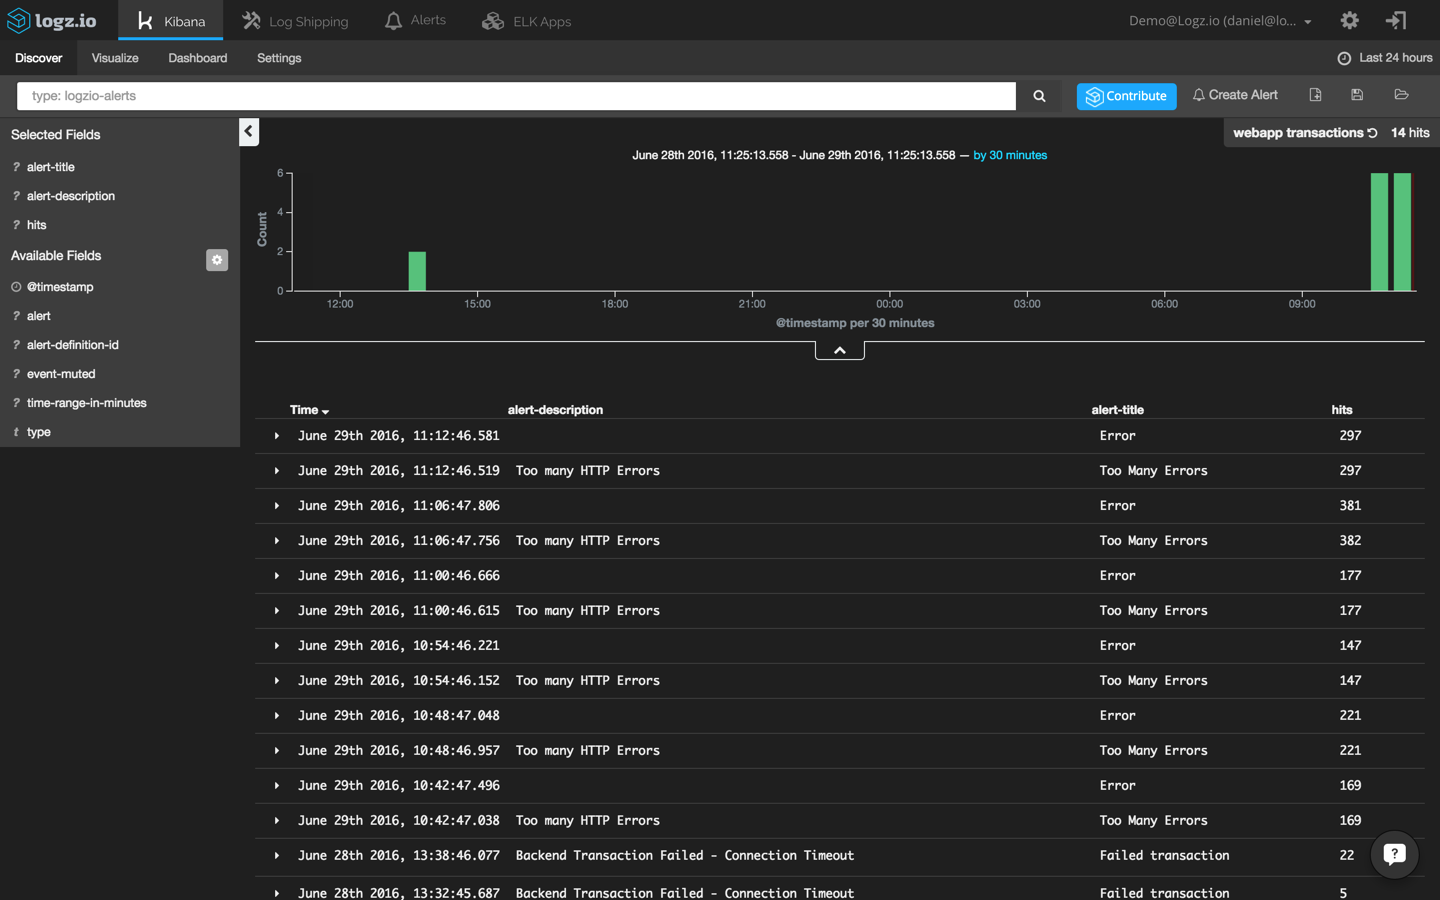
Once saved, alerts can be edited and managed from the “Alerts” tab. You can also create a visualization in Kibana that shows you the various Logz.io alerts that are being triggered.
To do this, I’m going to use the following query to search for alerts:
type: logzio-alerts
Next, I’m adding the ‘alert-description’ and ‘alert-title’ to get some visibility into the alerts being logged:
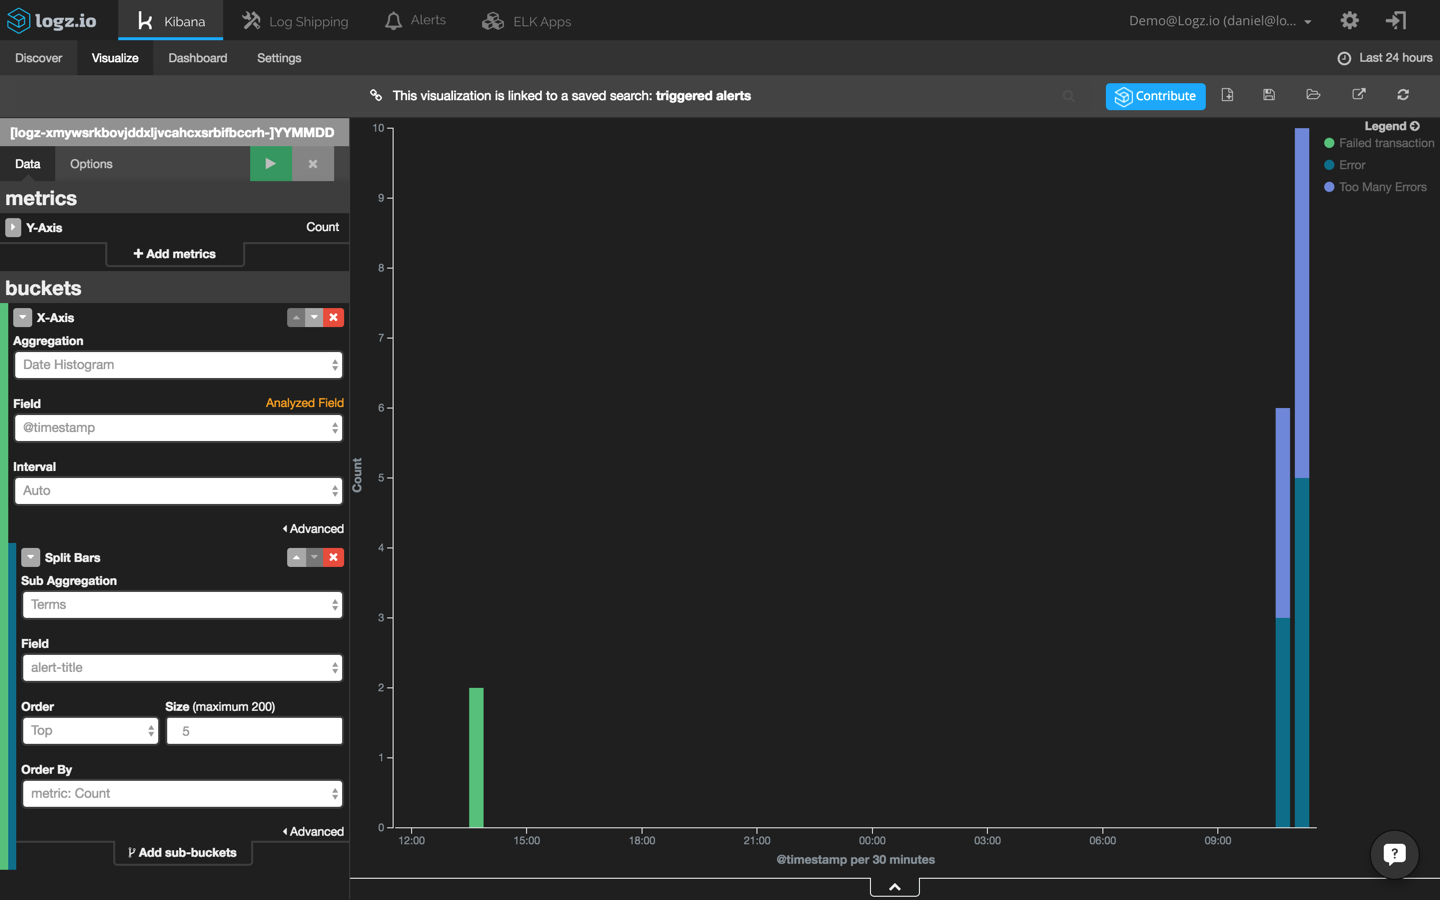
Using this search, I’m going to create a new bar chart visualization that shows me the different alerts that are being triggered in Logz.io over time:
A final note
Finding a book in a library without knowing the title and author name is impossible. In the field of log analytics, the ELK Stack makes this task easier with its powerful querying capabilities. Still — identifying anomalies within large sets of data remains a real obstacle for DevOps teams.
To solve this problem, our developers here at Logz.io are working hard on building machine-learning features on top of the ELK Stack that will use actionable insights to shorten the troubleshooting cycle.
The exciting news is coming. Stay tuned!
You Might Also Like

Requirements of a Security Platform in a DevOps World

Kubernetes and Beyond: A Year-End Reflection with Kelsey Hightower
Get started for free
Completely free for 14 days, no strings attached.