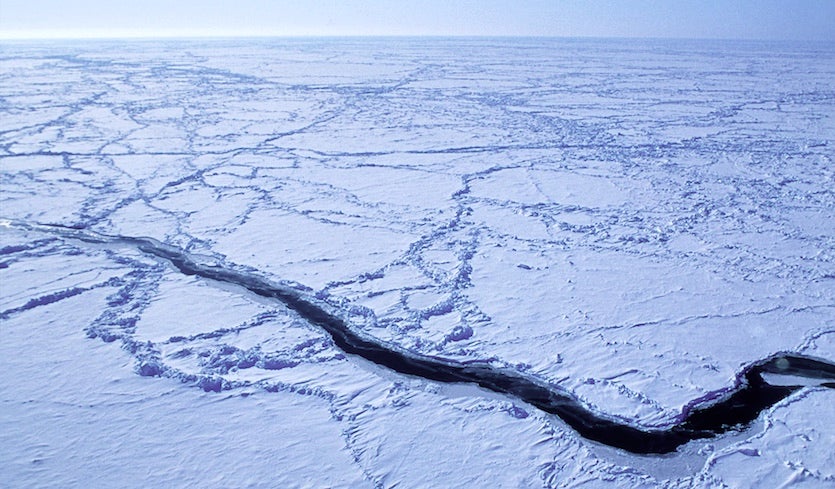
| Above: An ice lead in the Arctic Ocean is captured from the NSF/NCAR C-130 aircraft as it flies roughly 30 meters (100 feet) above the ocean during a field project studying low-level ozone formation. Image credit: James Hannigan/UCAR. |
Exactly a year after more than 100 scientists gathered to discuss the connections between Arctic sea ice loss and midlatitude climate (see our coverage), the picture has become a bit clearer. There’s now strong agreement on several of the weather and climate patterns that future Arctic sea ice loss will create, provided that the right types of climate models are put on the task—models that capture the interplay among atmosphere, oceans, and sea ice.
An overview by James Screen (University of Exeter) and colleagues, published on Monday in the journal Nature Geoscience, finds both consistency and discrepancy among models, but with a new consensus on certain points. “Evidence is mounting that Arctic sea ice loss can affect weather and climate throughout the Northern Hemisphere,” wrote the authors.
Computer models have long predicted that surface temperatures would rise more quickly in the Arctic than at lower latitudes, and observations show this happening already. There’s also been a significant drop in the extent of Arctic sea ice throughout the year, most notably in summer but also during the cold season. In the first few days of February 2018, Arctic sea ice extent has been running about 8-10% below the seasonal average for the period 1981-2010, and it’s been breaking record lows that were set just last year (in 2017).
No surprises here: average January (2018) #Arctic sea ice extent was the lowest in the satellite record...
— Zack Labe (@ZLabe) February 2, 2018
Data from @NSIDC at https://t.co/aUqFYmnK0c pic.twitter.com/FZEqtxR34S
A burst of widely publicized research over the past decade found that the depleted Arctic sea ice could be part of a chain of events weakening the stratospheric polar vortex and hiking the risk of cold outbreaks in northern midlatitudes. These findings have been far from unanimous, though.
 |
| Figure 1. Arctic sea ice extent as reflected in near-real-time data for February 4, 2018. In records going back to 1978, the ice extent was at the lowest level ever observed on February 4. Depletion was especially noticeable in the Bering Sea and Sea of Okhotsk (left) and in the Barents and Greenland Seas (right). Image credit: National Snow and Ice Data Center. |
“The recent pace of [Arctic] sea ice loss has been nothing short of breathtaking, as about 80% of the volume has disappeared in a human generation,” said Jennifer Francis (Rutgers University) in an overview for the December issue of the Bulletin of the American Meteorological Society (BAMS).
Francis added: “Despite intense efforts to understand Arctic–midlatitude [linkage], the controversy surrounding its significance and even its existence rages on.”
More than one pathway
The impact of depleted Arctic sea ice on climate isn’t so much from the absent ice itself as from the ocean that’s newly exposed. Heat propagates upward from the sea surface, and low-level winds flowing atop the exposed ocean thus end up warmer. Along with this direct influence, some more complex processes appear to be at work.
The key to mapping out these indirect effects seems to be using more sophisticated (albeit more costly) computer models that allow the oceans and sea ice to interact with the atmosphere. For example, some studies have used “slab” ocean models that can’t depict deep ocean circulation.
When a full-depth ocean model is used, something intriguing happens: the loss of Arctic sea ice triggers a far-flung response that mimics climate change itself, including a slowdown of the Atlantic Meridional Overturning Circulation (AMOC), a build-up of heat in the tropical oceans over several decades, and a warming of the atmosphere a few miles above the tropics. Clara Deser (National Center for Atmospheric Research) dubbed this a “mini-global-warming.”
Several different experiments with full-depth ocean models now show the mini-global-warming pattern, according to Screen and colleagues. A set of six different model experiments also found a strikingly common pattern at the surface: a stronger Aleutian low, a weaker Icelandic low, and lower surface pressures across North America and/or the North Atlantic. These experiments differ in how much ice depletion they portray, but the strength of the surface response appears to correlate well with the amount of ice loss, according to Screen and colleagues.
There’s also new agreement at the jet stream level. When averaged around the Northern Hemisphere, the six experiments all show a strengthening flow toward the south side of the climatological jet max and weakening flow toward the north, both of which match the mini-global-warming scenario above.
“This consistency contrasts with results from previous studies using atmosphere-only models, which exhibited a high level of divergence and lack of robustness,” they wrote. However, they add: “Simulations with a greater diversity of coupled models are needed to confirm the robustness of the circulation response to projected Arctic sea ice loss.”
 to Equator (right)") |
| Figure 2. Schematic representation of the potential climate response to Arctic sea ice loss along a cross-section from the North Pole (left) to Equator (right). Major atmospheric and oceanic circulation features weakened by Arctic sea ice loss are shown by blue arrows and labelled with minus signs; those that are strengthened by Arctic sea ice loss are shown by red arrows and labeled with plus signs. Red and orange shading indicates regions of greatest warming in response to sea ice loss. Circled numbers indicate sources of disagreement in model experiments (see text below). The scale is exaggerated in this figure in order to show the relevant processes. Image credit: From Screen et al., “Consistency and discrepancy in the atmospheric response to Arctic sea ice loss across climate models,” Nature Geoscience, published online on Feb. 5, 2018. |
Where the models still disagree
As shown in Figure 2, there remain pockets of big disagreement even among the most intricate model experiments. Some of the inconsistency is tied to differences in study design. The main areas where consensus remains elusive are as follows (numbered as in Figure 2):
1. Magnitude and spatial pattern of sea ice loss. Experiments differ in where they place the areas of depleted sea ice, and whether they track the seasonal evolution every day or every month, which can influence the atmospheric impacts.
2. Ice thickness. Some of the atmosphere-only studies use a fixed sea-ice thickness. Thinner ice can itself lead to warming even if the ice extent remains unchanged. Models with interactive oceans/atmosphere/sea ice don’t have this problem.
3. Treatment of new open water. Non-interactive models need to specify the temperature of the newly exposed seawater. Typically this is pegged at –1.8°C (28.8°F), the freezing point of seawater, but observations indicate that the sea surface temperature can be as warm as 5°C (41°F) in summer.
4. Stratospheric representation. Models with a fuller depiction of the stratosphere appear more likely to show a shift toward a negative Arctic Oscillation, typically associated with a weaker polar vortex.
5. Ocean. Differences in the physics of ocean behavior in a model can lead to differing effects from sea ice loss.
6. Background state. The “starting point” of a model experiment—the global conditions assigned at the start of a model run—can affect how the atmosphere responds to sea ice loss.
7. Model physics. The specifics of model design, such as how it handles cloud physics, can also affect the response to sea ice loss.
 vs. September 2016 (right).") |
| Figure 3. Depiction of Arctic sea ice that’s at least four years old as of September 1984 (left) vs. September 2016 (right). A NASA animation shows the week-by-week evolution of Arctic sea ice across this period. Image credit: NASA. |
Where to next?
Screen and colleagues conclude: “A growing list of societally impactful phenomena across the Northern Hemisphere are being linked to diminished Arctic sea ice, arguably quite speculatively: from extreme pollution haze in China, to poor crop yields in the United States, to the unusual track of Hurricane Sandy, the second-costliest hurricane in U.S. history. The need has never been greater for carefully designed model simulations and novel observational analyses to infer which connections are causal and which are purely coincidental.”
Along these lines, modelers have embarked on a new Polar Amplification Model Intercomparison Project. Proposed experiments will look at how the response hinges on where sea ice is lost and how the impacts may evolve across time frames from years to decades.
Judah Cohen (Atmospheric and Environmental Research) is one of the best-known proponents of the links between Arctic sea ice and midlatitude weather, and one of the organizers of the 2017 workshop. In an email, he pointed out that research isn’t yet unanimous on the idea that Arctic sea ice loss is making midlatitude winters colder. For example, Climate Central recently found that the coldest two weeks of each winter across the northeast U.S. and southeast Canada have been warming even more quickly than the global average temperature rise.
“More and more research has been published making the link between Arctic change and mid-latitude weather, so I do think we have made progress on the subject,” Cohen told me. He added:
“Winters continue to be colder across the Northern Hemisphere continents than projected and the amplified western ridge and eastern trough have dominated North America winters over the past five winters. I don’t think that this is due to chance but is in part forced by Arctic change. That link goes through the stratospheric polar vortex.”
Speaking of which, Cohen is coauthor of a study published online in BAMS on February 1 that finds a tendency toward a weaker stratospheric polar vortex—in turn explaining the bulk of midlatitude winter cooling observed across Eurasia since 1990.


