
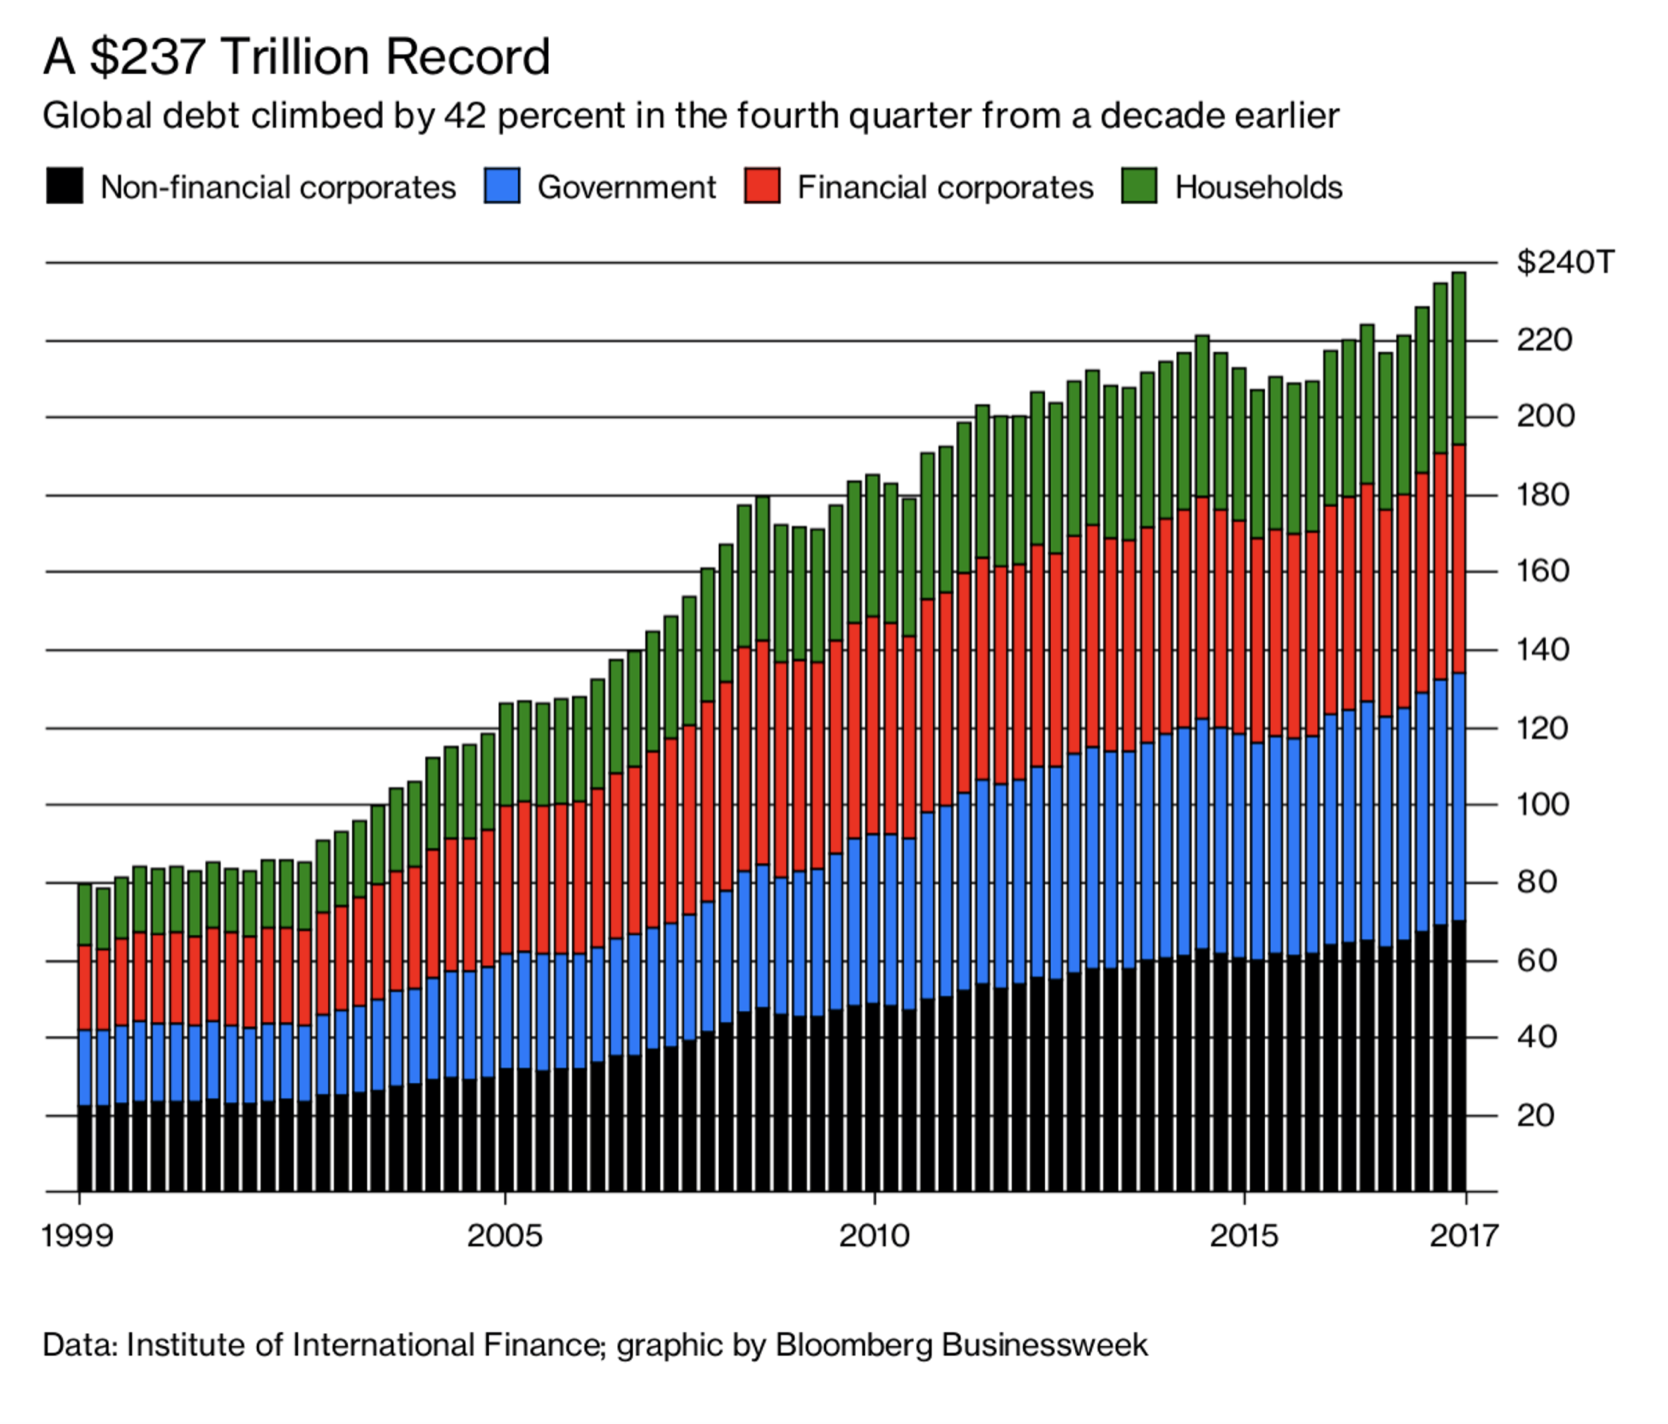
How alarmed should we be about rising levels of debt?
According to the Institute of International Finance (IIF), global debt hit US$237 trillion in the December 2017 Quarter, over 310 per cent of GDP of US$76 trillion. Global debt levels are at record highs in dollar terms and in relation to GDP.
Even if we avoid potential double counting from the Financial Sector, gross global Public and Private Sector debt would still be US$178 trillion or 236 per cent of global GDP.
In the past decade, there has been a significant increase in Developed Economy Government debt, to 109 per cent of GDP, and this reflects GFC related stimulus programs and continuing budget deficits.
The following table, from the IIF, splits these figures by Sector and between Emerging and Developed Economies.
| US$ trillion | Emerging | % of GDP | Developed | % of GDP | Global | % of GDP |
| Households | 10.7 | 35 | 34.0 | 75 | 44.7 | 59 |
| Non-Financial Corporates | 28.7 | 95 | 41.1 | 24 | 69.8 | 92 |
| Government | 14.3 | 47 | 49.8 | 109 | 64.0 | 85 |
| Financial | 9.8 | 32 | 49.0 | 108 | 58.8 | 78 |
| TOTAL | 63.4 | 210 | 173.8 | 382 | 237.2 | 313 |
| GDP | 30.2 | 45.5 | 75.7 | |||
| Public and Private Sector (no Financials) | 53.6 | 177 | 124.8 | 274 | 178.4 | 236 |
Many commentators argue that we shouldn’t be too alarmed with rising levels of indebtedness and their reasoning for this includes:
- Assuming asset value rises at the same rate as debt, the debt to asset ratio remains constant;
- While Chinese Private Sector Debt has surged in recent years (170 per cent of GDP), there will always be government support if there is a crisis;
- The rise in Emerging Market Private Debt (130 per cent of GDP) is supported by its younger demographics and higher growth potential;
- Near record low interest rates means that for the Household Sector, interest payments as a percentage of disposable income have declined dramatically over the past decade. In Australia, for example, this ratio has declined from 13 per cent to 8.5 per cent;
- With Japan’s 250 per cent Public Sector Debt to GDP ratio, around 40 per cent of Japan’s Government Bonds are owned by the Bank of Japan, so any increase in Japanese interest rates will simply see the interest expense repaid to the Government; and
- Central Banks will adopt a very gradual approach in any tightening cycle.
On the other side of the coin, it is worthwhile thinking about the record global debt levels and asking yourself questions like:
- What if US ten-year real rates of interest, which generally determines the allocation of capital between lenders and borrowers, returns to their multi-decade average of 3.5 per cent (versus the current 0.7 per cent)?
- What if the US economy continues to exhibit solid growth and the US Federal Reserve increases the Fed Funds rate from 1.75 per cent to over 3.0 per cent?
- What if those Emerging Markets with excessive US$ debt experience a dramatic decline in their currency (relative to the US dollar)?
- And one for Australia – with its number one positioning in the Household debt to GDP ratio exceeding 120 per cent, or more than double the global average – what if the price of assets (residential property) decline, bank’s provisioning for bad and doubtful debts increase and unemployment rises from this negative feedback loop?
While my grasp of timing is no better than the next person, I do know that excessive debt levels magnify trouble when things don’t work out as planned.
According to the Institute of International Finance (IIF), global debt hit US$237 trillion in the December 2017 Quarter, over 310 per cent of GDP. How alarmed should we be about the amount of debt? Click To TweetChief Executive Officer of Montgomery Investment Management, David Buckland has over 30 years of industry experience. David is a deeply knowledgeable and highly experienced financial services executive. Prior to joining Montgomery in 2012, David was CEO and Executive Director of Hunter Hall for 11 years, as well as a Director at JP Morgan in Sydney and London for eight years.
This post was contributed by a representative of Montgomery Investment Management Pty Limited (AFSL No. 354564). The principal purpose of this post is to provide factual information and not provide financial product advice. Additionally, the information provided is not intended to provide any recommendation or opinion about any financial product. Any commentary and statements of opinion however may contain general advice only that is prepared without taking into account your personal objectives, financial circumstances or needs. Because of this, before acting on any of the information provided, you should always consider its appropriateness in light of your personal objectives, financial circumstances and needs and should consider seeking independent advice from a financial advisor if necessary before making any decisions. This post specifically excludes personal advice.
Max Zan
:
Thanks Stuart – Your explanations have been very helpful and have given me a good understanding of the Capital Adequacy of Banks. I now have a much better insight of what it means when you hear that Banks are adequately capitalised. (Page 51 of WBC 2017 Annual Report is worth a look for anyone that’s interested – It clearly explains how CET1 ratio and other ratios are calculated.)
I still think they are highly geared beasts – It will be interesting to see how well they manage rising interest rate risks and Loan defaults and the Royal Commission is another negative they will have to contend with. All that makes it difficult to see them growing in the short term and hard to predict when the share price will bottom out. The high yield appears attractive but can also be a trap if growth stalls or goes backwards – you only need to look at Telstra to see what can go wrong.
andrew ronan
:
Debt is only a problem because it is priced incorrectly, because the cost of debt today does not take into account the risks to the entire global financial system that very cheap debt poses, very cheap debt is the mother of very poor and risky allocation of capital which always leads to systemic catastrophe which then requires ever more cheaper debt to bail out the system. Once you move away from discipline in any system, chaos will simply move in to take disciplines place, with predictable outcomes. We have been moving away from monetary discipline for three decades now. And have arrived at our third asset bubble, only now we have more problems to deal with including ageing demographic, and parabolic unsustainable debt growth combined with flat wage growth. And an economic system that relies on ever growing asset prices due to the financialisation of the economy and the dumping of the productive economy.
For me These observations lead to the question, why? Why does the penny not drop? It seems the governments and central bankers know what we know too, but have no answers, and will therefore Print borrow and spend and lend ever more until the resulting chaos defeats them, and sadly us.
Forget the banks, its Economics 101 that needs the royal commission investigation.
Max Zan
:
Stuart – I went looking and the link below explains how the 10.56% CET1 was arrived at – It’s Equity minus deductions divided into Risk Weighted Assets (RWA)
I learn something new every day.
https://www.westpac.com.au/content/dam/public/wbc/documents/pdf/aw/ic/Westpac_Pillar_3_Report_(September_2017).pdf
Max Zan
:
Hi Stuart
Thanks for your reply – I think I get what you are saying.
I turned up data on WBC for 2017 to better understand (see link below) and can see where Loans $684.9 B and Equity $61.3 B results in 8.95% – I assume the $42.7 B is the Equity $61.3 B minus $18.6 B ( $18.6 B assumed to be Goodwill etc backed out) which is then divided into $684.9 B of Loans to get 6.23%
On the link below it shows APRA Basel III Common Equity Tier 1 (CET1) to be 10.56% for 2017 – Does 6.2% represent your calculation for CET1 ?
https://www.westpac.com.au/about-westpac/investor-centre/financial-information/5-year-summary/
Stuart Jackson
:
Hi Max, I think you have already found your answer. APRA makes a number of adjustments to the book equity figure. These adjustments are set out in the Pillar III statements released by the banks every quarter, as well as the notes to the accounts in the half yearly results. The Basel III Common Tier 1 Equity ratio you are referring to uses the CET1 equity figures I provided in the table, but the denominator is the risk weighted assets rather than the net loans and advances figures in the table. Risk weighted assets is an attempt to adjust the bank’s total loan exposure for the varying levels of risk of default across the range of individual loans in the bank’s portfolio. For example, the risk of a corporate or SME loan going bad has historically been much higher than a mortgage. Therefore the risk weighting for an SME loan might by 100% of the principle while the risk weighting for a mortgage might by 25%. This is an attempt to adjust all the loans to have a similar risk of default per $ of risk weighted assets. The risk weighted assets figure also includes a value for the operational risk, interest rate risk in the banking book and the exposure to market risk of the bank. I hope that helps
Andre
:
David,
The short answer is that we simply don’t know how much debt is too much. 10 years ago I thought the GFC would wind in the debt position but it just made it worse. The global economy just keeps racking up all forms of debt and it barely rates a mention. To me it’s a bit like that old saying about knowing how deep a submarine will really go.
andrew ronan
:
I love your submarine analogy, I think it discribes the worlds understanding of our entire monetary system to a T and that includes governments and central banks throughout the world .And your spot on when you say it doesn’t rate a mention, and that’s because if we get into a conversation about it, and how we got to this point, it very quickly becomes obvious that know one has a clue. So just keep the sub descending and ignore any creaks and growns.
Max Zan
:
Hi David
You constantly hear that our Banks are adequately capitalised ,which I take to mean the current level of Equity on the Balance Sheet is sufficient to cope with any situation, but there has to be a limit as Banks are highly geared beasts and when things go bad they go bad in a very big way.
It would be interesting to know how much of the current Loan Book (Assets) of each of our big four Banks would have to go bad to wipe out the total shareholder equity.
Is there anywhere that info can be found ?
Stuart Jackson
:
Hi Max, What you would want to compare is the book equity to the net loans and acceptances (NLA). However, book value includes some values that may not be recoverable is equity needs to be realised to offset bad debts (eg goodwill and capitalised expenses). This is why APRA uses its own definitions of equity when looking at the level of capitalisation of a bank. The most referred to measure is common tier 1 equity (or CET1). The table below provides this data for each of the listed retail banks. I apologise ahead of time for the formatting, but unfortunately I’m unable for paste a formatted table or picture in this site.
GLA Provisions NLA Book Equity Book Equity/NLA Common Tier 1 Capital CET1 Capital/NLA
ANZ 584.1 (3.8) 580.3 59.1 10.2% 41.3 7.1%
CBA 741.1 (3.7) 737.4 66.1 9.0% 45.9 6.2%
NAB 565.1 (3.2) 561.9 51.3 9.1% 38.4 6.8%
WBC 687.8 (2.9) 684.9 61.3 9.0% 42.7 6.2%
BEN 60.6 (0.3) 60.3 5.6 9.2% 3.2 5.4%
BOQ 44.2 (0.2) 44.0 3.8 8.6% 2.7 6.1%
The other thing that needs to be taken into account when comparing these ratios across the banks is the mix of loans in their loan books. The risk of default is higher in some categories than in others. Additionally, when a loan goes into default, not all of the loan’s value will be lost to the bank. The proportion of the loss relative to the value of the principle will depend on a number of factors such as the ability to take possession of and sell the underlying collateral.