
 Last year we published a detailed series of reviews on VSAN 6.0 in a hybrid configuration. In February of this year, VMware launched VSAN 6.2, which brought data reduction via deduplication and compression, as well as a number of other features to the market. Data reduction is a major step forward for VSAN as it piggybacks on the massive surge in flash adoption, thanks in large part to falling prices and high-quality options. When VSAN is enabled in an all-flash configuration, users taking advantage of data reduction can effectively triple (or more) their capacity depending on workloads, which really brings the value of flash to everyone from ROBO to the enterprise.
Last year we published a detailed series of reviews on VSAN 6.0 in a hybrid configuration. In February of this year, VMware launched VSAN 6.2, which brought data reduction via deduplication and compression, as well as a number of other features to the market. Data reduction is a major step forward for VSAN as it piggybacks on the massive surge in flash adoption, thanks in large part to falling prices and high-quality options. When VSAN is enabled in an all-flash configuration, users taking advantage of data reduction can effectively triple (or more) their capacity depending on workloads, which really brings the value of flash to everyone from ROBO to the enterprise.
As we continue on our review of VSAN, we've leveraged the same Dell PowerEdge R730xd cluster we used in the previous Hybrid review. We have made updates to the platform, including BIOS, firmware and ESXi to make it compatible with VSAN 6.2. One of the biggest changes, though, is replacing our existing HDDs and SSDs with a new all-flash configuration, courtesy of Toshiba. By leveraging some of the fastest SAS3 SSDs on the market, we are able to put all of our attention on the VSAN itself, without hardware holding it back.
Dell PowerEdge R730xd VMware All-Flash VSAN Specifications
- Dell PowerEdge R730xd Servers (x4)
- CPUs: Eight Intel Xeon E5-2697 v3 2.6GHz (14C/28T)
- Memory: 64 x 16GB DDR4 RDIMM
- SSD:
- Cache: 16 x 400GB Toshiba PX04 Write-Intensive SAS3
- Capacity: 80 x 960GB Toshiba PX04 Read-Intensive SAS3
- Networking: 4 x Intel X520 DP 10Gb DA/SFP+, + I350 DP 1Gb Ethernet
- Storage Capacity: 69.86TB
The Toshiba drives used for this review were the Toshiba PX04S models. In our previous review we found that the PX04S models were the fastest SAS enterprise SSDs we have tested so far. The PX04S was also the highest capacity dual port SAS SSD when it was reviewed. The PX04S series comes in multiple endurance levels, ranging from high-endurance to low-endurance with mid- and value-endurance models as well. For this review we populated the Dell PowerEdge R730xd with sixteen 400GB write-intensive (PX04SHB040) and eighty 960GB value-endurance (PX04SVB096) drives. The write-intensive drives boast up to 25DWPD and the value-endurance drives up to 3DWPD. By comparison, in the hybrid configuration with the same servers, the cache tier was composed of four Toshiba PX02 800GB SSDs per host, netting double the cache tier capacity.
PX04SHB040 400GB write-intensive drive specifications:
- Performance
- Sustained 64KiB Sequential Read: 1,900MiB/s
- Sustained 64KiB Sequential Write: 850MiB/s
- Sustained 4KiB Random Read: 270K IOPS
- Sustained 4KiB Random Write: 125K IOPS
- DWPD: 25
PX04SVB096 960GB value-endurance drive specifications:
- Performance
- Sustained 64KiB Sequential Read: 1,900MiB/s
- Sustained 64KiB Sequential Write: 850MiB/s
- Sustained 4KiB Random Read: 270K IOPS
- Sustained 4KiB Random Write: 60K IOPS
- DWPD: 3
Application Workload Analysis
For this review we repopulated the Dell PowerEdge R730xd VMware VSAN with all Toshiba PX04 SAS3 SSDs. The first benchmarks consist of the MySQL OLTP performance via SysBench and Microsoft SQL Server OLTP performance with a simulated TPC-C workload.
Each SQL Server VM is configured with two vDisks, one 100GB for boot and one 500GB for the database and log files. From a system resource perspective, we configured each VM with 16 vCPUs, 64GB of DRAM and leveraged the LSI Logic SAS SCSI controller. These tests are designed to monitor how a latency-sensitive application performs on the cluster with a moderate, but not overwhelming, compute and storage load.
SQL Server Testing Configuration (per VM)
- Windows Server 2012 R2
- Storage Footprint: 600GB allocated, 500GB used
- SQL Server 2014
- Database Size: 1,500 scale
- Virtual Client Load: 15,000
- RAM Buffer: 48GB
- Test Length: 3 hours
- 2.5 hours preconditioning
- 30 minutes sample period
In the SQL Server TPC-C test on hyper-converged platforms, we look at workload balance across the cluster in hybrid mode, all-flash (AF) mode, and all-flash data reduction (AF DR). The AF version gave slightly stronger performance over the hybrid with individual VMs running from 3,112.4 TPS to 3,130.4 TPS, with an aggregate score of 12,472.8 TPS, the highest score overall. The DR configuration was at the lower end of the test configurations, with individual VMs running from 2,982.1 TPS to 3,009.6 TPS, with an aggregate score of 11,969.1 TPS.

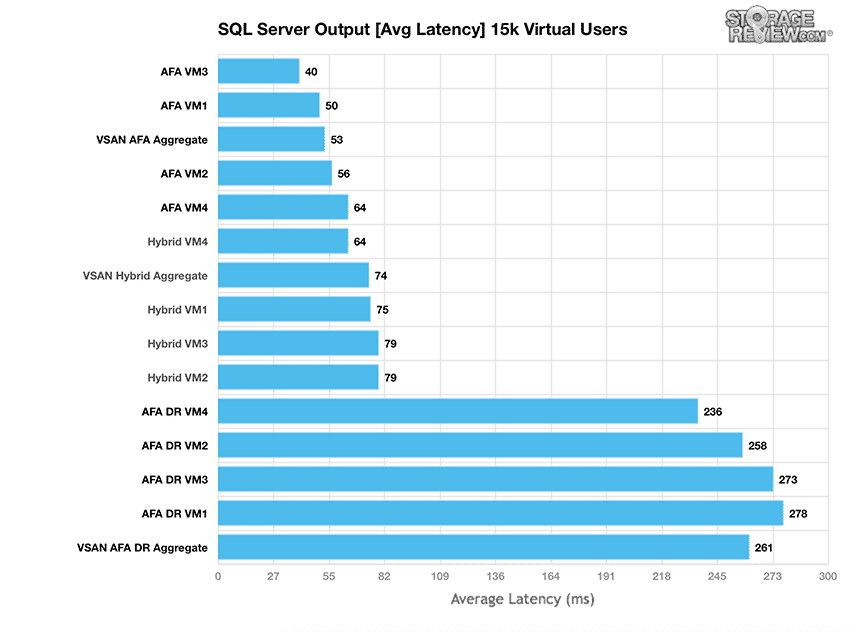
For the SQL Server TPC-C test, the variable we pay the most attention to is average latency. Small gaps in transactional performance won't show the full story. In our average latency test we saw the AF version’s highest score, 64ms, was the same as the hybrid's worst score. The AF also had an average score of 53ms. Once again the DR configuration placed at the bottom of the pack, with a low of 236ms, a high of 278ms, and an average of 261ms.
Sysbench Performance
Each Sysbench VM is configured with three vDisks: one for boot (~92GB), one with the pre-built database (~447GB), and the third for the database under test (400GB). From a system resource perspective, we configured each VM with 16 vCPUs, 64GB of DRAM and leveraged the LSI Logic SAS SCSI controller.
Sysbench Testing Configuration (per VM)
- CentOS 6.3 64-bit
- Storage Footprint: 1TB, 800GB used
- Percona XtraDB 5.5.30-rel30.1
- Database Tables: 100
- Database Size: 10,000,000
- Database Threads: 32
- RAM Buffer: 24GB
- Test Length: 12 hours
- 6 hours preconditioning 32 threads
- 1 hour 32 threads
- 1 hour 16 threads
- 1 hour 8 threads
- 1 hour 4 threads
- 1 hour 2 threads
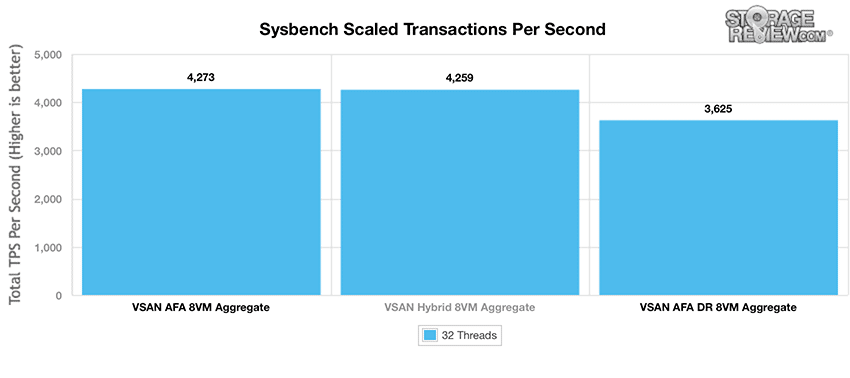
With the Sysbench OLTP we look at the 8VM configuration for each. The AF came out on top, slightly, pushing past the hybrid with 4,273 TPS to 4,259 TPS. The DR configuration scored 3,625 TPS.
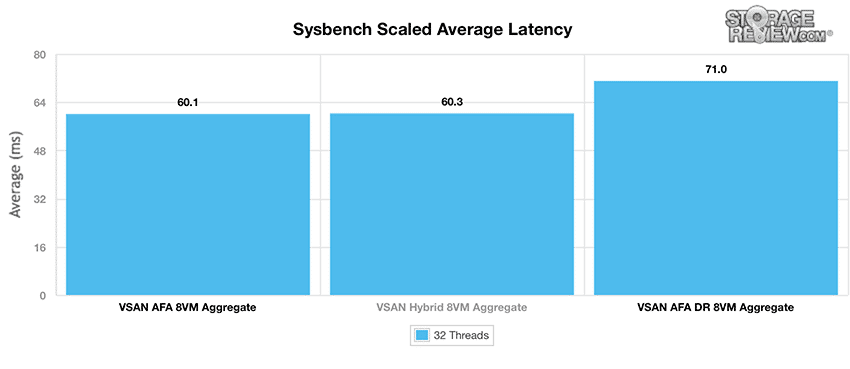
Looking at average latency, it is a bit of a surprise to see that the AF was not considerably higher than the hybrid, 60.1ms to 60.3ms respectively. The DR scored much higher with 71ms latency.
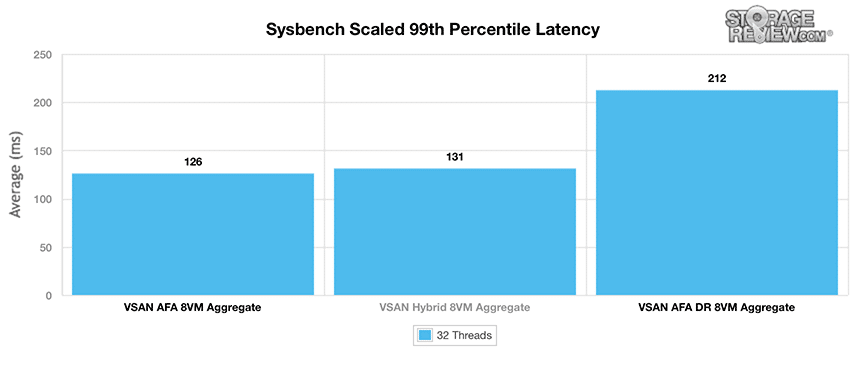
Average 99th percentile latency again showed a small decrease in latency for the AF versus the hybrid, 126ms to 131ms respectively. The DR had much higher latency at 212ms.
VMmark Performance Analysis
As with all of our Application Performance Analysis, we attempt to show how products perform in a live production environment compared to the company’s claims on performance. We understand the importance of evaluating storage as a component of larger systems, most importantly how responsive storage is when interacting with key enterprise applications. In this test we use the VMmark virtualization benchmark by VMware in a multi-server environment.
VMmark by its very design is a highly resource-intensive benchmark, with a broad mix of VM-based application workloads stressing storage, network and compute activity. When it comes to testing virtualization performance, there is almost no better benchmark for it, since VMmark looks at so many facets, covering storage I/O, CPU, and even network performance in VMware environments.
Here we look at the breakout of VMmark Overall and Application performance across both our Hybrid and All-Flash with Data Reduction VSAN configurations.
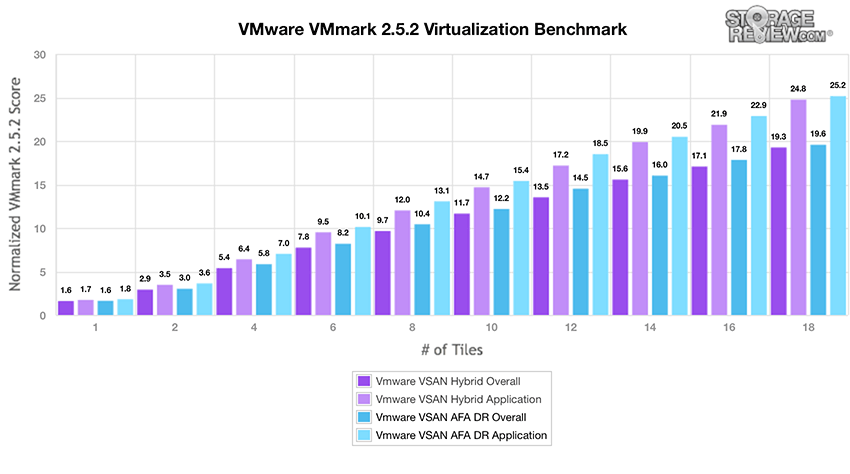
Capable of 18 tiles with compression and deduplication enabled, VSAN is the highest-performing storage system with data reduction we've tested to date. In past benchmarks, we topped out at 8 tiles with a dedicated dedup appliance in front of an all-flash array.
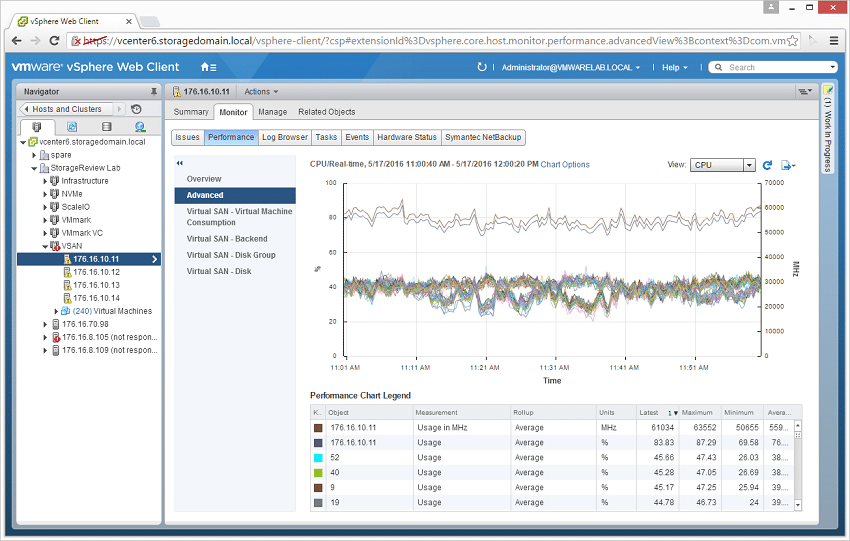
Looking at CPU resources on one of the hosts during this 18-tile All-Flash VSAN run, the system floated around 80-85% CPU usage. So while the storage aspect couldn't push higher, the cluster still had some resources left over.
HCIbench Test Configuration
- 16 VMs
- 10 VMDK per VM
- 10GB VMDK (1.6TB footprint)
- 50GB VMDK (8TB footprint)
- 100GB VMDK (16TB footprint)
- Full-write storage initialization
- 1.5 hour test intervals (30 minute preconditioning, 60 minute test sample period)
For testing the hybrid and AF DR configurations of our VMware VSAN we deployed two different configurations for our workload profiles. These included a 1.6TB (fully in-cache for the hybrid), 800GB (fully in-cache for the AF DR), and 16TB (spilling outside of cache) footprint to show how the platform responds as hot data grows. These sizes can be adjusted for each platform depending on how much flash is provisioned for cache or tiering.
StorageReview's HCIbench Workload Profiles
- 4K Random 100% read
- 4K Random 100% write
- 8K Random 70% read / 30% write
- 32K Sequential 100% read
- 32K Sequential 100% write
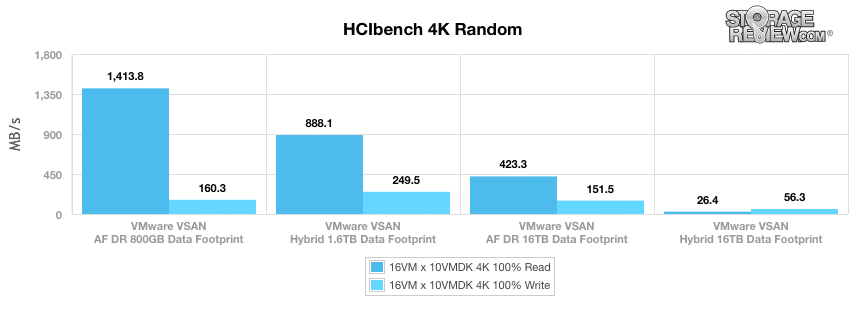
The first HCIbench test looks at peak random throughput from the VMware VSAN platform with a fully random 4K workload profile. Fully warmed up with data moved into cache, the hybrid gave us 888MB/s read and 249MB/s write with a 1.6TB footprint in cache. The AF DR, with a 800GB footprint in cache, gave us 1,414MB/s read and 160MB/s write. With the dataset up to 16TB (spilling outside of the cache), the hybrid gave us 26MB/s read and 56MB/s write, while the AF DR had an unsurprisingly stronger performance of 423MB/s read and 151MB/s write.
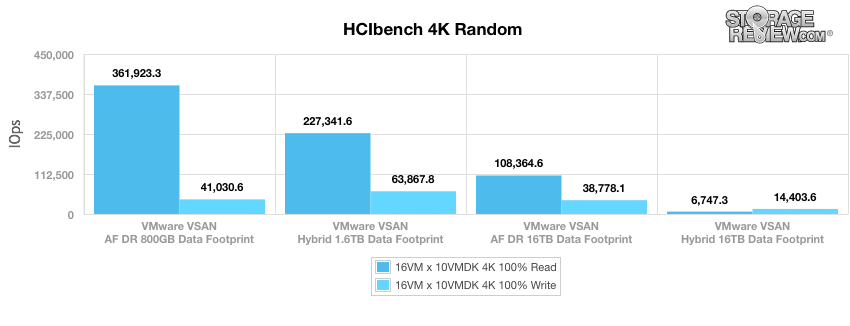
Next we look at peak I/O in the same 4k profile, and here we saw similar results. The 1.6TB data set in cache had the hybrid showing results of 227,342 IOPS read and 63,868 IOPS write while the 800GB dataset for the AF DR in cache had results of 361,923 IOPS read and 41,031 IOPS write. The 16TB dataset had the hybrid give us 6,747 IOPS read and 14,404 IOPS write and the AF DR had 108,365 IOPS read and 38,778 IOPS write.
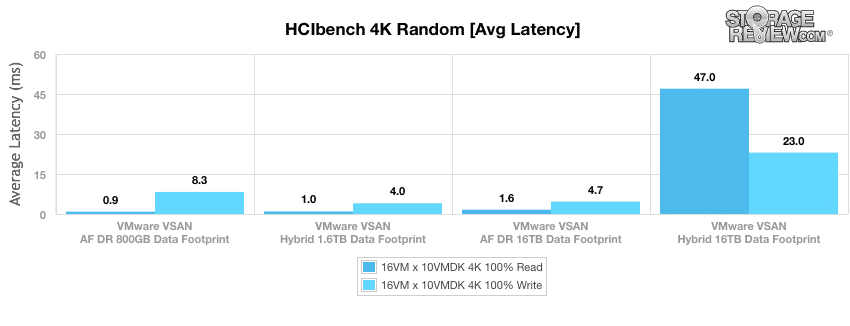
The next metric looks at the fully random 4K workload profile’s average latency. The in-cache 1.6TB footprint for the hybrid had a read latency of 1ms and a write latency of 4ms. The 800GB footprint in cache for the AF DR had a read latency of 0.88ms and a write latency of 8.29ms. With the 16TB dataset spilling out of the cache there is obviously going to be a much larger discrepancy in results as the hybrid will spill onto 10K spinning disks which always have higher latency, versus the AF DR staying on flash drives. Here the hybrid gave us latencies of 47ms read and 23ms write, while the AF DR gave us latencies of 1.65ms read and 4.66ms write.
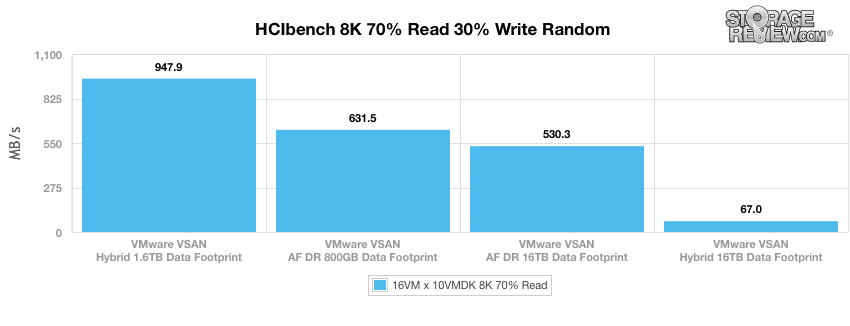
Our next test looks at a larger 8K data profile with a mixture of 70% read and 30% write activity. Here the hybrid in cache (with a 1.6TB footprint) hit 947.9MB/s. The AF DR in cache (with a 800GB) had a performance of 631.5MB/s. With the larger 16TB dataset spilling out of the cache, the hybrid’s performance dropped to 67MB/s while the AF DR saw a drop down to 530MB/s.
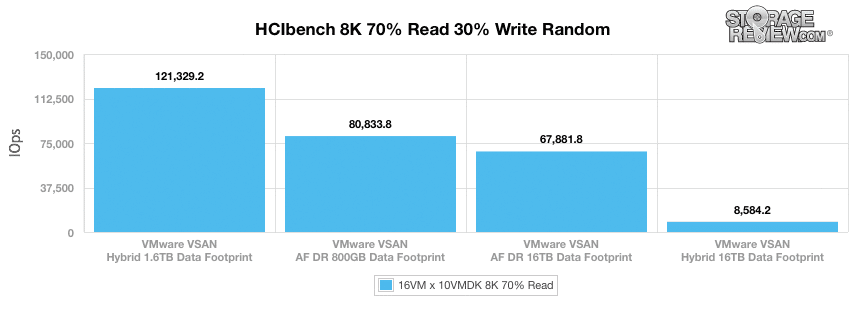
Next we look at I/O performance of the same 8k 70/30 workload. The hybrid 1.6TB footprint recorded 121,329 IOPS while the AF DR recorded 80,834 IOPS. Once the 16TB dataset spilled out of cache, both configurations saw a drop in performance with the hybrid now recording 8,584 IOPS and the AF DR recording 67,882 IOPS.
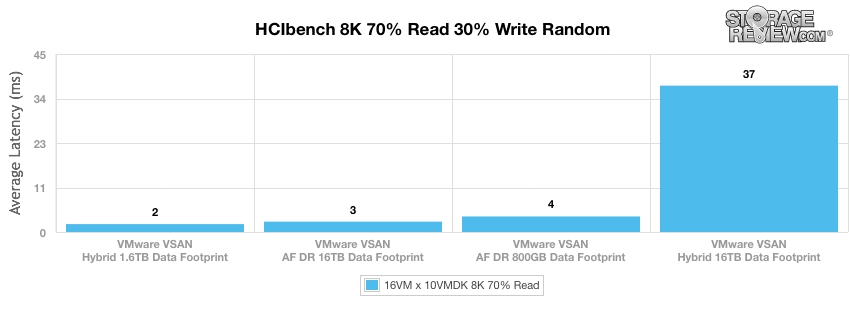
Looking at 8k 70/30 average latency, we saw similar placement to the above. Within cache, the hybrid had a latency of 2ms and the AF DR had a latency of 3.94ms. With the large dataset spilling out of cache, the hybrid jumped up to 37ms while the AF DR actually went down to 2.63ms.
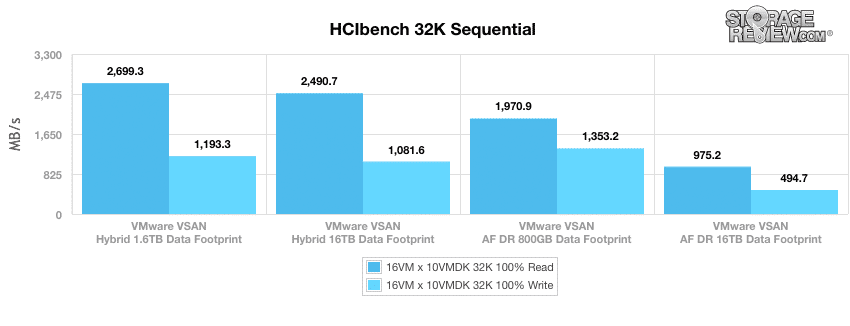
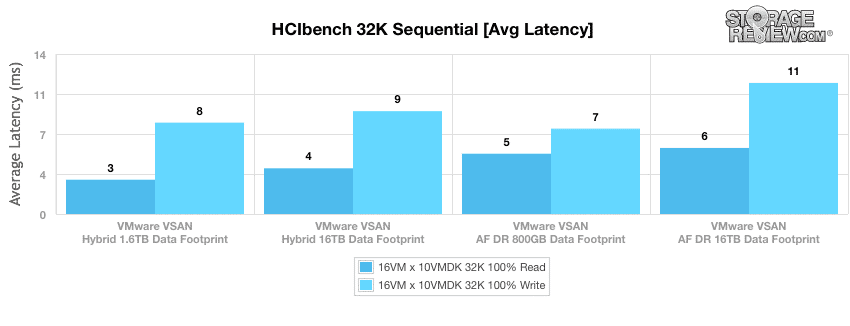
The last workload switches to a peak bandwidth focus, consisting of a 32K sequential read and write profile. In-cache performance of the hybrid showed 2,699MB/s read and 1,193MB/s, and the in-cache performance of the AF DR showed 1,971MB/s read and 1,353MB/s write. With the larger 16TB dataset we saw 2,490MB/s read and 1,082MB/s write with the hybrid and 975MB/s read and 495MB/s write with the AF DR.
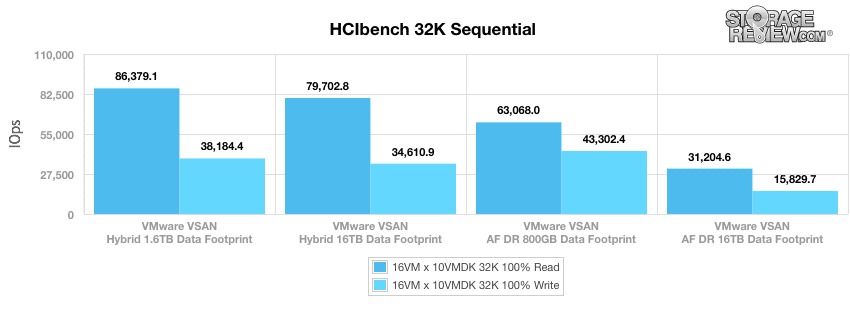
I/O performance showed similar results, with the hybrid giving mostly better performance than the AF DR. In-cache the hybrid had performance of 86,379 IOPS read and 38,184 IOPS write, while the AF DR had performance of 63,068 IOPS read and 43,302 IOPS write. With the larger dataset out of cache we saw the hybrid have 79,703 IOPS read and 34,611 IOPS write, while the AF DR had 31,205 IOPS read and 15,830 IOPS write.
With average latency, the hybrid gave us 3ms read and 8ms write in cache and 4ms read and 9ms write spilling out of cache. The AF DR, on the other hand, gave us 5.29ms read and 7.46ms write in cache and 5.78ms and 11.47ms write spilling out of cache.
Conclusion
VMware VSAN 6.2 gives organizations the chance to leverage flash in new and exciting ways, driving both efficiency and performance gains. Highlights of the new release include erasure coding, RAID5 support, deduplication and compression, all of which clearly lead to getting the most out of flash from a capacity standpoint. While the data reduction benefits will vary based on workload and configuration, it's reasonable to expect a 3-6x capacity gain. This basically means a relatively affordable 1TB drive is effectively able to deliver 3-6TB. This benefit alone makes 6.2 a worthy upgrade and gives flash a great place to excel.
When turning to performance, the all-flash config needs a little nuancing to explain properly. VSAN 6.2 doesn't deliver exponential gains when compared to the hybrid configuration we tested previously. There are a couple fundamental reasons for this. First off, VSAN is single threaded per disk group, which limits its ability to leverage all of the flash drives as effectively as possible. This is a design decision as VMware's emphasis is on minimizing VSAN overhead at the system level; this may be area VMware opts to rebalance in future releases. Secondly, when we enable data reduction features, we see lower performance on the all-flash configuration than hybrid. On the surface this may look like an issue, but for anyone who has experience with data reduction, there is a massive performance penalty in every case that we've seen. Many times we've seen upwards of an 80% overhead hit with competitive HCI solutions. This context is important; as VSAN all-flash with data reduction enabled actually did a very good job in this respect, matching the 18-tile VMmark score that our older Hybrid configuration was capable of. Further, VMware indicates most customers who buy all-flash configurations run with data reduction features enabled, making VSAN efficiency very important.
Currently data reduction is an all-or-nothing setting, where it applies to the whole datastore; VMware does this to maximize dedupe effectiveness. The data reduction server resource hit is countered by the expansion in capacity, which is a critical selling point in this case. In our four-node, 24-drive-per-server config (which is very common for VSAN), that means smaller/fewer SSDs can be used to match or exceed HDD capacity. This, of course, is in addition to all of the other benefits SSDs offer like lower power consumption, reduced cooling needs or wider operating tolerances.
For testing, we ran our assortment of application tests including our MySQL and Microsoft SQL Server OLTP performance, as well as VMmark virtualization benchmark by VMware and HCIbench. With SQL Server, the all-flash version was the top performer with an aggregate score of 12,472.8 TPS. The all-flash (AF) with data reduction (AF DR) also performed well with an aggregate score of 11,969.1 TPS. With SQL Server latency, the AF VSAN had the lowest overall latency with an aggregate score of 53ms, roughly 30% lower than the hybrid version. Unsurprisingly AF DR VSAN had a much higher latency with an aggregate of 261ms. With our SysBench test, it is interesting to note here that the AF performed just a hair better than the hybrid version (4,273 to 4,259 TPS, scaled average latency of 60.1ms to 60.3ms, and worst-case latency of 126ms to 131ms). With data reduction enabled, AF DR VSAN saw a performance dip but still had a scaled transactions per second of 3,625, a scaled average latency of 71ms, and a worst-case latency of 212ms.
With VMmark and data reduction enabled AF DR VSAN was able to hit 18 tiles (the previous best data reduction system only hit 8 tiles). That makes the AF DR VSAN the highest-performing storage array with data reduction in our VMmark test. The final test we looked at was HCIbench that, while it doesn’t show maximum capabilities of a system, gives us a good metric to compare the AF DR VSAN with the hybrid VSAN. In our 4k HCIbench test, the AF DR VSAN outperformed the hybrid version in both the in-cache and spilling-out-of-cache tests, particularly in reads. The AF DR was able to hit 4k read numbers as high as 1,1414MB/s, 361,923 IOPS, and an average latency of 0.9ms. Looking at our 8k 70/30 tests the hybrid performed better in-cache and the AF DR performed dramatically better once it spilled out of cache. In our 32k sequential tests, the hybrid VSAN performed better both in and out of cache than the AF DR VSAN.
We've done a lot of comparison between our initial hybrid VSAN configuration to an all flash deployment in this review. The hybrid held up well in initial testing and even today still shows strength. If the cache tiers are the same in a hybrid config and all flash config and working sets remain inside the cache, performance of the two will be relatively close. The all flash configuration however benefits by all of the new features in 6.2, in addition to the overarching benefits flash offers. Further, the downward pricing pressure on SSDs combined with data reduction, may even make all flash VSAN more cost effective per TB than hybrid.
Pros
- Strongest performing platform with data reduction that we've tested to date
- VSAN 6.2 brings a suite of new features that leverage the benefits of flash
- Very easy to set up; comfortable for virtualization admins to manage
Cons
- VSAN separates drives for cache and capacity layers; a single layer architecture for flash could be valuable
- Single-threaded disk groups within VSAN limits upside performance potential
Bottom Line
VMware VSAN 6.2 adds a slew of data efficiency features to the platform, enabling all flash VSAN deployments to deliver a compelling blend of features, performance and capacity while benefiting from all the peripheral benefits that flash brings to the table.

Sign up for the StorageReview newsletter