
2016 is Earth's warmest year, culminating in a remarkable three-year streak of record warm years for the globe

Courtesy of NOAA
With eight consecutive record warm months from January to August, the globally averaged temperature over land and ocean surfaces for 2016 was the highest since record keeping began in 1880, according to NOAA scientists. During the final month, the December combined global land and ocean average surface temperature departure from average was the third highest on record for any month in the 137-year record.
This summary from NOAA's National Centers for Environmental Information is part of the suite of climate services NOAA provides to government, business, academia and the public to support informed decision-making.
For extended analysis of global temperature and precipitation patterns, as well as extreme events, please see our full report.

2016 Global Temperature

- Global land and ocean surface temperature: During 2016, the average temperature across global land and ocean surfaces was 1.69°F (0.94°C) above the 20th century average of 57.0°F (13.9°C). This was the highest among all years in the 1880-2016 record, surpassing the previous record set last year by 0.07°F (0.04°C). The first eight months of the year had record high temperatures for their respective months. Since the start of the 21st century, the annual global temperature record has been broken five times (2005, 2010, 2014, 2015 and 2016).
- Global land surface temperature: During 2016, the globally averaged land surface temperature was 2.57°F (1.43°C) above the 20th century average. This was the highest among all years in the 1880-2016 record, surpassing the previous record of 2015 by 0.18°F (0.10°C).
- Record high temperatures over land surfaces were measured across Far East Russia, Alaska, far western Canada, a swath of the eastern United States, much of Central America and northern South America, southern Chile much of eastern and western Africa, north central Siberia, parts of south Asia, much of southeast Asia island nations and Papua New Guinea, and parts of Australia, especially along the northern and eastern coasts. No land areas were cooler than average for the year.
- Global ocean surface temperature: During 2016, the globally averaged sea surface temperature was 1.35°F (0.75°C) above the 20th century average. This was marginally the highest among all years in the 1880-2016 record, surpassing the previous record set last year by 0.02°F (0.01°C).
- Record high sea surface temperatures were observed across the northern Pacific waters near Alaska, the Bering Sea, parts of the southern and western Pacific, parts of the central western Atlantic, regions of the Gulf of Mexico and the Caribbean, parts of the southern and eastern Indian Ocean extending eastward across the waters of the southeastern Asia island nations and Oceania. The only ocean area with record cold temperatures was east of the Drake Passage near the Antarctic Peninsula, an area that has been much cooler than average since late 2013.
- Higher above Earth’s surface, separate analyses, drawn from both satellite and radiosonde (weather balloon) observations, found that 2016 was the warmest year on record for the planet's lower troposphere and its middle troposphere. The lower troposphere represents roughly the lowest 26,000 feet (five miles) of the atmosphere, while the mid-troposphere represents the layer between roughly 10,000 and 33,000 feet (two to six miles) above the surface.
- Satellite analyses found that 2016 was the coolest of the 38-year record for the lower stratosphere, the layer of the atmosphere between roughly 45,000 and 70,000 feet (8.5 to 13.5 miles) above the surface.
2016 Snow and Sea Ice
- Northern Hemisphere Snow Cover: According to NOAA data analyzed by the Rutgers Global Snow Lab, the average annual Northern Hemisphere snow cover extent during 2016 was 9.51 million square miles. This was about 100,000 square miles less than the 1981-2010 average, and it tied 2005 for 12th smallest of the 47 complete years on record since 1968.
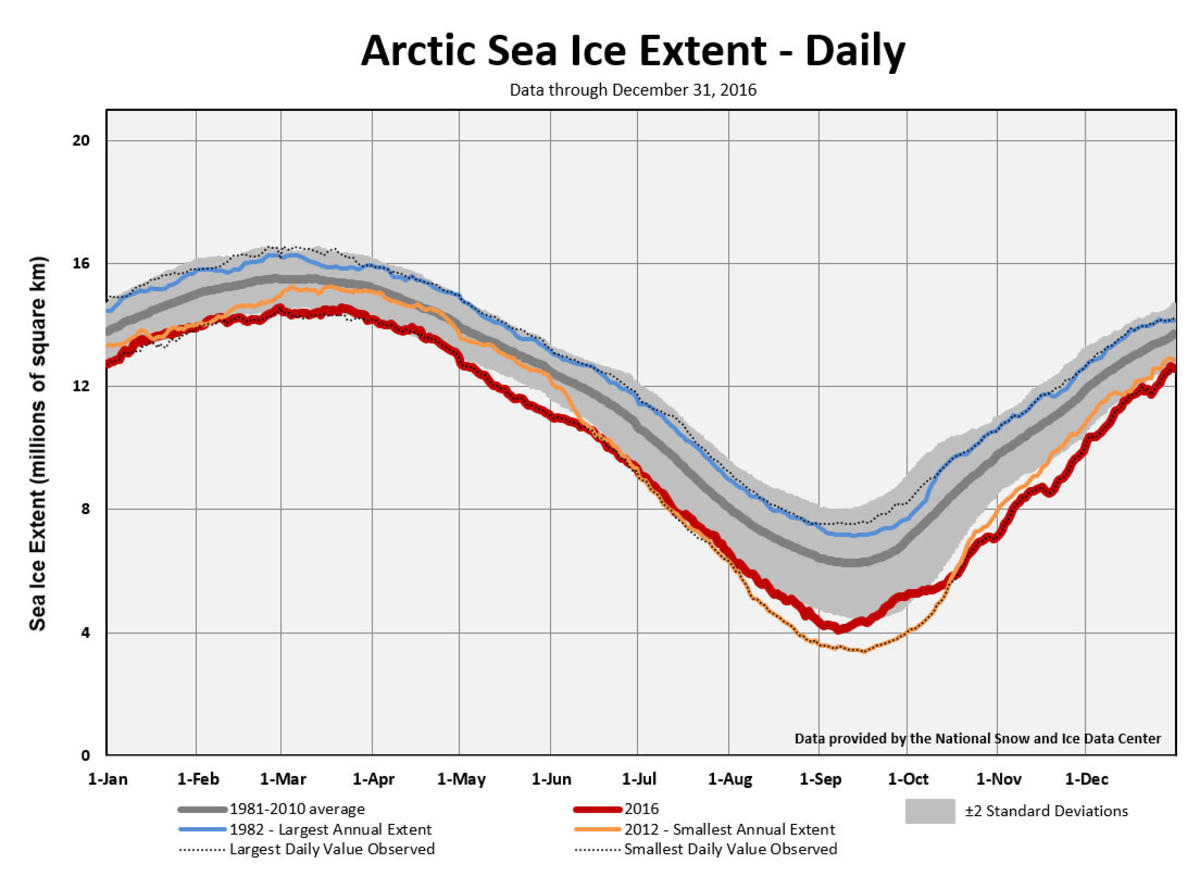
- Arctic Sea Ice Extent: Recent trends in the decline of Arctic polar sea ice extent continued in 2016. When averaging daily data from the National Snow and Ice Data Center, and noting that there was an unanticipated sensor transition during the year, the estimated average annual sea ice extent in the Arctic was approximately 3.92 million square miles, the smallest annual average in the record.
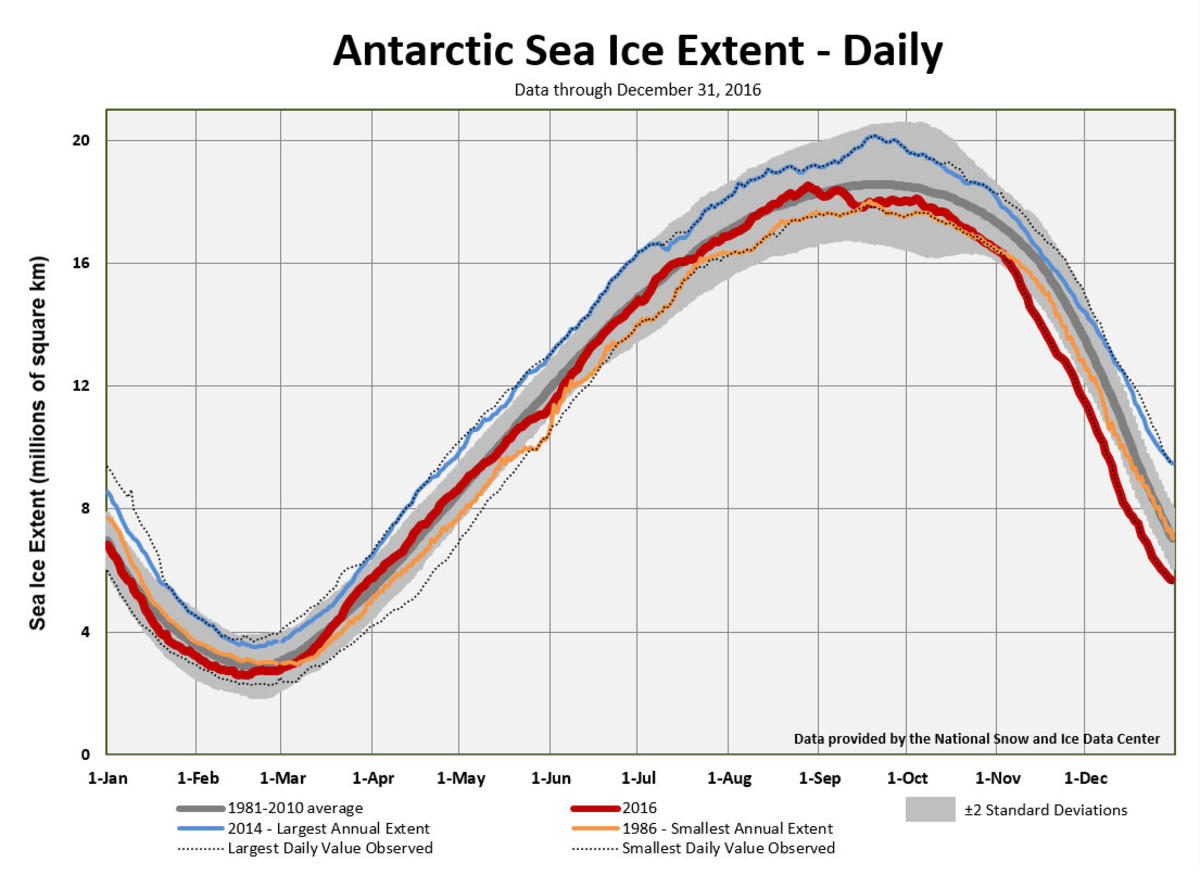
- Antarctic Sea Ice Extent: The annual Antarctic sea ice extent was the second smallest on record, behind 1986, at 4.31 million square miles. Both the November and December 2016 extents were record small.
December 2016 Global Temperature
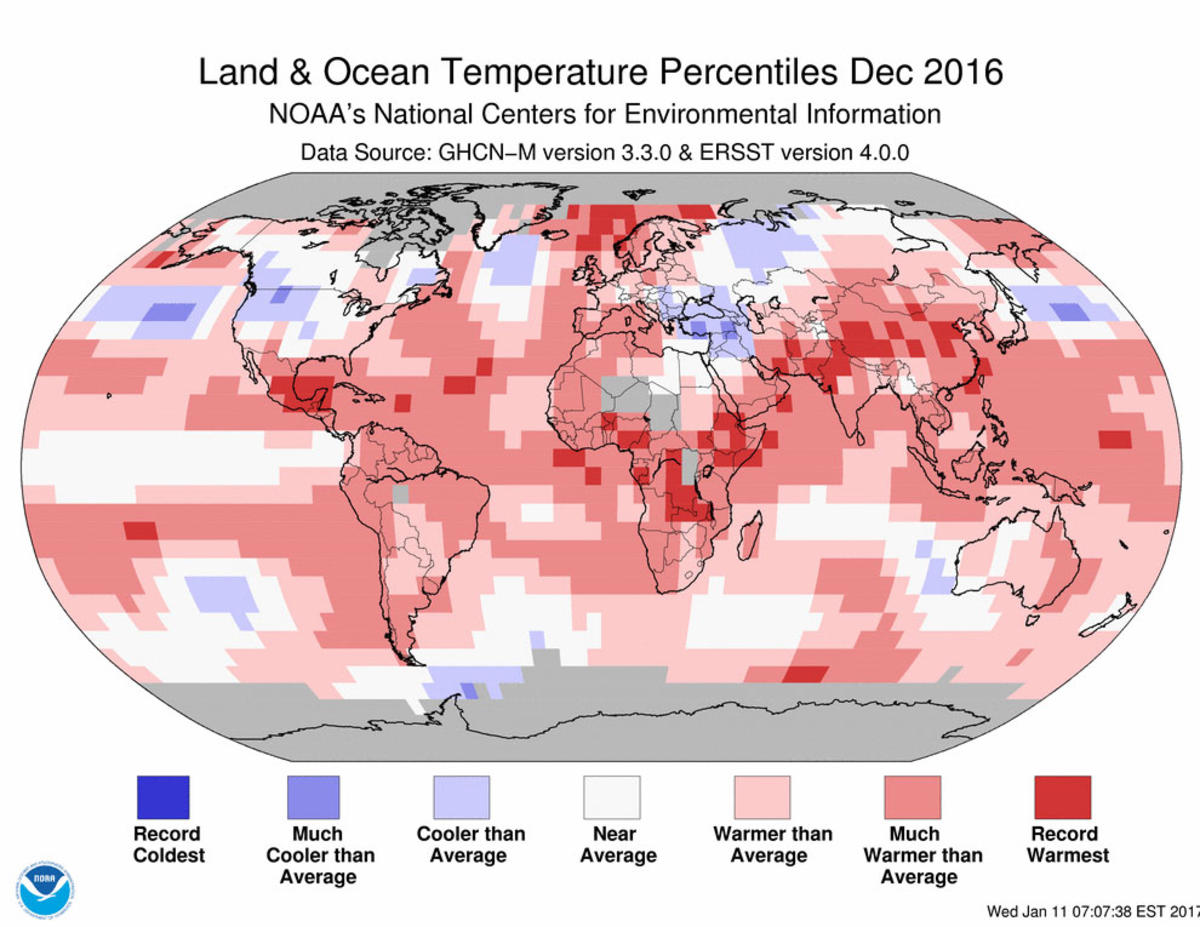
- Global land and ocean surface temperature: During December, the average temperature across global land and ocean surfaces was 1.42°F (0.79°C) above the 20th century average. This was the third highest departure from average for December in the 1880-2016 record. Only the Decembers of 2014 and 2015 were warmer.
- Global land surface temperature: During December, the globally averaged land surface temperature was 2.30°F (1.28°C) above the 20th century average. This was the sixth highest for December in the 1880-2016 record.
- Global ocean surface temperature: During December, the globally averaged sea surface temperature was 1.10°F (0.61°C) above the 20th century average. This was the fourth highest for December in the 1880-2016 record. Only the Decembers of 2009, 2014 and 2015 were warmer.
December 2016 Snow and Sea Ice

- Northern Hemisphere Snow Cover: According to data from NOAA analyzed by the Rutgers Global Snow Lab, the Northern Hemisphere snow cover extent during December was 17.5 million square miles, which is 550,000 square miles above the 1981-2010 average. This was the eighth largest December Northern Hemisphere snow cover extent in the 50-year period of record.
- Arctic Sea Ice Extent: The average Arctic sea ice extent for December was 4.67 million square miles, according to analysis by the National Snow and Ice Data Center based on data from NOAA and NASA. This value is 400,000 square miles (7.9 percent) below the 1981-2010 average and the second smallest December extent since records began in 1979.
- Antarctic Sea Ice Extent: Antarctic sea ice during December was 3.41 million square miles, according to analysis by the National Snow and Ice Data Center based on data from NOAA and NASA. This value is 970,000 square miles (22.2 percent) below the 1981-2010 average and the smallest December extent on record.


