Let’s talk about trends! I’m going to share my experience and to speak about the common mistakes of beginner traders. I hope this read will provide you with a deeper understanding of what a trend is, how to work with it and what market entry and exit points are.
Just like many of those who are at an early stage of their trading career, I’d been reading various books devoted to the technical analysis of price charts. I read quite a lot of those, and only a few skipped a concept of “trend trading”. “Follow the trend”, “the trend is your friend”, “buy if the price grows and sell if it falls” - these were the most popular tips by the authors of those books. However, when trying to use the tips, I inevitably got disappointed (blink twice if you’ve recognized yourself): as soon as I entered the market on the trend, I got kicked out by Stop Loss. But once I got kicked out by Stop Loss, the trend immediately re-established itself in the direction I had bet on. Knowledge is good but is not enough for profitable trading. Practice, practice and practice - that will improve your trading skills. Start practising and developing your trading strategy right after reading the article.
What’s the matter then? Are all these trading and investment best-sellers really useless when learning how to trade at Forex? Such was my next conclusion, but in reality, all was much deeper and more complicated.
The article covers the following subjects:
Trend and flat
It is often said that a flat is a “killer” of deposits of the traders who trade on trend. This is indeed the case. If your trading system demonstrates good results in case of strong trend in the market, it will not work well in case of flat market.
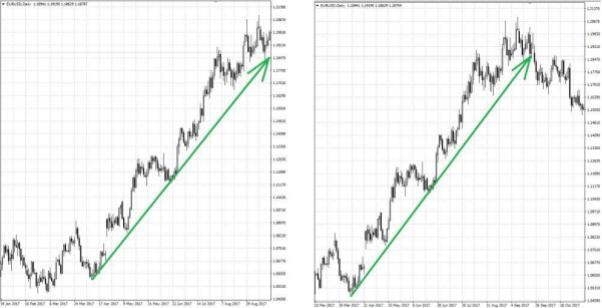
Experienced traders know that after sideways movement the price often moves in trend. Long-term flat can be used as a signal of the following up long-term trend, although this is not always true.
A period of the flat - is a period of uncertainty, when it is difficult to make any forecasts. When the price moves in a narrow range with no directional movement, it is almost impossible to determine future movement direction.
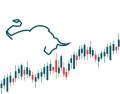
Trend is a directional movement of the price. There is a bullish trend - in the financial markets it is the rise in the asset price. This trend is associated with a bull that tosses up a prey on the horns. There is also a bearish trend when the price of the asset goes down. This trend is associated with a bear that paws its prey from top down to the bottom. A trader shall always consider current trend and trade in accordance with it. In case of the uptrend a trader shall buy, in case of the downward a trader shall sell.
Trend is a trader’s friend.
Sideways movement is also called a flat. I determine flat as a sideways trend. It helps to understand reversal patterns at Forex. Price movement can not only change from uptrend to downtrend, it can also go sideways as well! This is the fact, which is often overlooked by many traders, who lose money. Flat at Forex is a time period when the strength of the bulls and the bears are equal, which makes the formation of a certain trend difficult; therefore the price has no definite trend, moving in a certain price range.
Flat is a trap for inexperienced traders.
1. Start of the route and traders’ main mistake
This article deals with a Forex trader’s typical mistake called “market opinion”.
When a beginner Forex trader reads that “a probability of trend continuation is higher that a probability of trend change”, he/she gets an oversimplified idea of what is going on because of lack of experience. He/she starts thinking that if the trend is upward, the price will continue rising, and if the trend is downward, the price will continue falling. The word “probability” is slightly ignored at the beginning, and then it’s just completely forgotten as useless.
Why?
Just because we are all looking for the wrong thing: we’re looking for a final answer, the truth, or, as they say, the Grail of the Forex market that will tell us what the price will do next. We feel that we don’t know much about the subject and therefore we strive for more certainty. A typical thought that appears after a series of loss-making trades sounds like “If I enter on the trend and get kicked out by Stop Loss, I don’t define the trend correctly”. Familiar thought, isn’t it? It is, of course. At this very moment, 2 erroneous assumptions are inevitable made: “I cannot earn because I don’t understand where the price will be moving to” and, consequently, “I have to learn to understand where it will be moving to”.
2. What a trader really wants
Some choose to create an indicator strategy (like me some time ago) and to adjust indicator parameters so that they predict the price behaviour based on the trade history. When I succeeded in that, trading became more comfortable, but only until the first series of loss-making trades. Some can get interested in Forex market analyses or even may want to have training in the foreign exchange market with various traders in the hope of learning to define price directions. Unfortunately, nothing of the things above can offer what a beginner trader is looking for: there’s no only correct approach to analysis, or magic price pattern after which the price will certainly move in the right direction, or a perfect and faultless trading strategy with 100% profit probability and 9999% profitability per day. Just because it’s impossible.
Now let’s go more concrete. To predict a price direction, it’s necessary to get to know neither more nor less than all trading decisions by all market participants for the nearest future. Without even mentioning force majeure events, such as hurricanes, earthquakes or unexpected political decisions (for instance, recent Brexit) that can immediately change the intentions of recently surveyed traders. However, the Forex market if too big and there are too many participants, while sudden political decisions or natural calamities are simply unpredictable.
So, one may wonder how indicators, price charts, analytical forecasts or anything else can help a trader define where the price will go. How can we suppose that indicators, price charts, or forecasts can inform us about ALL traders’ intentions for the nearest instant (remembering about hurricanes and earthquakes)? What can prevent market participants from considering GBP/USD 1.50000 to be too high for the currency of the country that decided to leave the EU in June 2016? An upward trend?
This article contains more questions than answers. The faster a trader asks them, the shorter his/her development way to a Forex professional will be.
It is important to master a kind of a "trading intuition" as well. You develop it after a long time trading, as you become more experienced. You start to understand the chart, see the patterns that will work and the patterns that won't. Nothing extraordinary - you've seen so many of them you recognize them instantly. Just use the signals and analytics to translate the price chart into "buy/sell" chart and earn in the Forex market.
3. Identity of patterns or why the price went the wrong way
So, what shall we be looking for then and how to earn from Forex? I was extremely enraged when other traders said things like “no one knows where the price will move” and, what’s more, “one does not need to know where the price will move in order to earn”. I thought they were kidding and didn’t want to share their secrets :) But I got it in due course.
The most important knowledge any beginner trader has to accept as soon as possible is that the price can move anywhere at any moment: any trend can change in a second, any strong support/resistance level can be broken, any market conditions can change in a moment. However, this doesn’t mean we must always fear to get kicked out of a trade ;) We simply have to accept the fact there is no and there cannot be any certainty about price directions. The same price pattern can bring about an upward movement today and a downward movement tomorrow.
But in the first case, it’s “Wow, Head and Shoulders, I’m a super trader”, and in the second case - “damn! Head and Shoulders...I must have defined it wrong”. And our mind refuses to think the pattern is the same and different price directions are normal.
If we understand there is no and there cannot be any certainty about price directions, the next important conclusion suggests itself: there’s no only correct true approach, “ultimate trading strategy”, or “ideal method” because any of those will give rise to loss-making trades under market conditions of uncertainty (which is normal as well).
4. Entry point vs. Exit point
There was one more phrase disturbing me: “An entry point does not have any importance, an exit point does”. What?? Sounds crazy, right?
Because we instantly imagine a situation where a trader buys in any place, without understanding why and what for, and waits till his/her position grows profitable (if it does). What does it have to do with profitable trading? Nothing, of course. The phrase means something absolutely different.
The unimportance of an entry point and the importance of an exit point mean that both me and you, reading this article, can enter opposite trades at the same price and make a profit. How? We can trade on different time-frames:
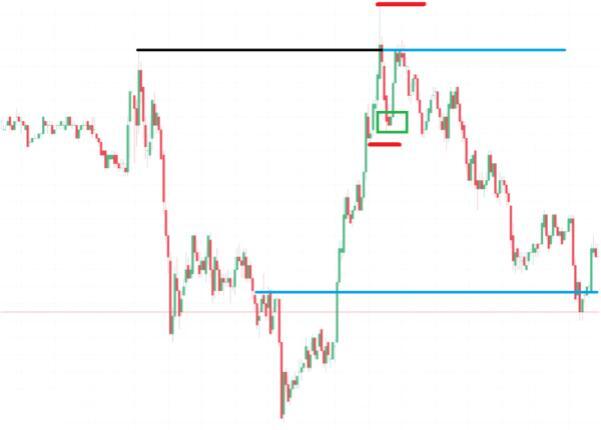
A green triangle marks the place where we entered a trade: for example, you bought and I sold. You bought because you entered from the demand zone, from where the price had grown earlier. If the price drops below this zone, the zone will no longer be active and your scenario won’t prove to be correct. That’s why your Stop Loss is placed exactly under this zone (lower red line). Your objective is the opposite zone (marked with a blue line above), and we see that your position has been closed with a profit and the trade correlation is 3/1. Congratulations!
I sold because I had seen a false level breakout: the price attempted to rise further but didn’t manage to. Fearing that an upward retracement may not happen, I sold with a market order (right to you). At the same time, I understand that “something” pushed the price back to the level and my Stop Loss will be right beyond the point from which the price reversed down (the red line above). If the price moves higher, I’ll understand that market conditions have changed. At the same time, my profit goal is near the source of the global upward movement (lower blue line) - right from where the price was pushed upwards, and exactly there increased demand may occur again. As we can see, my position is closed with a profit too and the correlation is almost the same: 3/1.
So, which of us is right in this case at the moment of entering a trade? =) Did the price move up or down?
If we summarize the messages set out in this article, we’ll understand that a desire to know where the price will go will only lead us to deadlock as we will always lack some information for the above reasons. We only need to know how acceptable current trade conditions are in terms of risk and potential according to our vision of the market, which, alas, needs to be developed independently.
Methods of determining market conditions
I use three methods of determining conditions of the market: indicator, graphic and session. Let’s take a closer look at them:
Indicator method of determining market conditions
A trader can use various volume indicators, such as: ADX, Pulse flat, Parabolic SAR, Bollinger Bands, Trend Filter, Xaser FV and others.
Volume indicators can be used to confirm a flat. Usually, during the period of flat they show lower values than at other times. However, if the trading channel has a wide range, a trader shall use some other tools to determine market conditions.
Example:
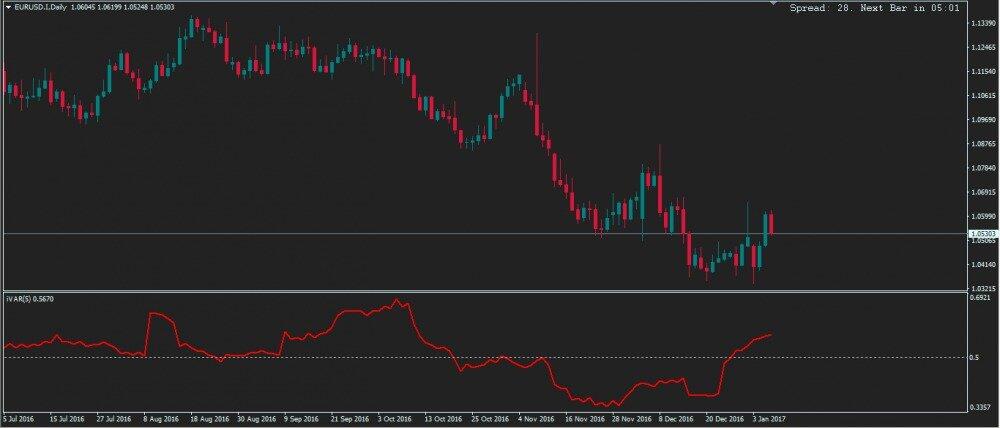
The figure above shows daily chart of the currency pair EUR/USD with the indicator iVAR or "the Index of variations", which looks like a zigzag in below the chart. This line is around the levelof 0.5, which is has been set in the default.
The indicator is based on the theory of financial time series, which represent fractal time functions.
The use of the indicator in trade:
- If an indicator is less than 0.5, it shows a trend. Low value shows that a trend is getting weak or that a correction can begin;
- If an indicator is more than 0.5, it shows a flat. Very high value shows the development of the trend;
- If an indicator is around 0.5, it shows uncertainty and it is better not to trade in this case.
Indicator iVAR can be used as an additional signal confirming signals of the other indicators. It shows the formation of a trend, but it does not show movement direction.
Note!
While using indicators to determine market conditions a trader shall always remember the following rules:
- Different tools have different advantages and disadvantages depending on market conditions and volatility. Therefore, a trader shall learn all the information about the indicators and test them many times.
- Consider your indicators only as an additional tool of the market analysis.
- Pay close attention to the original indicators. Especially to those, principle of work of which is not clear.
Graphic method of determining a flat or a trend
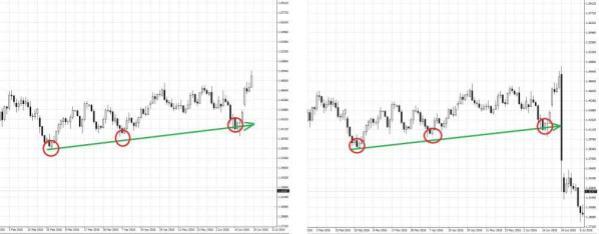
One of the effective method of determining a flat is to find their upper and lower lines then allocate there the support and resistance levels. Support and resistance levels is the most important factor of prices. If disbalance between sales and buys is appear on this levels, the price movement will be stopped or reversed. After the price breaks any of the flat borders, just start to search for trading opportunities.
The alternative possibility is the trading inside the channel, but you need to consider that the distance from the upper to the lower lines should be sufficiently large.
Example:
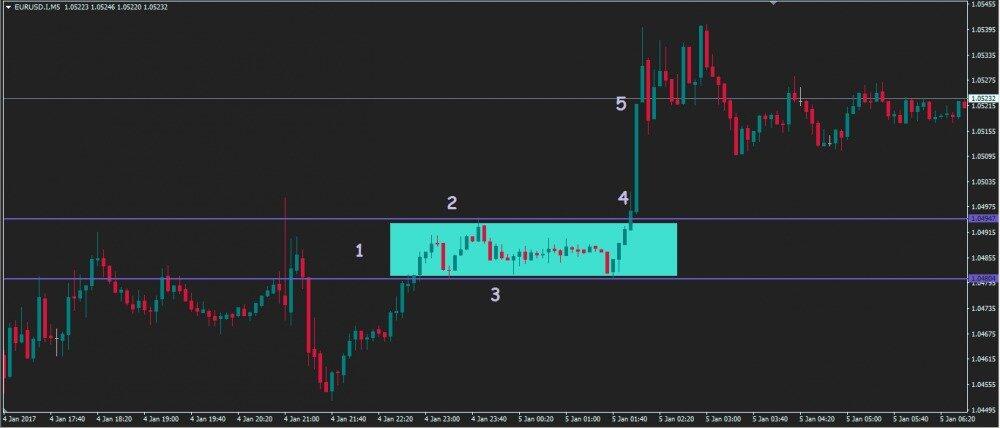
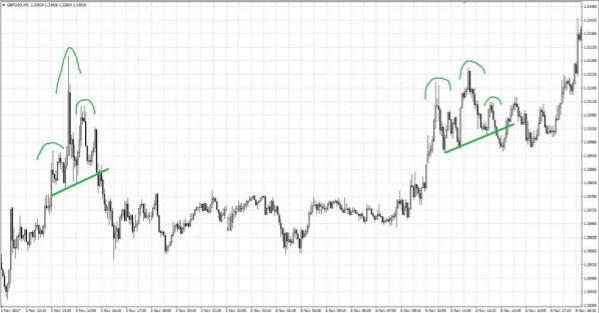
The figure above shows a five- minute chart of the currency pair EUR/USD.
- In the area 1 the price is moving sideways
- Upper limit of the flat
- Lower limit of the flat
- The price breaks the flat upward
- The price is in trend
A lot depends on the timeframe selected by a trader.
The range of the price channel can be either of 10 points or 100 points, depending on the timeframe. A trader should clearly understand that the flat on a daily or hourly timeframe does not exclude ascending or descending trend on say, five-minute chart.
Note!
Sometimes, a shape of a candlestick helps to determine market conditions. If the body of a candlestick is unusually short, while the shade is very long, it tells that neither buyers nor sellers have an advantage in the market.
Session method of determining a flat
This method is especially useful for intraday trading. Forex trading is available 24 hours a day, but in reality, trading day consists of several trading sessions.
This method is based on consideration of each trading session separately; as a rule, after a period of price consolidation, the price starts to move strongly to either direction.
If during one trading session the price was in flat, during the next session the price may move in trend, and Vice versa.
Example:
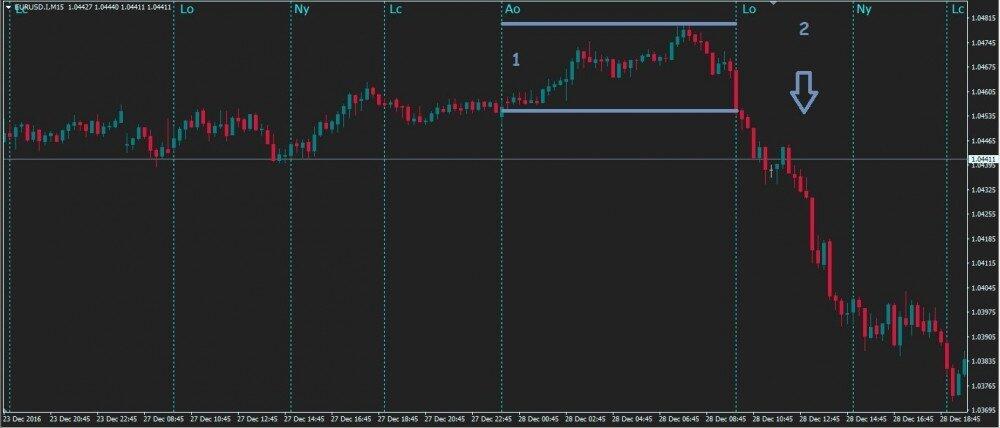
The figure above shows the main trading sessions and the five-minute chart of the currency pair EUR/USD.
Meaning of the symbols on the chart:
Ao - opening of the Asian session;
Lo - opening of the London session;
Ny – opening of New York and American sessions;
Lc - closure of the London and European sessions.
In the area 1, which is the Asian trading session, the price moves in a narrow channel (about 30 points); with the opening of London session (area 2) the price moves in a strong trend.
Note!
- A trader shall always take into account important economic news, as the news often is the main driver of strong trend movement.
- Activity of different trading instruments varies during trading sessions. For example, volatility of the major currency pairs increases significantly after the opening of the London and American markets.
Remember
A trader shall learn well all information about the indicators he/she is going to use for determining market conditions; indicators are used only as additional tools of market analysis.
If you use a graphical method of determining a flat, do not forget to look higher timeframes. Different time intervals may show different market conditions.
Take into account important macro-economic statistics and economic news, as they affect movement direction.
Try not to trade in flat, as it can be very risky.
I am really excited about 2 articles on the same theme from my forex blog colleges and i wish to recommend it for reading for everyone:
1. "Trend is your friend....but for how long?" - read here (recommended for the beginners).
2. "Where will the trend end? TD Trend Factor and TD Propulsion" - read here (recommended for the professionals)
P.S. Did you like my article? Share it in social networks: it will be the best "thank you" :)
Ask me questions and comment below. I'll be glad to answer your questions and give necessary explanations.
Useful links:
- I recommend trying to trade with a reliable broker here. The system allows you to trade by yourself or copy successful traders from all across the globe.
- Use my promo code BLOG for getting deposit bonus 50% on LiteFinance platform. Just enter this code in the appropriate field while depositing your trading account.
- Telegram chat for traders: https://t.me/litefinancebrokerchat. We are sharing the signals and trading experience
- Telegram channel with high-quality analytics, Forex reviews, training articles, and other useful things for traders https://t.me/litefinance
The content of this article reflects the author’s opinion and does not necessarily reflect the official position of LiteFinance. The material published on this page is provided for informational purposes only and should not be considered as the provision of investment advice for the purposes of Directive 2004/39/EC.