One of the biggest benefits (in my very biased opinion) of a DIY closed loop is this: it’s designed to be understandable to the person using it.
You don’t have to guess “what did it do at 2am?” or “why did it do a temp basal and not an SMB?”
Well, you COULD guess – but you don’t have to. Guessing is a choice ;).
Because we’ve been designing a system that a person has to decide to trust, it provides information about everything it’s doing and the information it has. That’s what “the logs” are for, and you can get information from “the logs” from a couple of places:
- The OpenAPS “pill” in Nightscout
- Secondary logging sources like Papertrail
- Information that shows up on your Pebble watch
- The full logs from SSH’ing into a rig (usually what we mean when we ask, “what do your logs say?”)
Here’s an example of the information the OpenAPS pill provides me in Nightscout:
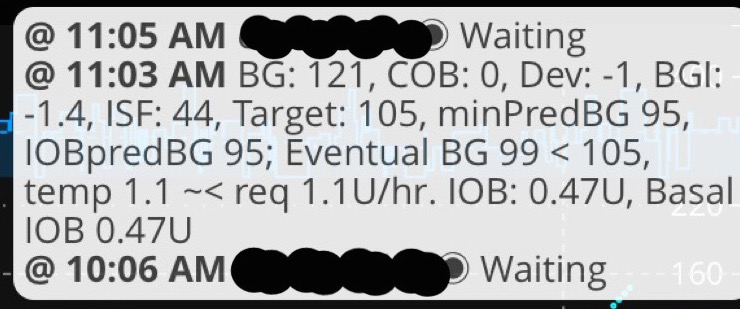
This tells me that at 11:03 am, my BG was 121; I had no carbs on board; was dropping a tiny bit as expected and was likely going to end up slightly below my target; and the current temporary basal rate running was about equivalent to what OpenAPS thought I needed at the time. I had 0.47 netIOB, all from basal adjustments. It also specifies some of the eventual numbers that are what trigger the “purple line predictions” displayed in Nightscout, so if you can’t tell where the line is (90 or 100?), you can use the pill information to determine that more easily.
(Here’s the instructions for setting up Nightscout for OpenAPS)
Here’s an example of a log from Papertrail and what it tells us:
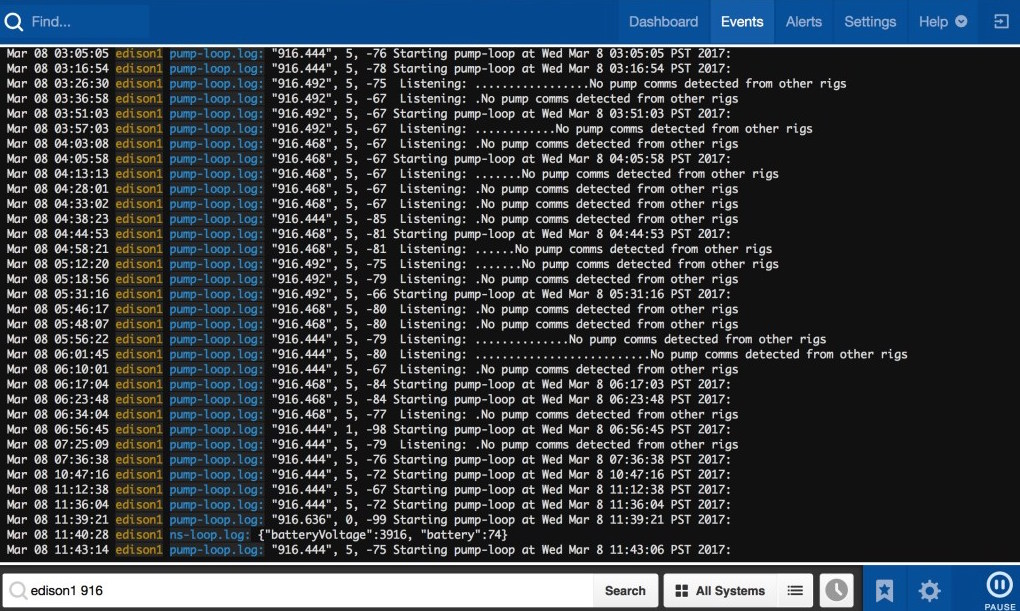
This example is from Katie, who described her daughter’s patterns in the morning: when Anna leaves her rig in the bedroom and went to take a shower, you can see the tune change at around 6:55, meaning she’s out of range of the rig. After the shower, getting dressed, and getting back to the rig around 7:25, it goes back to “normal” tuning (which means reading and writing to the pump as usual).
Papertrail is handy for figuring out if a rig is working or not remotely and high level why it might not be, especially if it’s a communication or power problem. But I generally find it to be most helpful when you know what kind of problem it is, and use it to drill down on a particular thing. However, it’s not going to give you absolutely all the details needed for every problem – so make sure to read about how to access the traditional logs, too, and be able to do that on the go.
(Here’s the instructions for getting Papertrail going for OpenAPS)
Here’s what the logs ported to my Pebble tell me:
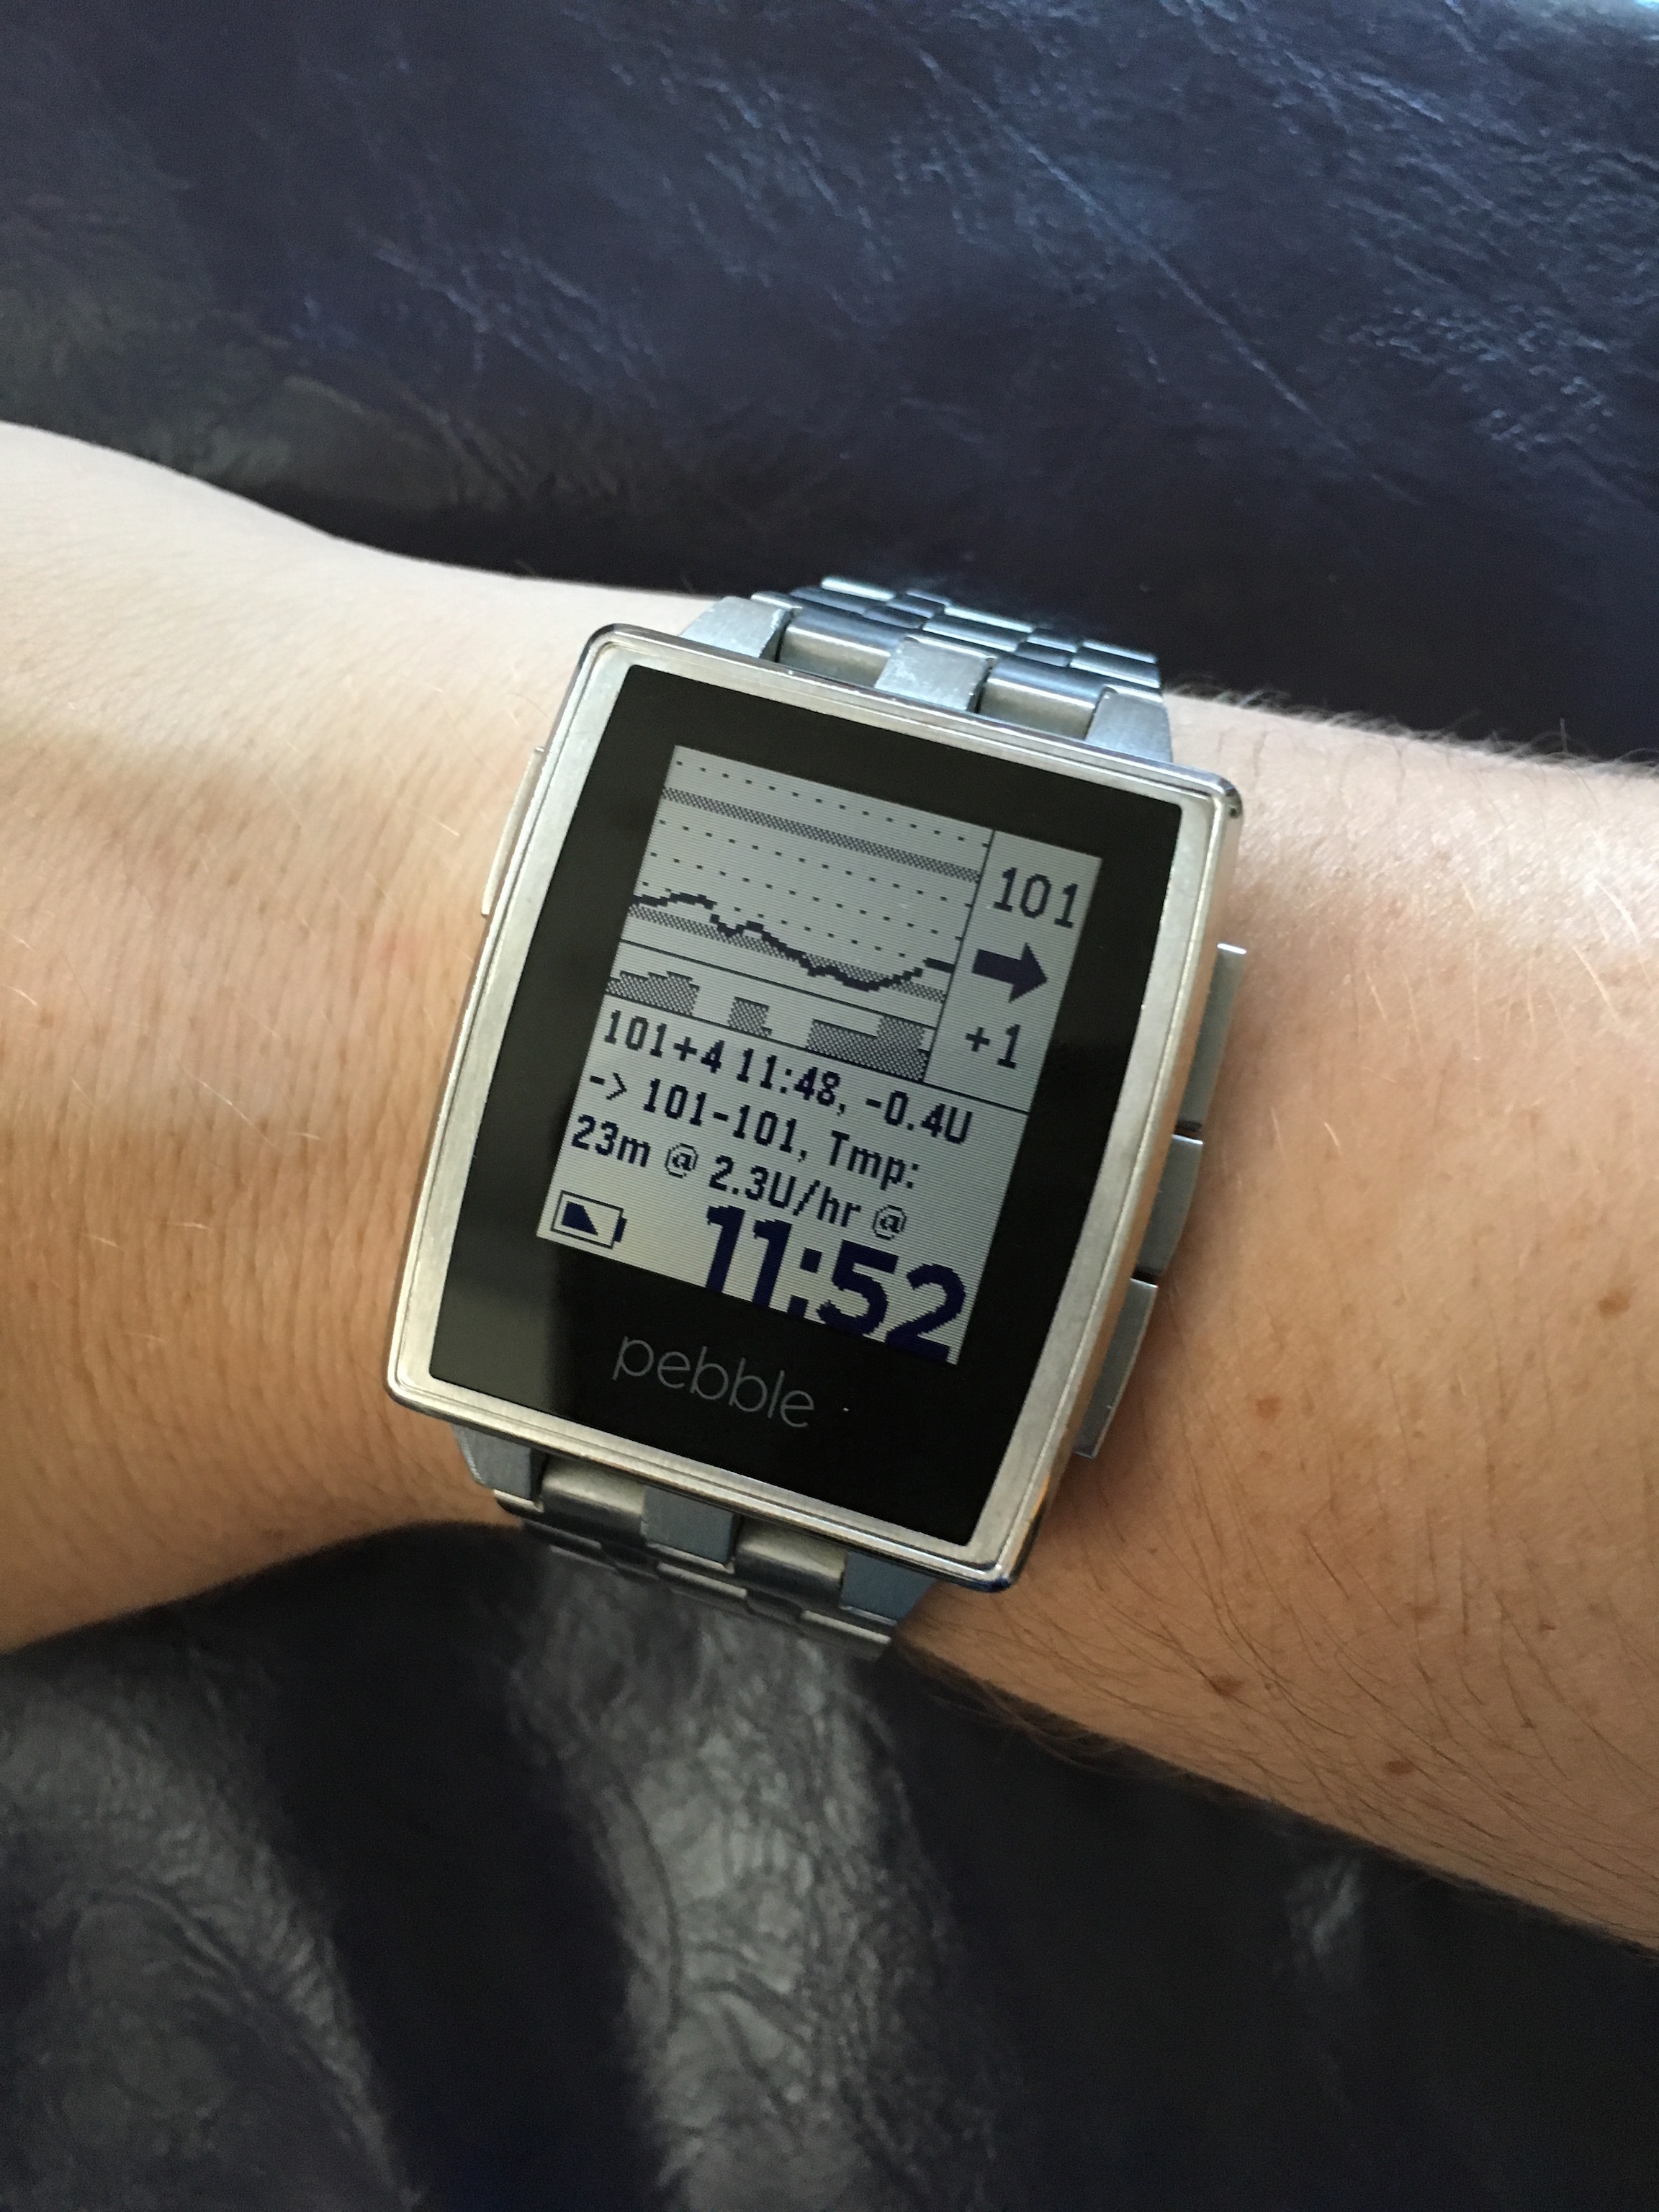
There’s several helpful things that display on my watch (using the excellent “Urchin” watchface designed by Mark Wilson, which you can customize to suit your personal preference): BGs, basal activity, and then some detailed text, similar to what’s in the OpenAPS pill (current BG, the change in BG, timestamp of BG, my netIOB, my eventual BGs, and any temp basal activity). In this case, it’s easy for me to glance and see that I was a bit low for a while; am now flat but have negative net IOB so it’s been high temping a bit to level out the netIOB.
(I’ve always preferred a data-rich watchface – even back in the days of “open looping” with #DIYPS:)
https://twitter.com/danamlewis/status/652566409537433600/photo/1
(Here’s more about the Urchin watchface)
Here’s what the full logs from the rig tell me:
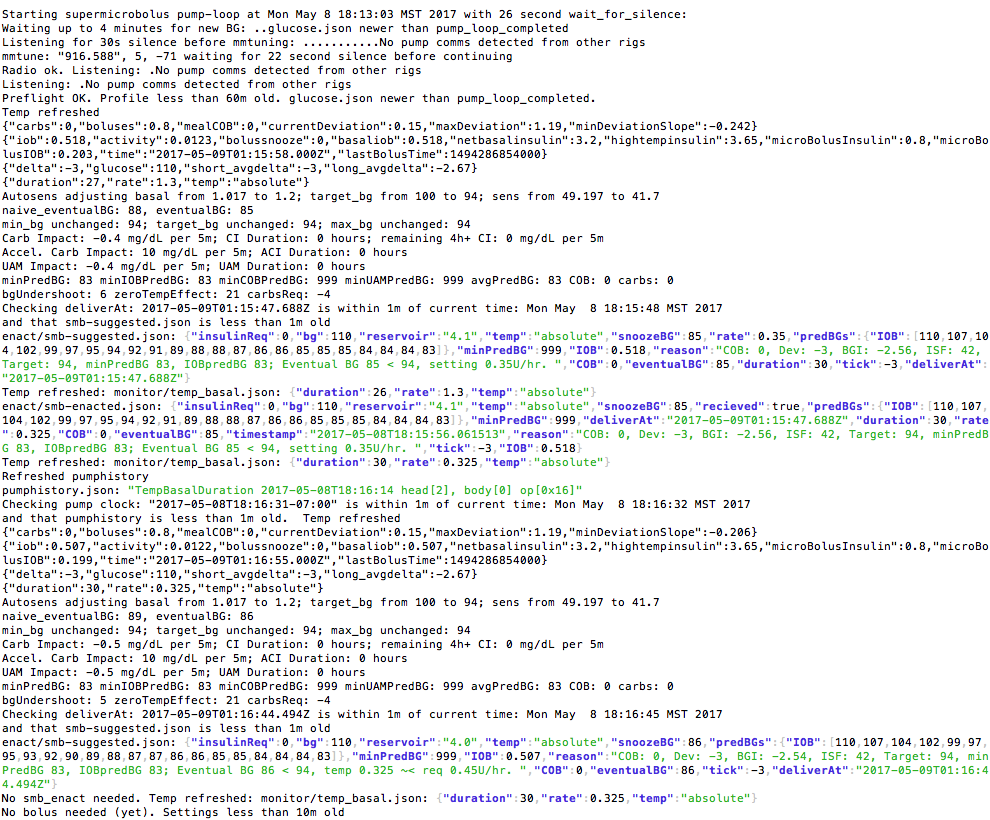
This has a LOT of information in it (which is why it’s so awesome). There are messages being shared by each step of the loop – when it’s listening for “silence” to make sure it can talk successfully to the pump; refreshing pump history; checking the clocks on devices and for fresh BGs; and then processing through the math on what the BG is, where it’s headed, and what needs to happen. You can also see from this example where autosensitivity is kicking in, adjust basals slightly up, target down, and sensitivity down, etc. (And for those who aren’t testing oref1 features like SMB and UAM yet, you’ll get a glimpse of how there’s now additional information in the logs about if those features are currently enabled.)
(Here are some other logs you can watch, and how to run them)
Pro tip for OpenAPS users: if you’re logged into your rig, you just have to type l (the letter “L” but lower case) for it to bring up your logs!
So if you find yourself wondering: what did OpenAPS do/why did it do <thing>? Instead of wondering, start by looking at the logs.
And remember, if you don’t know what the problem is – the full logs are the best source of information for spotting what the main problem is. You can then use the information from the logs to ask about how to resolve a particular problem (Gitter is great for this!)– but part of troubleshooting well/finding out more is taking the first step to pull up your logs, because anyone who is going to help you troubleshoot will need that information to figure out a solution.
—
And if you ever see someone say “RTFL”, instead of “read the manual” or “read the docs”, it means “read the logs”. 😉 
One thought on “Why guess when you don’t have to? (#OpenAPS logs & why they’re handy)”