
Genome-wide identification and expression profile analysis of CCH gene family in Populus
- Published
- Accepted
- Received
- Academic Editor
- Susan Gibson
- Subject Areas
- Bioinformatics, Molecular Biology, Plant Science
- Keywords
- Populus, Copper stress, Copper homeostasis, Copper chaperone, Expression profile
- Copyright
- © 2017 Xu et al.
- Licence
- This is an open access article distributed under the terms of the Creative Commons Attribution License, which permits unrestricted use, distribution, reproduction and adaptation in any medium and for any purpose provided that it is properly attributed. For attribution, the original author(s), title, publication source (PeerJ) and either DOI or URL of the article must be cited.
- Cite this article
- 2017. Genome-wide identification and expression profile analysis of CCH gene family in Populus. PeerJ 5:e3962 https://doi.org/10.7717/peerj.3962
Abstract
Copper plays key roles in plant physiological activities. To maintain copper cellular homeostasis, copper chaperones have important functions in binding and transporting copper to target proteins. Detailed characterization and function analysis of a copper chaperone, CCH, is presently limited to Arabidopsis. This study reports the identification of 21 genes encoding putative CCH proteins in Populus trichocarpa. Besides sharing the conserved metal-binding motif MXCXXC and forming a βαββαβ secondary structure at the N-terminal, all the PtCCHs possessed the plant-exclusive extended C-terminal. Based on their gene structure, conserved motifs, and phylogenetic analysis, the PtCCHs were divided into three subgroups. Our analysis indicated that whole-genome duplication and tandem duplication events likely contributed to expansion of the CCH gene family in Populus. Tissue-specific data from PlantGenIE revealed that PtCCH genes had broad expression patterns in different tissues. Quantitative real-time RT-PCR (qRT-PCR) analysis revealed that PnCCH genes of P. simonii × P. nigra also had different tissue-specific expression traits, as well as different inducible-expression patterns in response to copper stresses (excessive and deficiency). In summary, our study of CCH genes in the Populus genome provides a comprehensive analysis of this gene family, and lays an important foundation for further investigation of their roles in copper homeostasis of poplar.
Introduction
Copper (Cu) is an important transition metal in plants, and is involved in many physiological processes. As a cofactor, copper is required for plastocyanin, cytochrome c oxidase (or complex IV), copper/zinc superoxide dismutase (Cu/Zn SOD), the ethylene receptor, diamine oxidase, laccase, multicopper ferroxidase, and polyphenol oxidase (Pilon et al., 2006; Burkhead et al., 2009; Yamasaki et al., 2009). In the cell environment, Cu can exist in two states, Cu(II) and Cu(I). Free Cu ions in cells can generate reactive oxygen species (ROS) such as superoxide, hydrogen peroxide (H2O2), and the hydroxyl radical, which then damage biomacromolecules such as proteins, lipids, and DNA (Harrison, Jones & Dameron, 1999; Brewer, 2010). To protect cells against these types of free radical-mediated damage induced by excess copper, organisms have developed the capacity to scavenge or invalidate ROS through the combined action of highly specialized antioxidant proteins in the evolutionary process (Lin & Culotta, 1995).
To appropriately regulate copper homeostasis in response to environmental copper levels, plants have developed a complex network of metal trafficking pathways to ensure proper delivery of this essential element to target metalloproteins (Yruela, 2009). This network involves the acquisition and distribution of copper. Recent reports have indicated that many key components are involved in this process in plants, including copper transporters, copper chaperones, and copper proteins (Yruela, 2005; Burkhead et al., 2009). The COPT/Ctr family members are membrane proteins that act as copper transporters. The first cloned copper transporter was ScCTR1 from Saccharomyces cerevisiae, after which many homologous proteins have been identified in plants (Dancis et al., 1994; Sancenón et al., 2003; Martins et al., 2012). Arabidopsis thaliana has six AtCOPT proteins that play important roles in copper acquisition in response to deficiency or excess copper levels, copper export from the vacuole, and distribution of copper from root to aerial tissues (Sancenón et al., 2004; Klaumann et al., 2011; Perea-García et al., 2013). The COPT/Ctr family in rice contains seven members, among which OsCOPT2, OsCOPT3, or OsCOPT4 may cooperate with OsCOPT6 for high-affinity copper uptake, while OsCOPT7 may act alone to transport copper (Yuan et al., 2011).
After its transfer into the cytoplasm, copper is delivered to specific organelles and/or to specific copper proteins to protect cells from copper toxicity. The copper chaperones function as Cu(I) ion shuttles to transport copper to their target proteins in various intracellular compartments (Harrison, Jones & Dameron, 1999; Markossian & Kurganov, 2003). At least three types of copper chaperones have been found in Arabidopsis. The copper chaperone for superoxide dismutase delivers copper to Cu/Zn SODs, including CSD1 and CSD3 in the cytosol, and CSD2 in the plastid (Casareno, Waggoner & Gitlin, 1998; Chu et al., 2005). The AtCOX17 chaperone supplies copper to mitochondria to assemble a functional cytochrome oxidase complex (Balandin & Castresana, 2002). Other mitochondrial copper chaperones, COX19 and COX11, are also required for cytochrome c oxidase (COX) activation in plants (Carr & Winge, 2003; Attallah et al., 2007; Radin et al., 2015). The third types of copper chaperones are the homologs of yeast Atx1, AtCCH and AtATX1 (Himelblau et al., 1998; Puig et al., 2007a). AtATX1 interacts with responsive-to-antagonist 1 (RAN1; also known as HMA7) and HMA5; RAN1 is required for ethylene signaling, and HMA5 contributes to copper efflux in Arabidopsis (Hirayama et al., 1999; Andrés-Colás et al., 2006). Therefore, AtATX1 is likely related to copper homeostasis and ethylene signal transduction.
AtCCH was the first copper chaperone identified in Arabidopsis. It shares 36% similarity with Atx1 of S. cerevisiae and 74% similarity with AtATX1 (Andrés-Colás et al., 2006). Besides the conserved βαββαβ-fold structure and a MXCXXC Cu+-binding motif in its N-domain, AtCCH has the plant-specific C-terminal extended conformation with special amino acid composition. The N-domain of CCH could rescue the high-affinity iron uptake function of yeast atx1Δ cells, as well as the oxidation resistance function of yeast sod1Δ cells (Himelblau et al., 1998; Puig et al., 2007a). These functions are copper dependent in yeast mutant cells. Copper deficiency, senescence, and oxidative stress upregulated the expression of AtCCH, and CCH mRNA decreased rapidly under excess copper conditions, but the CCH protein remained stable (Himelblau et al., 1998; Puig et al., 2007a). Moreover, CCH was located mainly around the vascular bundles of senescing leaves and petioles, and also accumulated in stem sieve elements (Mira, Martínez-García & Peñarrubia, 2001a). These findings indicate that CCH might be transported through plasmodesmata to nonnucleated cells by means of its C-terminal domain. In this way, CCH could deliver copper during senescence-associated nutrient mobilization through the symplastic pathway. Otherwise, the C-domain of CCH adopted an extended conformation in solution and formed well-ordered amyloid-like fibrils (Mira et al., 2004). Further, the C-domain, not the N-domain, altered the SDS-PAGE mobility of the whole CCH protein (Mira et al., 2001b; Puig et al., 2007a). After deleting the C-terminus, CCH could interact with the metal binding domain of the P-type ATPases, RAN1 and HMA5 (Puig et al., 2007b; Shin, Lo & Yeh, 2012). These results suggest that the CCH C-terminal extension might possess special functions in copper homeostasis of plant. Although the CCH protein has been investigated to some extent in Arabidopsis, few studies of this protein have been reported in woody plants.
Large and perennial forest trees have massive root systems, extensive secondary growth, a coordinated signaling system, and powerful adaptability against physical and biotic stresses. All of these characteristics distinguish trees from annual herbaceous plants. The genome sequences of Populus trichocarpa (Torr. & Gray) was published in 2006, and from then on, Populus has been selected as a model tree system for genetic research (Taylor, 2002; Tuskan et al., 2006; Zhang et al., 2015). Populus species have been used as heavy metal phytoremediation plants as they are adaptable to grow on contaminated areas and able to accumulate metals than short-lived plants (Di Loardo et al., 2011). Populus simonii × Populus nigra is a hybrid poplar that is widely planted in northern China, and is widely used for afforestation and commercial forestry (Chen et al., 2012). To analyze copper homeostasis in woody plants, we investigated the copper chaperone genes in Populus.
In this study, to identify the CCH gene family members of P. trichocarpa, we conducted a genome-wide analysis using bioinformatics method. 21 PtCCH genes were obtained, and the multiple alignments of the deduced amino acid sequences indicated that all of them had the metal-binding motif and the typical secondary structure at the N-terminal. PtCCHs belonged to the same subgroup often had the similar gene structures and motifs. The results of quantitative real-time RT-PCR (qRT-PCR) showed that the expression of the CCH genes in P. simonii × P. nigra could be induced or suppressed by deficiency or excessive copper conditions. We also found that the CCH genes of Populus had tissue-specific expression profiles. Our results may provide insights into the roles of CCH proteins of Populus in copper homeostasis.
Materials and Methods
Identification of CCH family genes in P. trichocarpa
To identify CCH proteins in P. trichocarpa, the protein database of Populus was downloaded from https://phytozome.jgi.doe.gov/pz/portal.html (Goodstein et al., 2012), and Hidden Markov Model (HMM) profile file (HMA.hmm) of the Heavy-metal-associated domain (HMA) (PF00403) was downloaded from the Pfam database (http://pfam.xfam.org/). The HMA.hmm file was exploited as a query to identify PtCCHs in the poplar protein database using the hmmer search command of the HMMER (v 3.0) software. On the other hand, A. thaliana AtCCH (AT3G56240) was used as the query sequence in a BlastP search against the P. trichocarpa genome database online. The relative parameters were as follows: target type = Proteome, Program = BLASTP-protein query to protein db, Expect (E) threshold = −5; the other parameters were the default. The sequences obtained by the above two methods were used for the subsequent selection, and the screening criteria was whether the protein had one conserved MXCXXC (M is methionine, X is any amino acid, C is cysteine) site (Arnold et al., 2006; Kiefer et al., 2009; Guex, Peitsch & Schwede, 2009; Biasini et al., 2014) and formed one βαββαβ structure in the N-terminal (SWISS-MODEL (http://swissmodel.expasy.org/) was used to construct the secondary structure), as well as the extended segment in the C-terminal. As AtCCH is a small cytoplasmic protein and has no identified functional domains in its C-terminal, we deleted the proteins with long C-terminal sequences which might influence the function of the metal binding domain in the N-terminal when formed the tertiary structures, as well as the proteins had the domains in their C-terminal if the functions of the domains have been identified. After eliminating those did not meet these criteria, the 21 remainders were identified as PtCCHs and the amino acid sequences were analyzed for the characteristics using online ExPASy programs (http://www.expasy.org/), such as molecular weight, isoelectric point, number of amino acids, aliphatic index, and grand average of hydropathicity (GRAVY) score (Brunner, Busov & Strauss, 2004; Gasteiger et al., 2005).
Exon/intron structure and conserved motifs analysis
The distribution patterns of exons and introns in the PtCCH genes were predicted using the Gene Structure Display Server (GSDS2.0, http://gsds.cbi.pku.edu.cn) (Hu et al., 2015), and the online MEME tool (Multiple Em for Motif Elicitation, version 4.11.3, http://meme-suite.org/tools/meme) (Bailey et al., 2009) was used to identify conserved motifs in the PtCCHs. The setting parameters were as follows: maximum number of different motifs to find = 10, minimum width = 7, maximum width = 50.
Multiple sequence alignment and phylogenetic analysis
The PtCCH amino acid sequences were aligned using the Clustal X program (Thompson et al., 1997) and the conserved sites of MXCXXC were checked (Himelblau et al., 1998; Puig et al., 2007a). MEGA5.0 software (Tamura et al., 2011) was used to construct phylogenetic trees by the Neighbor-Joining (NJ) method (No of bootstrap replications were 1,000) with the full predicted CCH amino acid sequences of P. trichocarpa, A. thaliana, and O. sativa. AtCCHs and OsCCHs were identified using the same method and the same criteria as in P. trichocarpa, and the sequences of AtCCHs and OsCCHs were retrieved from their genome databases (Goodstein et al., 2012).
Mapping PtCCH genes on Populus chromosomes and subcellular locations of PtCCHs
The location information of PtCCH genes were retrieved from Phytozome and PopGenIE (http://popgenie.org/chromosome-diagram), and then the chromosomal location maps were constructed (Sjödin et al., 2009). The positions of whole-genome duplication blocks of different chromosomes were defined according to the study of Tuskan et al. (2006). The subcellular locations of PtCCH proteins were predicted using the online WoLF PSORT tool (http://www.genscript.com/psort/wolf_psort.html) (Horton et al., 2007), and the option of organism type was plant.
Identification of tissue-specific expression patterns of PtCCH genes
The tissue-specific expression data of PtCCH genes in mature leaves, young leaves, roots, nodes, and internodes were derived from PopGenIE (http://popgenie.org) (Sundell et al., 2015), and used to generate visual images.
Plant materials, growth conditions, and copper stress treatments
P. simonii × P. nigra were grown at Northeast Forestry University Forest Farm, Harbin, China. Cuttings of P. simonii × P. nigra were cultivated in pots containing sterile mixture of turfy soil, vermiculite, and perlite (3:2:1) in the greenhouse under long-day conditions (16 h light/8 h dark) at 25 °C, and supplied with water every 3 days. The seedlings were cut when they were 10 cm tall and then rooted in water that was aerated constantly by aquarium pumps. After rooting, the plantlets were transferred into sterile vermiculite and supplied every 2 days with half-strength modified Hoagland (Assunção et al., 2003) nutrient solution composition of: 3 mM KNO3, 2 mM Ca(NO3)2 ⋅ 4H2O, 1 mM NH4 H2PO4, 0.5 mM MgSO4 ⋅ 7H2O, 25 µM KCl, 12.5 µM H3BO3, 1 µM MnSO4 ⋅ H2O, 1 µM ZnSO4 ⋅ H2O, 0.247 µM Na2MoO4, 10 µM NaFeDTPA (Fe), and 0.5 µM CuSO4 ⋅ 5H2O; the pH was fixed at 5 with KOH. After 2 weeks, seedlings were treated as follows: To test the expression profiles response to copper stress, seedlings were transferred into half-strength modified Hoagland nutrient solution that contained 0, 0.5 (control), or 10 µM Cu applied as CuSO4 ⋅ 5H 2O. Plants were treated at different times in the day, and were maintained in these conditions for 3, 12, or 72 h, then roots, stems, young leaves (LPI 0–2), and mature leaves (LPI 7–9) (Larson & Isebrands, 1971) were harvested at the same time, 10 o’clock. To determine the tissue-specific expression patterns, the plant materials were collected directly without treatment at 10 o’clock as described above. The samples were frozen in liquid nitrogen and stored at −80 °C for further analysis. To obtain reproducible results, three biological replicates of each stress treatment were conducted, and each experiment was repeated three times with independent samples.
RNA extraction and qRT-PCR analysis
Total RNA was extracted from leaves, stems, and roots using pBIOZOL Plant Total RNA Extraction Reagent (BioFlux, Hangzhou, China) according to the protocol. After removing genomic DNA, first-strand of cDNA was obtained using a PrimeScript™ RT reagent Kit (Takara Bio, Dalian, China). qRT-PCR was performed using UltraSYBR Mixture (Low ROX) (CWBIO, Beijing, China) with three replicates on an ABI 7500 Real Time PCR System (Applied Biosystems, Foster City, CA, USA). Amplifications were conducted in 20 µL reaction mixtures containing 10.0 µL 2 × UltraSYBR Mixture (with ROX), 4.0 ng cDNA template, and 0.2 µM of forward and reverse primers. The primers used for qRT-PCR were designed with Primer Premier 5.0 (Premier Biosoft, Palo Alto, CA, USA) according to PtCCH gene sequences (Table S1), and the annealing temperature was between 46 °C and 60 °C. The PtUBQ7 (XM_002306689.2) and PtCDC2 (XM_002305968.2) genes of P. trichocarpa were used as reference genes (Pettengill, Parmentier-Line & Coleman, 2012; Pettengill, Pettengill & Coleman, 2013), and the expression levels of them were stable, so we selected PtUBQ7 (XM_002306689.2) gene as reference gene to analyze the expression relative changes of PtCCH genes. The amplification conditions were as follows: denaturation at 95 °C for 10 min, 45 cycles of denaturation at 95 °C for 15 s, annealing between 60 °C and 68 °C for 60 s.
The 2−ΔΔCT method was used to analyze the expression levels of PnCCHs in different tissues under control copper condition (0.5 µM CuSO4) or copper stress conditions (0 µM CuSO4 and 10 µM CuSO4) (Livak & Schmittgen, 2001; Schmittgen & Livak, 2008). The statistical significant differences of the tissue-specific expression profiles of PnCCHs were analyzed using duncan’s test (P < 0.05). The values of log2 (sample/control) copper stress conditions and different treated times were calculated as the relative expression levels of every PnCCH genes, and the different color of the cells in the heatmaps indicated the expression level of the treated samples went up or down compared with their controls. The statistical significant differences of the expression levels were analyzed using t test (P < 0.05). All the values under copper stress conditions were compared with the corresponding values under control copper condition. Results are the mean ± SD of three replicates.
Results
Identification and sequence conservation of CCH genes in P. trichocarpa
A total of 21 PtCCH genes (named PtCCH1–21) were identified in the P. trichocarpa genome according to their encoded proteins that contained the conserved domains and typical secondary structures like the AtCCH of A. thaliana. The 21 PtCCH genes were analyzed and the parameters, including locus name, chromosome location, protein length, molecular weight, isoelectric point, aliphatic index, and grand average of hydropathicity (GRAVY) score, are listed in Table 1. The putative PtCCH protein sequences varied from 115 to 179 amino acids (aa) in length, the isoelectric points ranged from 4.96 to 9.64, and all of them were hydrophilic because of the GRAVY values were negative. The 21 PtCCH amino acid sequences shared 23–100% identities (Table S2), and the proteins were predicted to be localized in cytosol, chloroplast, or mitochondria.
| Gene name | Locus name Phytozome v3.0 | Amino acid no. | Molecular weight (Da) | Isoelectric points | Aliphatic index | GRAVY | Chromosome location | Cellular localization |
|---|---|---|---|---|---|---|---|---|
| PtCCH1 | Potri.001G452400.1 | 179 | 20,864.8 | 9.01 | 66.93 | −0.55 | ChrI:48764846..48766902 | Cytosol |
| PtCCH2 | Potri.001G468500.1 | 115 | 12,727.9 | 8.85 | 86.43 | −0.397 | ChrI:50097242..50098160 | Cytosol |
| PtCCH3 | Potri.002G092200.1 | 150 | 16,758.5 | 9.64 | 72 | −0.48 | ChrII:6570956..6572016 | Chloroplast |
| PtCCH4 | Potri.004G056800.1 | 146 | 17,269.3 | 4.96 | 57.47 | −0.864 | ChrIV:4523350..4524675 | Mitochondria |
| PtCCH5 | Potri.005G003700.1 | 150 | 16,782.6 | 9.33 | 82.4 | −0.254 | ChrV:226035..226652 | Chloroplast |
| PtCCH6 | Potri.005G079800.1 | 153 | 16,953.4 | 9.48 | 72.48 | −0.59 | ChrV:5867660..5868994 | Chloroplast |
| PtCCH7 | Potri.005G110400.1 | 157 | 17,554.1 | 6.31 | 75.61 | −0.455 | ChrV:8497273..8498140 | Chloroplast |
| PtCCH8 | Potri.005G167000.1 | 150 | 16,647.3 | 9.44 | 70.73 | −0.447 | ChrV:17596661..17597639 | Chloroplast |
| PtCCH9 | Potri.005G169700.1 | 150 | 16,647.3 | 9.44 | 70.73 | −0.447 | ChrV:18274591..18275572 | Chloroplast |
| PtCCH10 | Potri.006G006100.4 | 163 | 18,702.2 | 5.28 | 69.26 | −0.817 | ChrVI:415310..419144 | Chloroplast |
| PtCCH11 | Potri.006G006100.5 | 136 | 15,360.5 | 6.27 | 60.88 | −1.307 | ChrVI:416730..419039 | Chloroplast |
| PtCCH12 | Potri.006G024800.2 | 150 | 17,735 | 6.51 | 62.93 | −0.597 | ChrVI:1722458..1723578 | Cytosol |
| PtCCH13 | Potri.007G087300.1 | 151 | 16,667.1 | 9.47 | 70.93 | −0.514 | ChrVII:11343882..11345554 | Chloroplast |
| PtCCH14 | Potri.010G015300.1 | 137 | 15,673.2 | 9.16 | 66.86 | −0.678 | ChrX:1921667..1922272 | Cytosol |
| PtCCH15 | Potri.010G114600.1 | 150 | 16,820.3 | 9.63 | 66.2 | −0.605 | ChrX:13289528..13291583 | Chloroplast |
| PtCCH16 | Potri.010G114600.2 | 130 | 14,482.6 | 9.41 | 60.62 | −0.498 | ChrX:13289596..13291583 | Chloroplast |
| PtCCH17 | Potri.011G065600.1 | 147 | 17,353.5 | 7.05 | 49.12 | −0.94 | ChrXI:6016497..6017737 | Mitochondria |
| PtCCH18 | Potri.011G065600.2 | 142 | 16,777.9 | 7.74 | 48.1 | −0.984 | ChrXI:6016577..6017733 | Mitochondria |
| PtCCH19 | Potri.011G149500.1 | 178 | 20,665.6 | 9.03 | 72.81 | −0.477 | ChrXI:16795622..16798712 | Cytosol |
| PtCCH20 | Potri.017G123400.1 | 146 | 16,363.8 | 9.49 | 77.26 | −0.311 | ChrXVII:13590414..13592054 | Cytosol |
| PtCCH21 | Potri.019G106500.1 | 140 | 16,071.8 | 7.23 | 54.93 | −0.924 | ChrXIX:13509997..13510615 | Chloroplast |
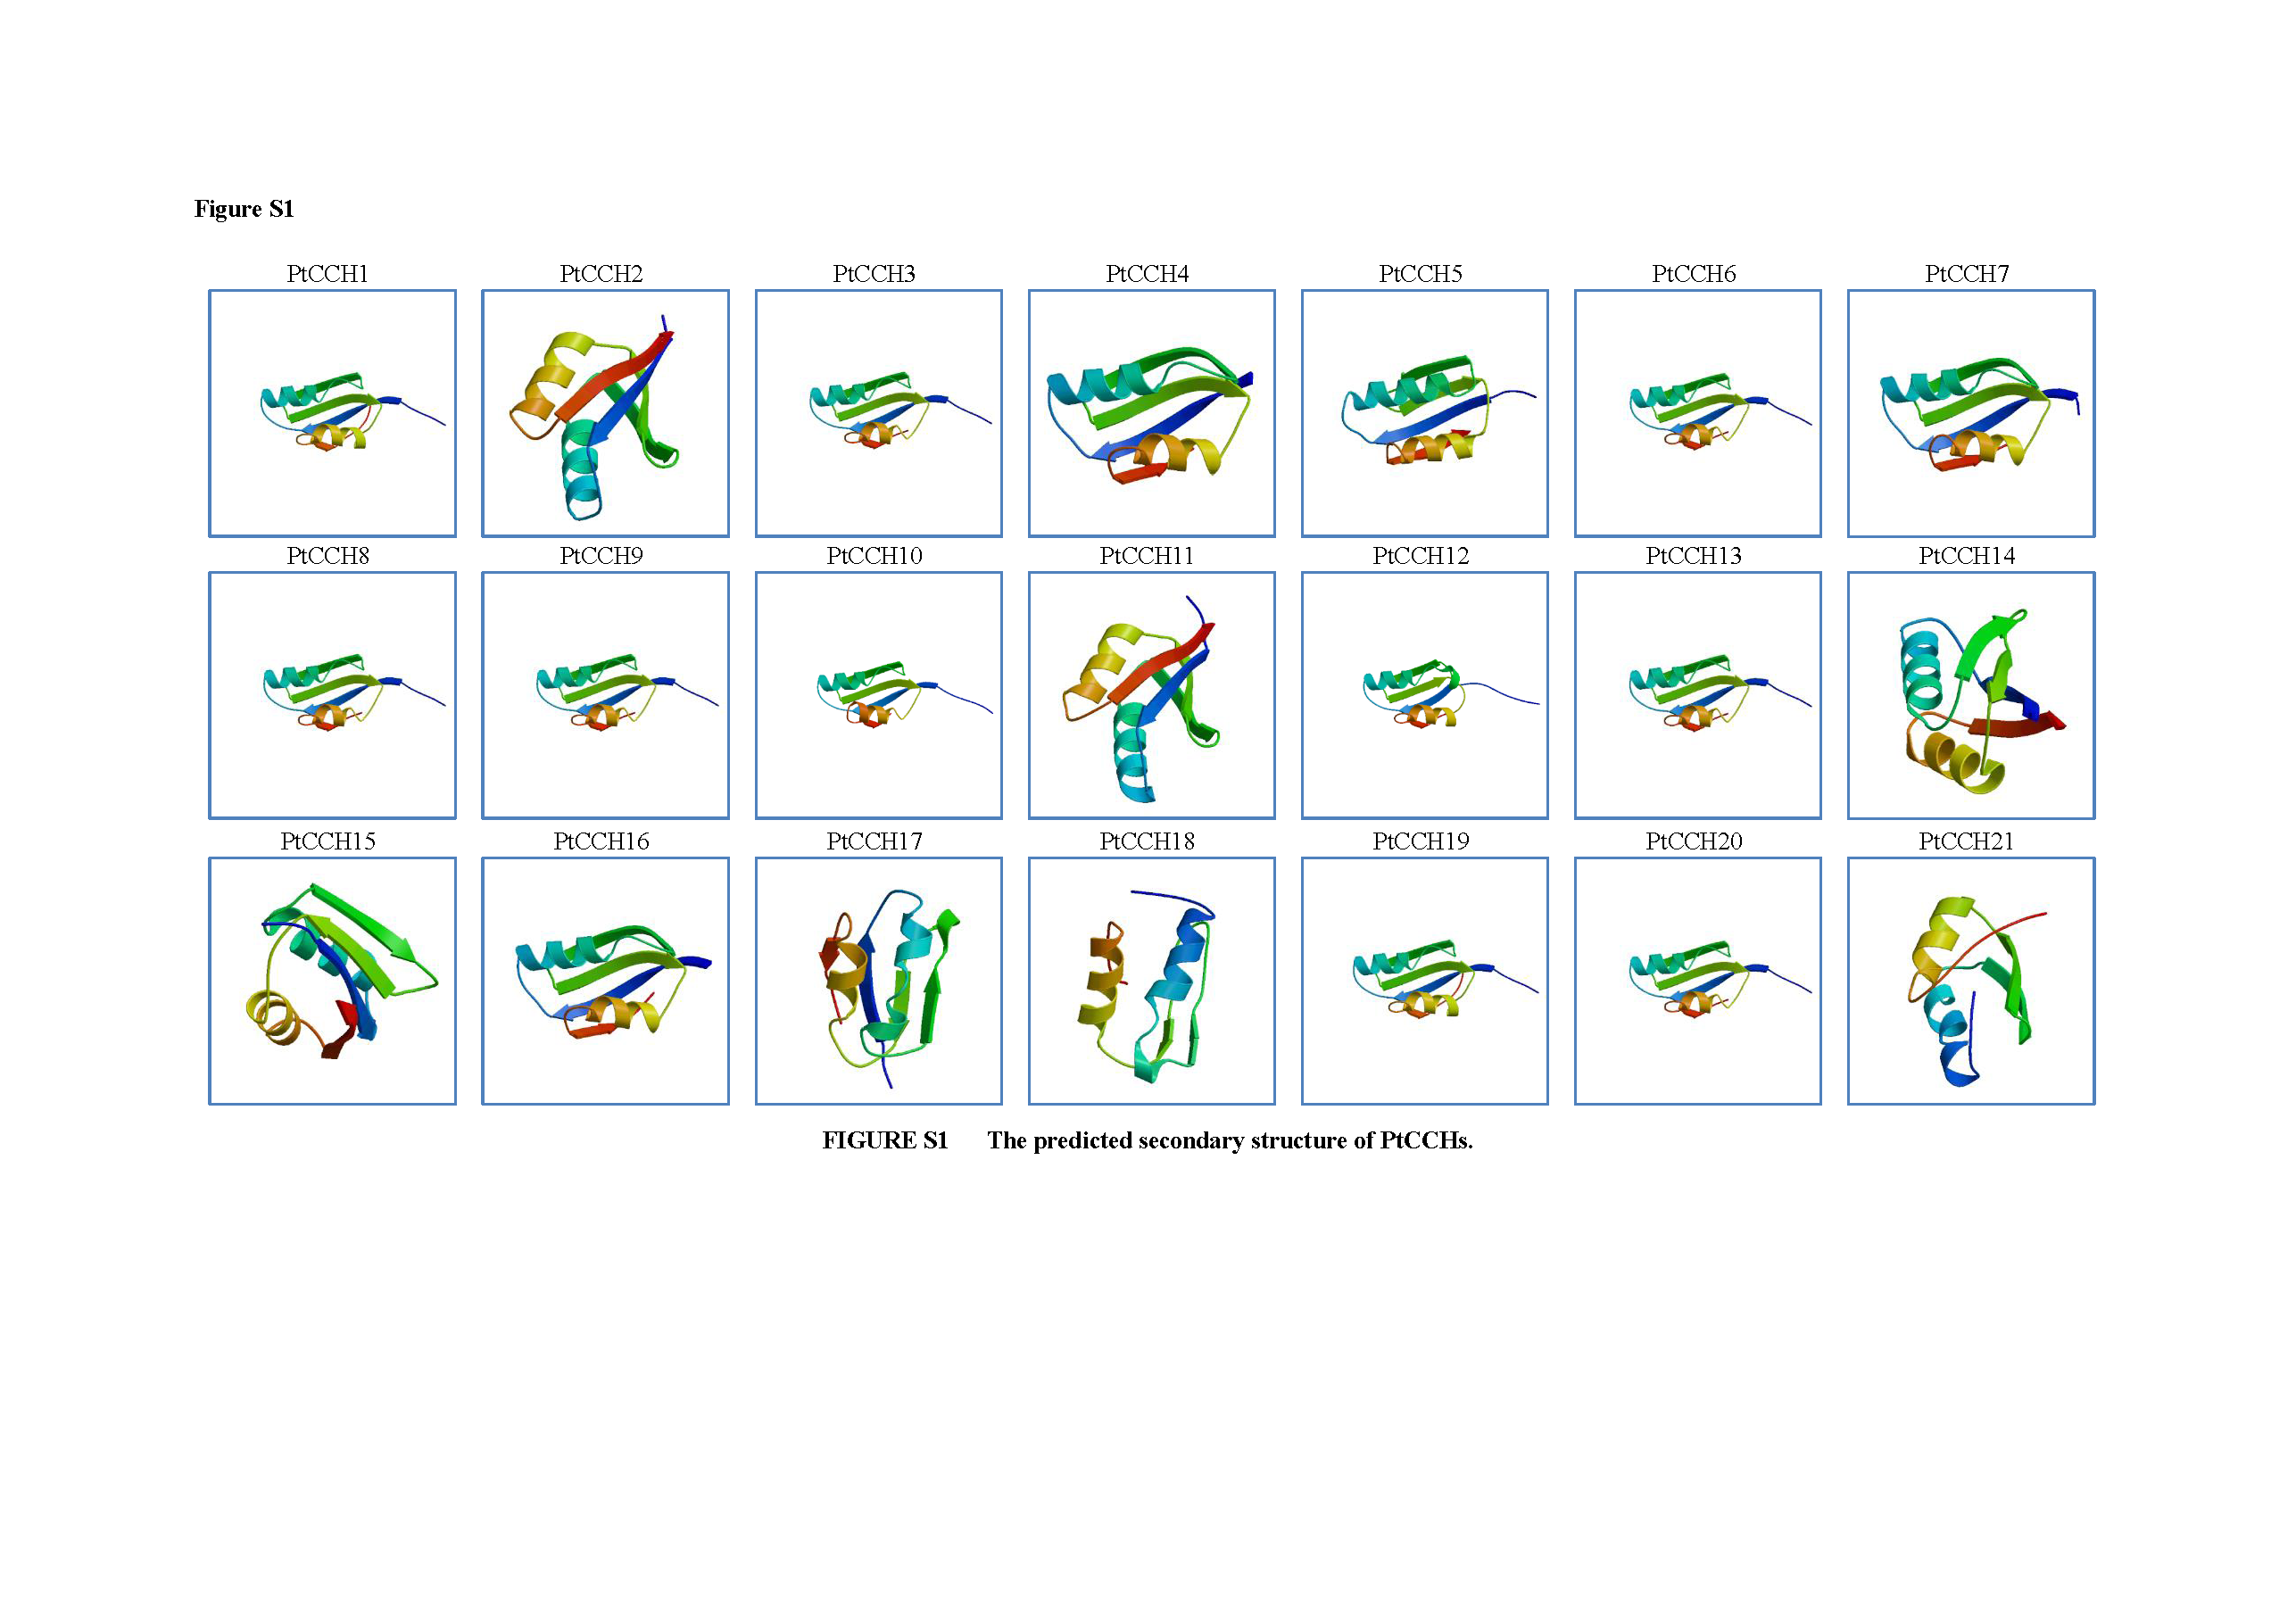
The multiple sequence alignment was conducted to examine the conserved domains of the PtCCHs, and the result showed that all the PtCCH proteins shared the consensus metal-binding motif MXCXXC in the N-terminal, and some PtCCHs had a lysine-rich (Lys, K) region (Fig. 1) (Lin & Culotta, 1995; Agrawal et al., 2002; Lee et al., 2005). These two structure characteristics are involved in the function of copper chaperones (Rosenzweig et al., 1999; Mira et al., 2001b). The secondary structure prediction indicated that all the PtCCHs possessed, at their N-terminal, the conserved βαββαβ-fold structure that is present in the ATX1-like family of metallochaperones (Fig. S1).
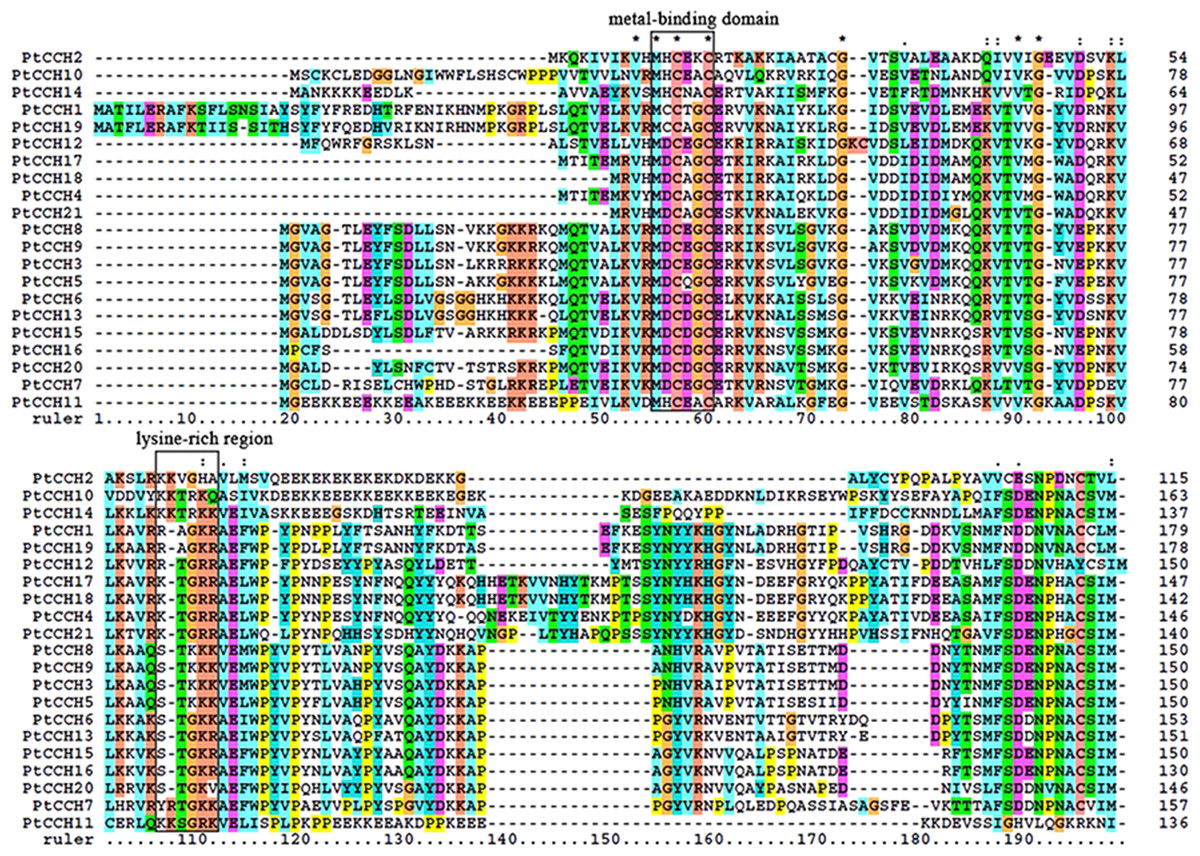
Figure 1: Multiple alignment of the deduced amino acid sequences of the 21 PtCCHs.
The boxes indicate the conserved MXCXXC (M is methionine, X is any amino acid, and C is cysteine) metal-binding site and lysine-rich region. Asterisks indicate the identical amino acids, and dashes indicate gaps introduced to optimize the alignment. The alignment was performed using the Clustal X software.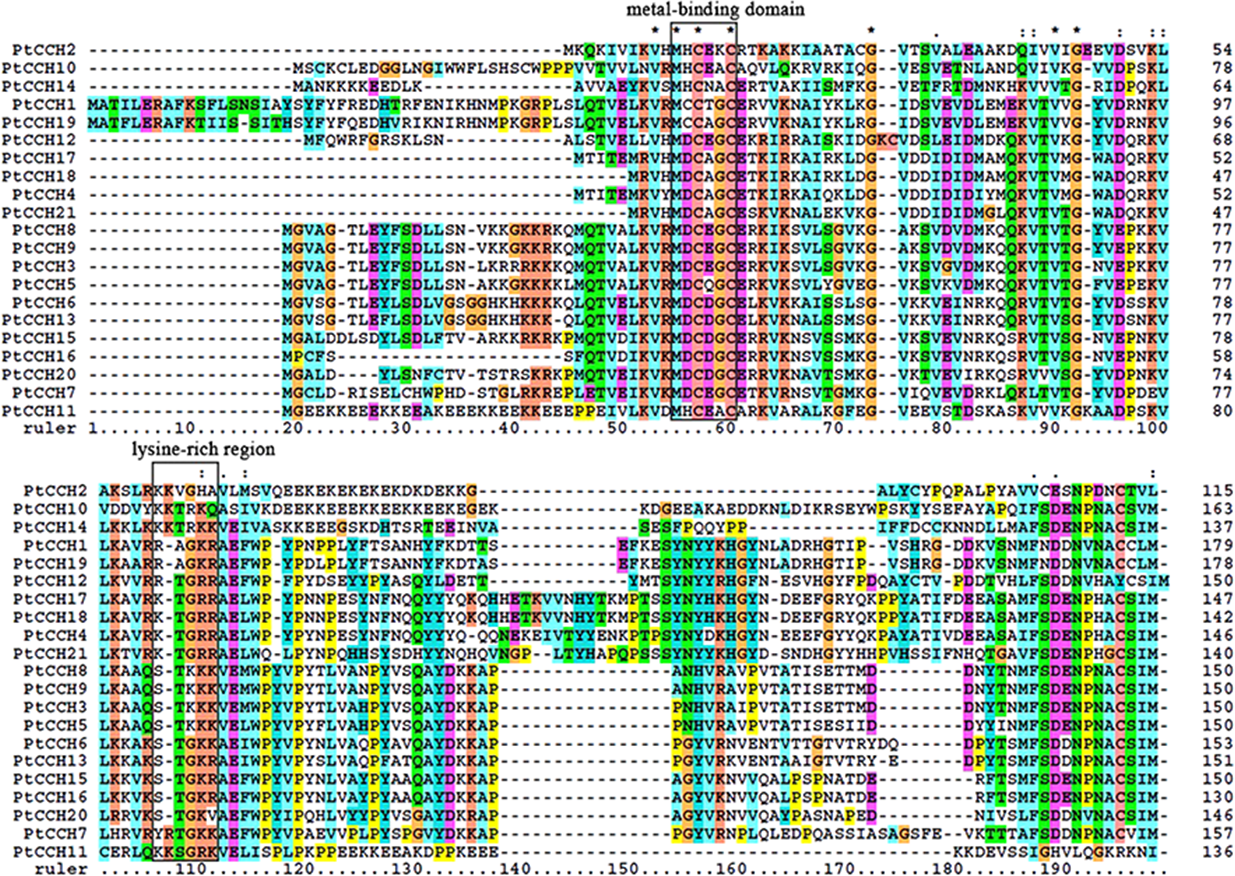
Chromosomal location and duplication of PtCCHs in P. trichocarpa
To study the gene distribution and duplication in the P. trichocarpa genome, we mapped all of the identified PtCCH genes to their corresponding chromosomes. The 21 PtCCH genes were found to be physically located on 10 of the 19 Populus chromosomes (none on chromosomes III, VIII, IX, XII, XIII, XIV, XV, XVI, and XVIII) (Fig. 2). The distribution of the PtCCH genes on each chromosome was obviously heterogeneous: ChrV harbored the highest number (5) of PtCCH genes; ChrI harbored two PtCCH genes (PtCCH1 and PtCCH2); ChrVI, ChrX, and ChrXI harbored three PtCCH genes each; while only a single PtCCH gene was found on ChrII, ChrIV, ChrVII, ChrXVII, and ChrXIX.
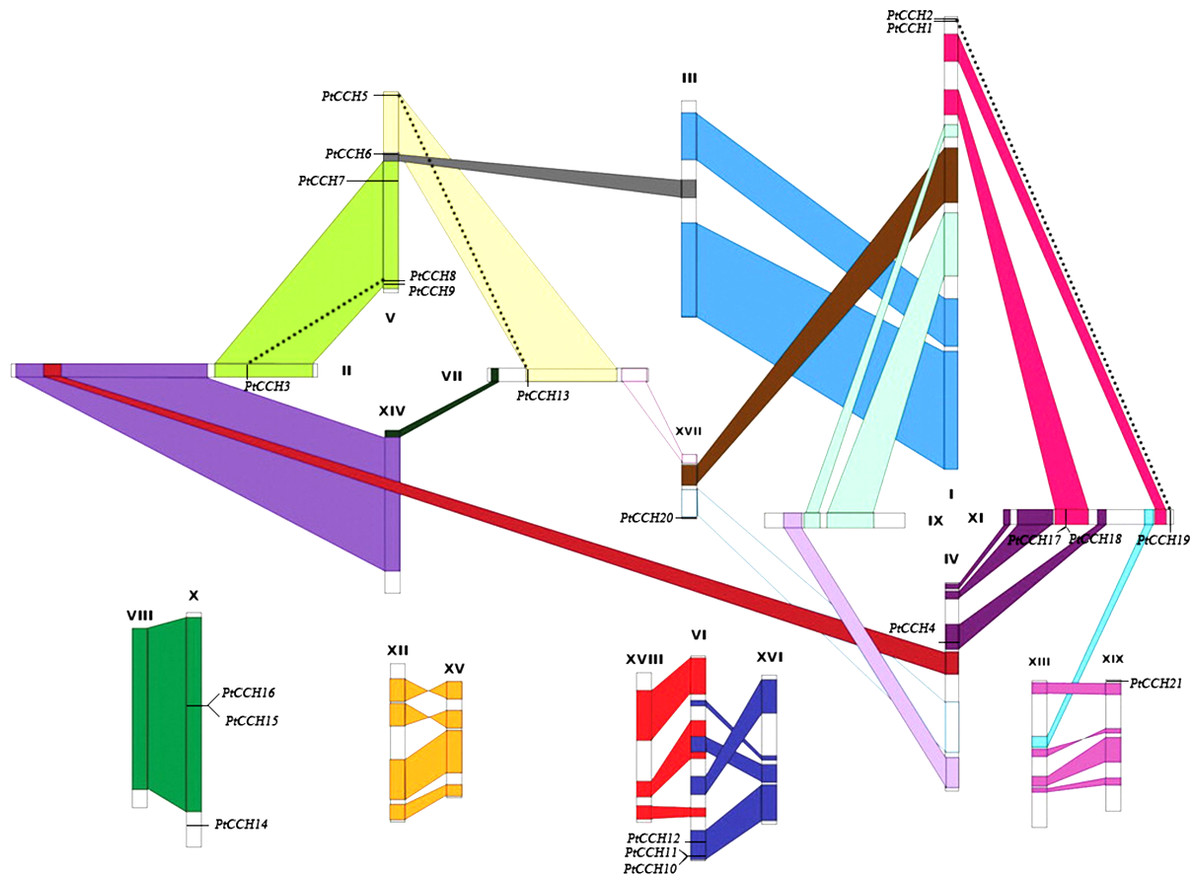
Figure 2: Chromosomal locations of the 21 PtCCH genes in the P. trichocarpa genome.
The schematic diagram of chromosome recombination was constructed using the data from the whole-genome duplication study of Tuskan et al. (2006). Common colors refer to homologous genome blocks which are presumed to have arisen from the salicoid-specific genome duplication shared by two chromosomes. Paralogous CCH genes are indicated by dashed lines.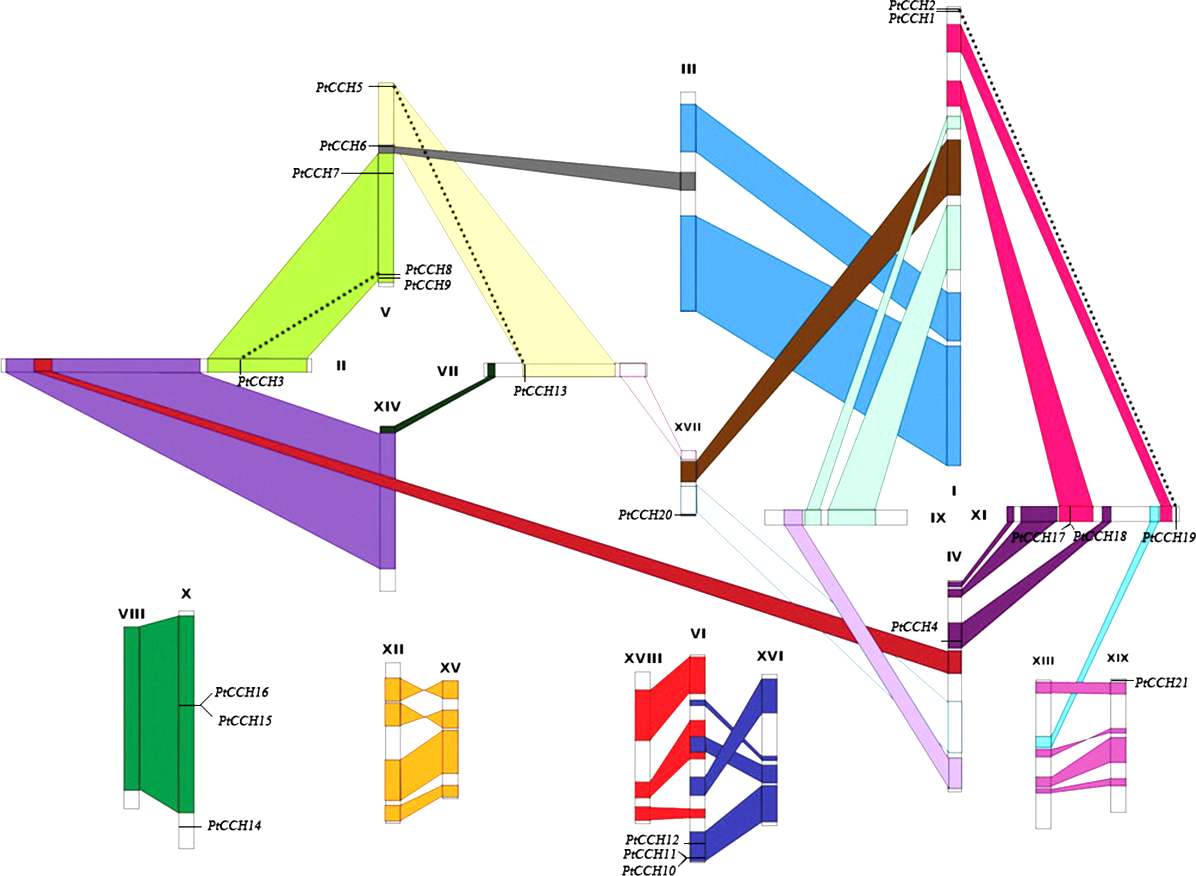
According to the study of Tuskan et al. (2006), a whole-genome duplication (WGD) event occurred 60–65 million years ago in the Salicaceae family (salicoid duplication), and this created the identified paralogous segments in the Populus genome. Except for six genes (PtCCH1, 2, 14, 19, 20, 21), fifteen PtCCH genes were located in duplicate blocks (Fig. 2). Five pairs of genes (PtCCH1/2, PtCCH8/9, PtCH10/11, PtCCH15/16, and PtCCH17/18) were arranged in tandem repeats on ChrI, ChrV, ChrVI, ChrX, and ChrXI, respectively.
Phylogenetic analysis of the PtCCH gene family
We constructed a phylogenetic tree to analyze the evolutionary relationships of the PtCCH genes and to classify the PtCCHs in P. trichocarpa. Twenty-one full-length PtCCH sequences were used to generate an unrooted phylogenetic tree (Fig. 3A). The 21 sequences clustered into three distinct subgroups: SI, SII, and SIII. The SI subgroup contained PtCCH3, 5, 6, 7, 8, 9, 13, 15, 16, and 20; the SII subgroup contained PtCCH1, 4, 12, 17, 18, 19, and 21; and the SIII subgroup contained the remaining four PtCCHs.

Figure 3: Phylogenetic tree and structure analysis of the 21 PtCCH genes.
(A), Phylogenetic tree based on the deduced full-length amino acid sequences of the PtCCHs constructed by the Neighbor-Joining (NJ) method. (B), Structure of the corresponding PtCCH genes. Yellow indicates CDSs, blue indicates upstream/downstream sequences, and black line indicates introns. (C), Predicted motifs in the PtCCH amino acid sequences predicted using the online MEME tool. The sequences of the motifs are listed in Table S4.
To analyze the relationships of the PtCCHs to CCHs in other species, we constructed a phylogenetic tree using full-length amino acid sequences of the 21 P. trichocarpa CCHs, 13 A. thaliana CCHs (AtCCH6 was the AtCCH which has been functionally characterized and used as the query sequence to screen the CCH genes), and 12 Oryza sativa CCHs (Table S3). All these CCH sequences clustered into three groups: SI, SII, and SIII. The SI and SII groups contained 22 and 16 members, respectively, and the SIII group had eight members (Fig. 4). The SI group had four subgroups, SI–1, SI–2, SI–3, and SI–4; the SII group had two subgroups, SII–1 and SII–2; and the SIII group had three subgroups, SIII–1, SIII–2, and SIII–3. Among the three species, CCHs that had the same and similar number of motifs clustered into the same clade. The phylogenetic analysis showed, noticeably, subgroup SI–3 contained only PtCCHs, and subgroup SIII–1 contained AtCCH and OsCCH but no PtCCH. Otherwise, the CCH proteins encoded by paralogous pairs of PtCCH genes clustered together in the same subgroups; for instance, PtCCH3 and PtCCH8/9 were assigned to SI-3, and PtCCH1 and PtCCH19 were assigned to SII–1. Also, the products of the tandem duplication pairs, PtCCH8/9 and PtCCH17/18, were assigned to SI–3 and SII–2, respectively.
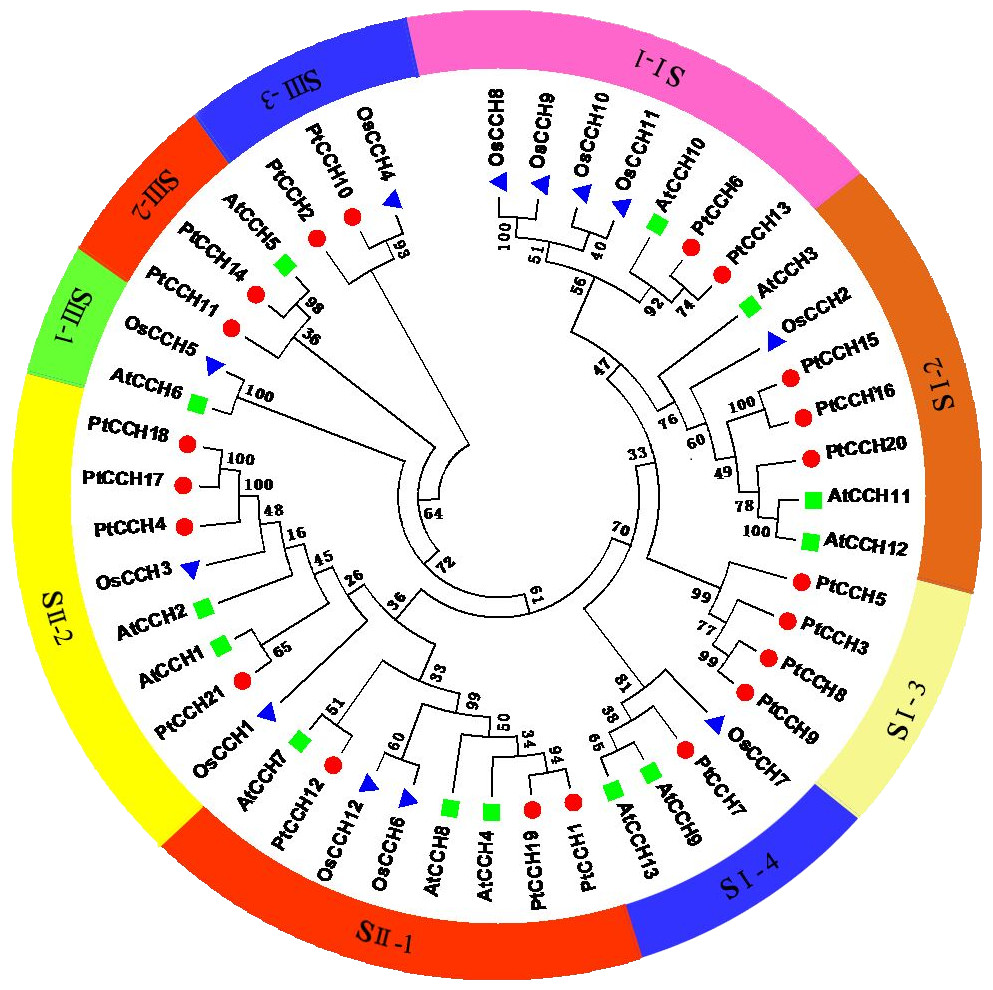
Figure 4: Phylogenetic analysis of CCH proteins from P. trichocarpa, A. thaliana, and O. sativa.
The deduced full length amino acid sequences were used to generate the phylogenetic tree by the Neighbor-Joining (NJ) method. Red dots indicate P. trichocarpa CCHs, green squares indicate A. thaliana CCHs, and blue triangles indicate O. sativa CCHs.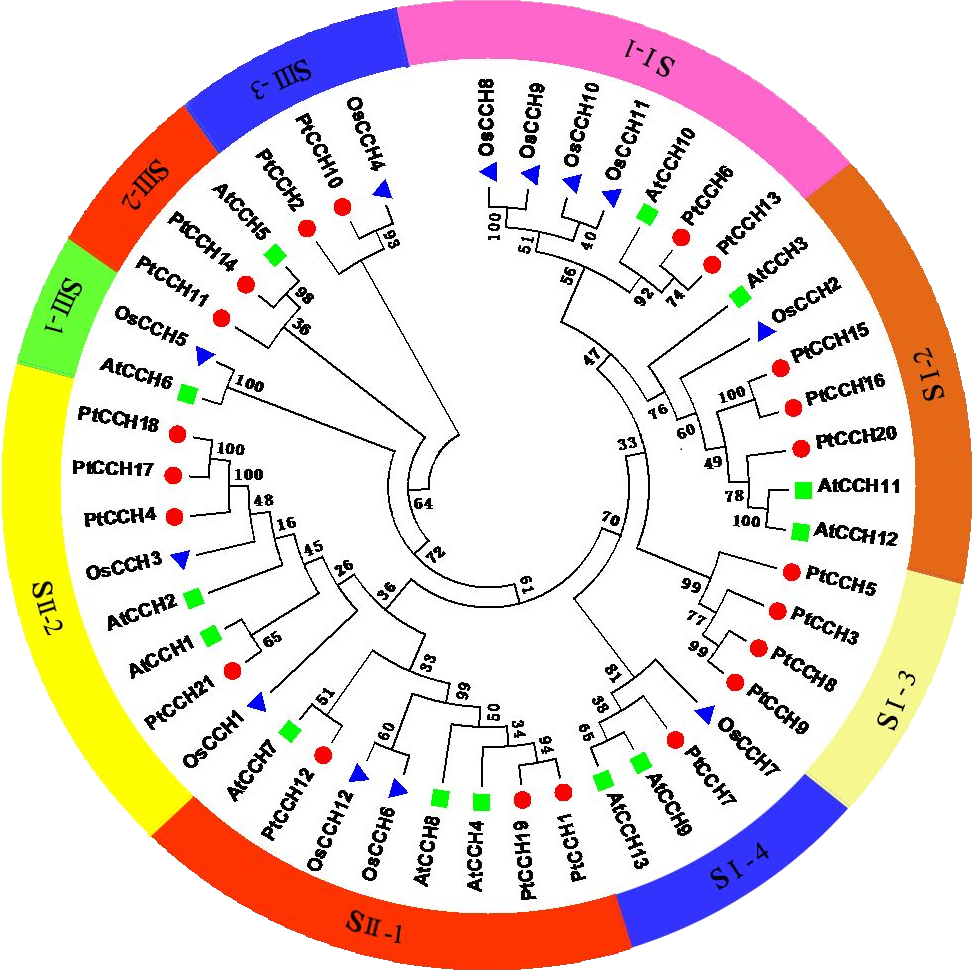
Analyses of gene structure and conserved motif distribution
To gain further insight into the possible relationships among different gene family members, the exon/intron organization of the PtCCH genes was compared in the context of the phylogenetic tree (Fig. 3B). The relative lengths of the introns and exons were provided detailed, and revealed a highly-conserved distribution of intron regions (from one to two in numbers) among the PtCCH genes, which is similar to the distribution of intron regions among Arabidopsis CCH genes (one to two introns) and O. sativa CCH genes (null to three introns). Fifteen of the 21 PtCCH genes had only one intron, and the other six had two introns. Notably, closely related genes generally had similar exon/intron structures, although the lengths of the introns and exons varied. There were some exceptions when compared with the other members of the same subgroup; for example, PtCCH15, PtCCH16, and PtCCH20 in SI, PtCCH1 and PtCCH19 in SII, and PtCCH14 in SIII. These results imply a tight relationship between the phylogeny and gene structure of the PtCCHs, and the regularity of the gene structure might be related to the evolutionary trends and the conservation of the gene family members.
Ten motifs (named motif 1–10) were predicted in the PtCCH sequences using MEME software (Table S4). As shown in Fig. 3C, the PtCCH proteins in the same subgroup generally contained similar motifs. Motif 3, which was present in all the PtCCHs, contains the MXCXXC site which is essential for copper binding. Most members of the PtCCH family shared three motifs, motif 3, motif 1, and motif 2, which were linked in the same order. A few proteins, such as PtCCH2 and PtCCH11, showed quite different protein structures compared with the others. In SI, except PtCCH7 and PtCCH16 without motif 6, all the other PtCCHs showed the same motif distribution and arrangement. Motif 5 appeared only in the SI subgroup. In SII, except PtCCH12 without motif 7, the other motifs in PtCCH4, 12, 17, 18, and 21 were the same. Interestingly, motif 10 was selectively distributed among a specific pair, PtCCH1 and PtCCH19, which had the same motif types and arrangements. The PtCCHs in subgroup SIII had few motifs (one to three) compared with the PtCCHs in the SI and SII subgroups. Overall, the PtCCHs in specific subgroups appear to have evolved conserved and diverged motifs during evolution.
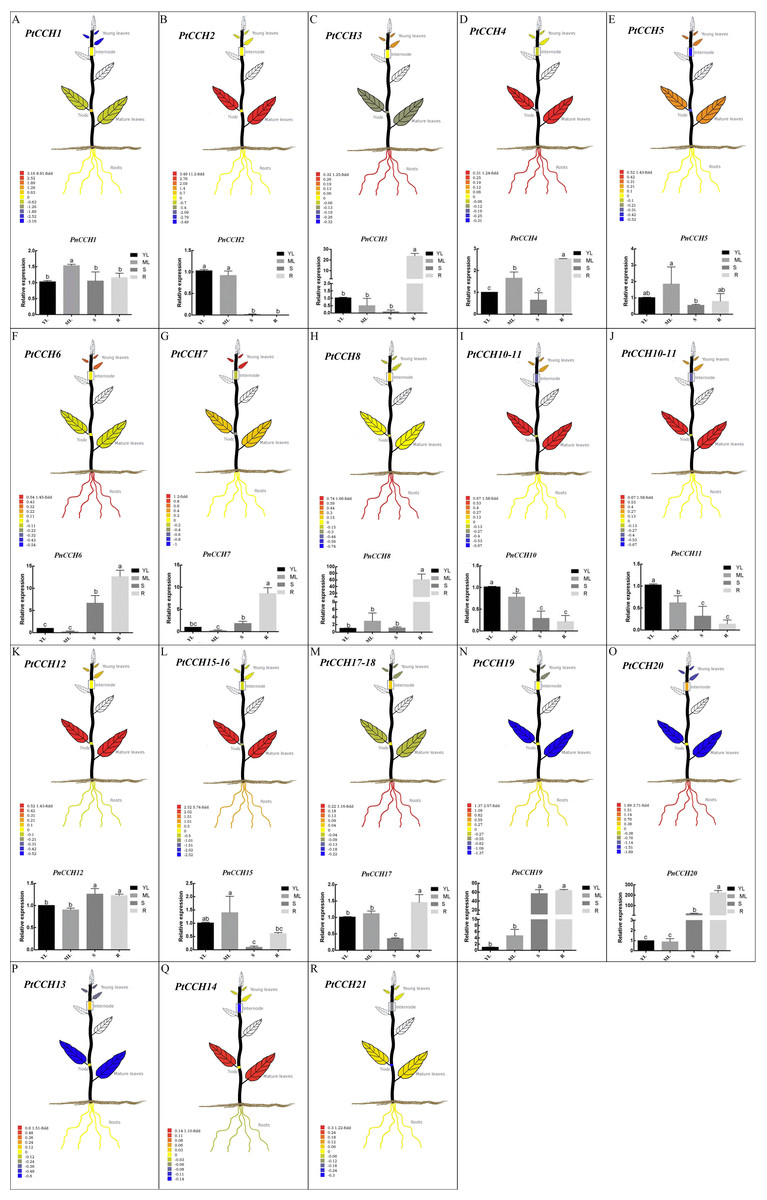
Figure 5: Tissue-specific expression profiles of PtCCH and PnCCH genes.
The visual images of PtCCH genes in P. trichocarpa were generated using the tissue-specific expression data of mature leaves, young leaves, roots, nodes, and internodes derived from http://PlantGenIE.org (Sundell et al., 2015). The bar graphs of PnCCH genes in P. simonii × P. nigra were generated by qRT-PCR. Expression values of young leaves (YL), mature leaves (ML), stems (S), and roots (R) were normalized to the relative levels of PnUBQ7. Data represent mean values of three replicates, error bars represent SE, and different letters represent statistical significant differences (P < 0.05) using duncan’s test.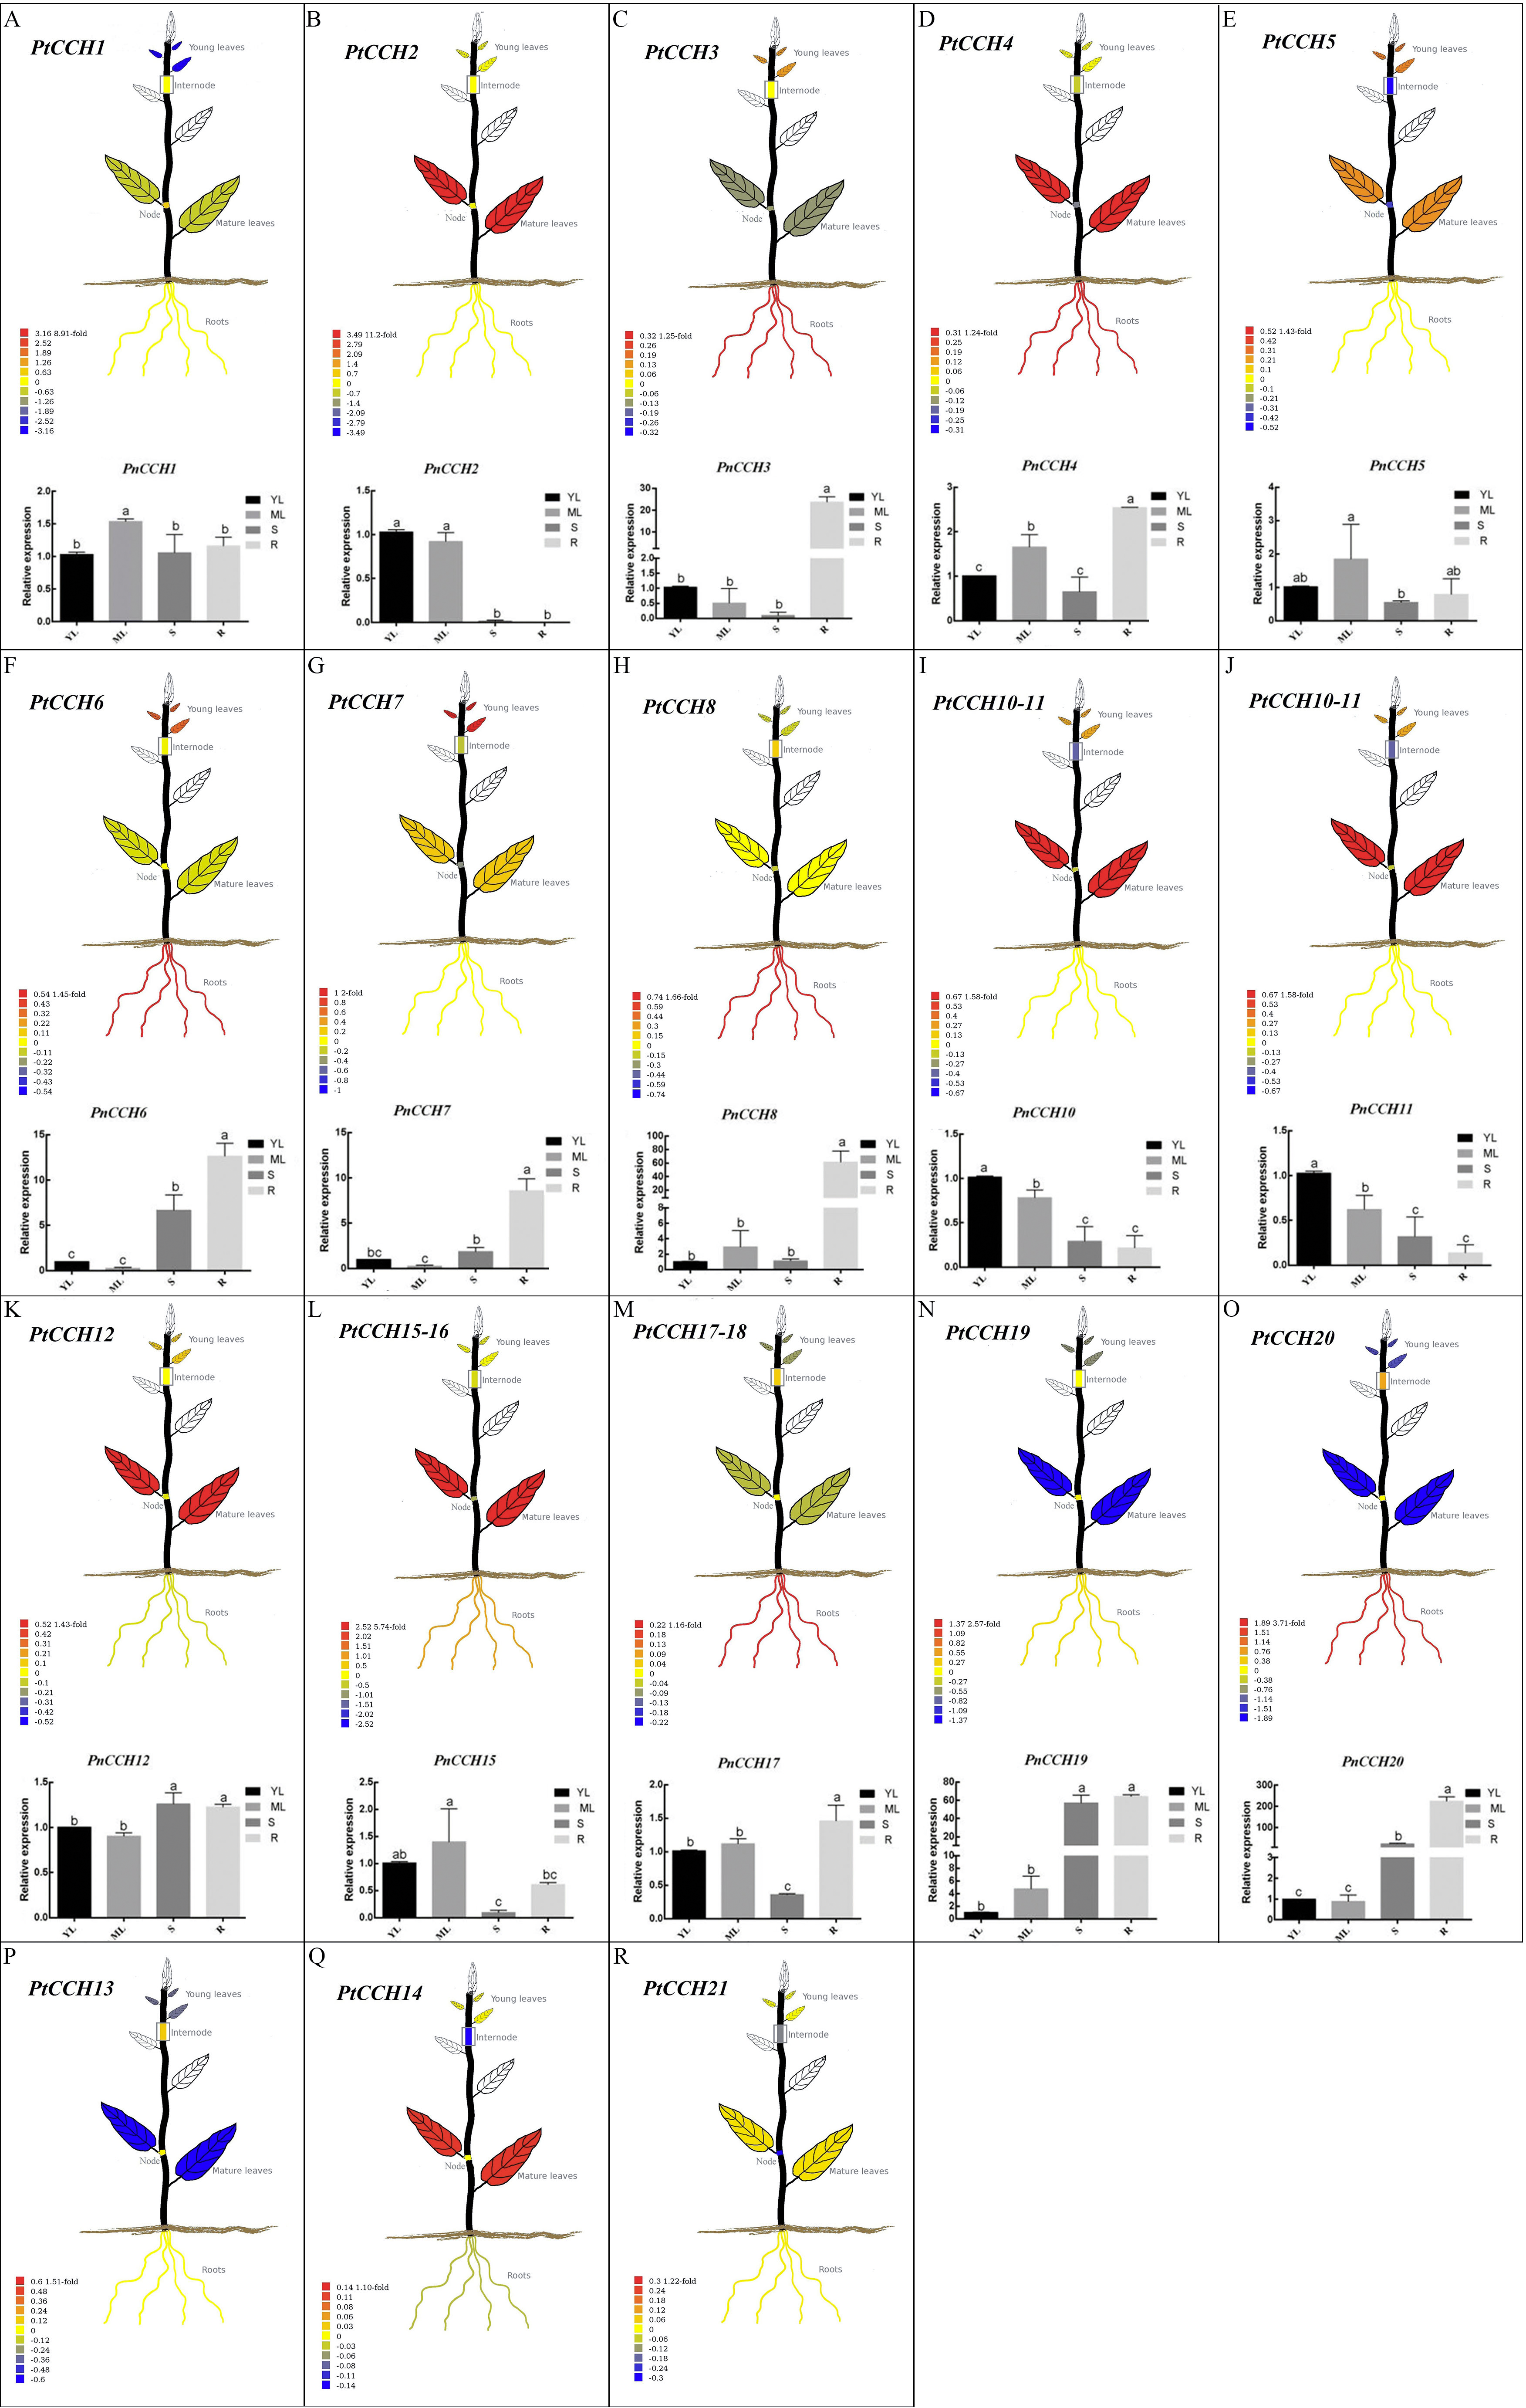
Tissue-specific expression profiles of CCH genes in the Populus genome
We used the tissue-specific expression data of PtCCH genes in mature leaves, young leaves, roots, nodes, and internodes from the Plant Genome Integrative Explorer (http://PlantGenIE.org) (Sundell et al., 2015) to generate visual images (Figs. 5A–5R). The expression data showed that PtCCH2, PtCCH10, PtCCH11, PtCCH12, PtCCH14, PtCCH15, and PtCCH16 were highly expressed in mature leaves; PtCCH3, PtCCH6, PtCCH8, PtCCH17, PtCCH18, and PtCCH20 were highly expressed in roots; and PtCCH1 and PtCCH19, which were clustered into the same clade, were highly expressed in roots/internodes/nodes. The expression levels of PtCCH4, PtCCH5, PtCCH7, PtCCH13 were higher in mature leaves/roots, young/mature leaves, young leaves, internodes, respectively, and PtCCH21 was highly expressed in roots, and young and mature leaves. Expression data for PtCCH9, which has the same nucleotide sequences as PtCCH8, was not available in http://PlantGenIE.org.
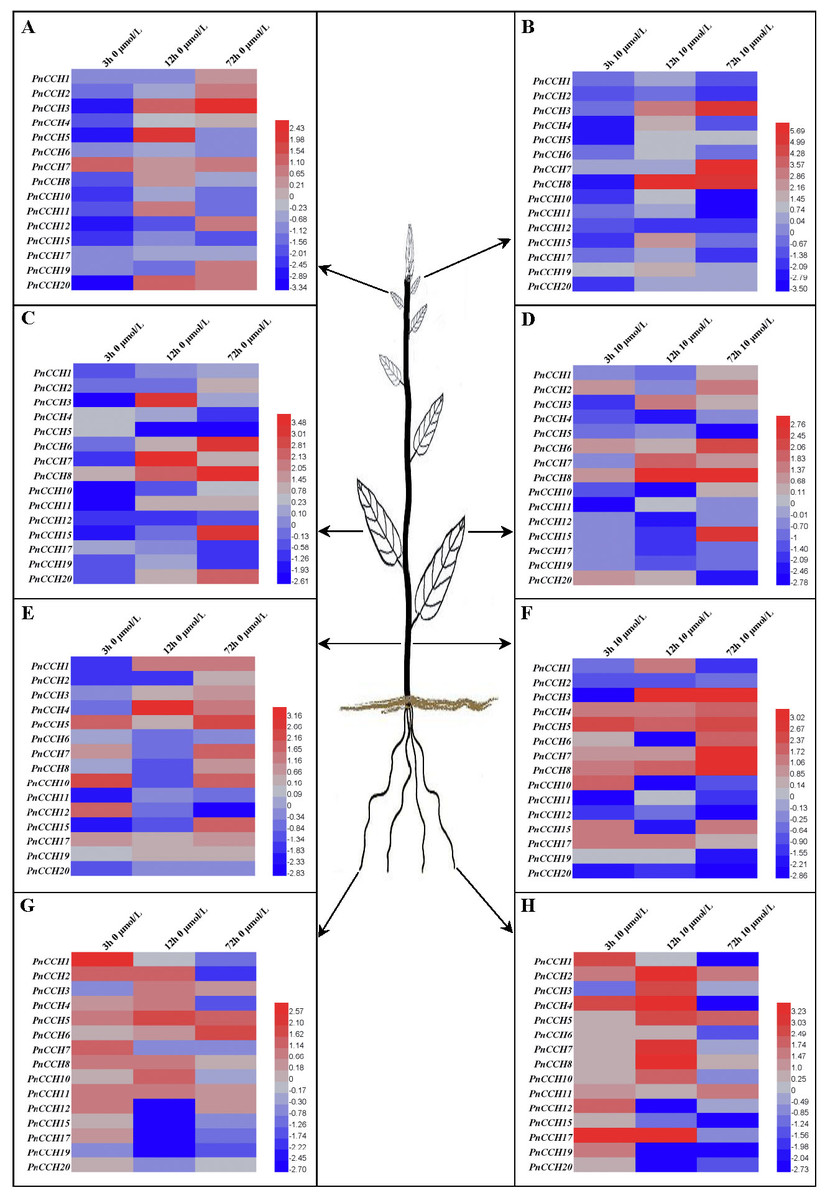
Figure 6: Expression profiles of PnCCH genes in different tissues under copper stress.
(A), Expression profiles of PnCCH genes in young leaves under 0 µM CuSO4 condition. (B), Expression profiles of PnCCH genes in young leaves under 10 µM CuSO4 condition. (C), Expression profiles of PnCCH genes in mature leaves under 0 µM CuSO4 condition. (D), Expression profiles of PnCCH genes in mature leaves under 10 µM CuSO4 condition. (E), Expression profiles of PnCCH genes in stems under 0 µM CuSO4 condition. (F), Expression profiles of PnCCH genes in stems under 10 µM CuSO4 condition. (G), Expression profiles of PnCCH genes in roots under 0 µM CuSO4 condition. (H), Expression profiles of PnCCH genes in roots under 10 µM CuSO4 condition. In the heatmaps, the genes are shown on the left, and the copper stress concentrations (0 µM CuSO4 is deficiency copper condition, 10 µM CuSO4 is excessive copper condition, and 0.5 µM CuSO4 is control copper condition) and treatment times are indicated on the top. The black arrows indicate the tissues, young leaves, mature leaves, stems, and roots, which were tested. The 2−ΔΔCT method was used to analyze the expression levels of PnCCHs in different tissues under copper stress conditions. The values of log2 (sample/control) upon to copper stress conditions and different treated times were calculated as the relative expression levels of every PnCCH genes. Scale bars are on the bottom right, and the different color of the cells in the heatmaps indicated the expression level of the treated samples went up or down compared with their controls.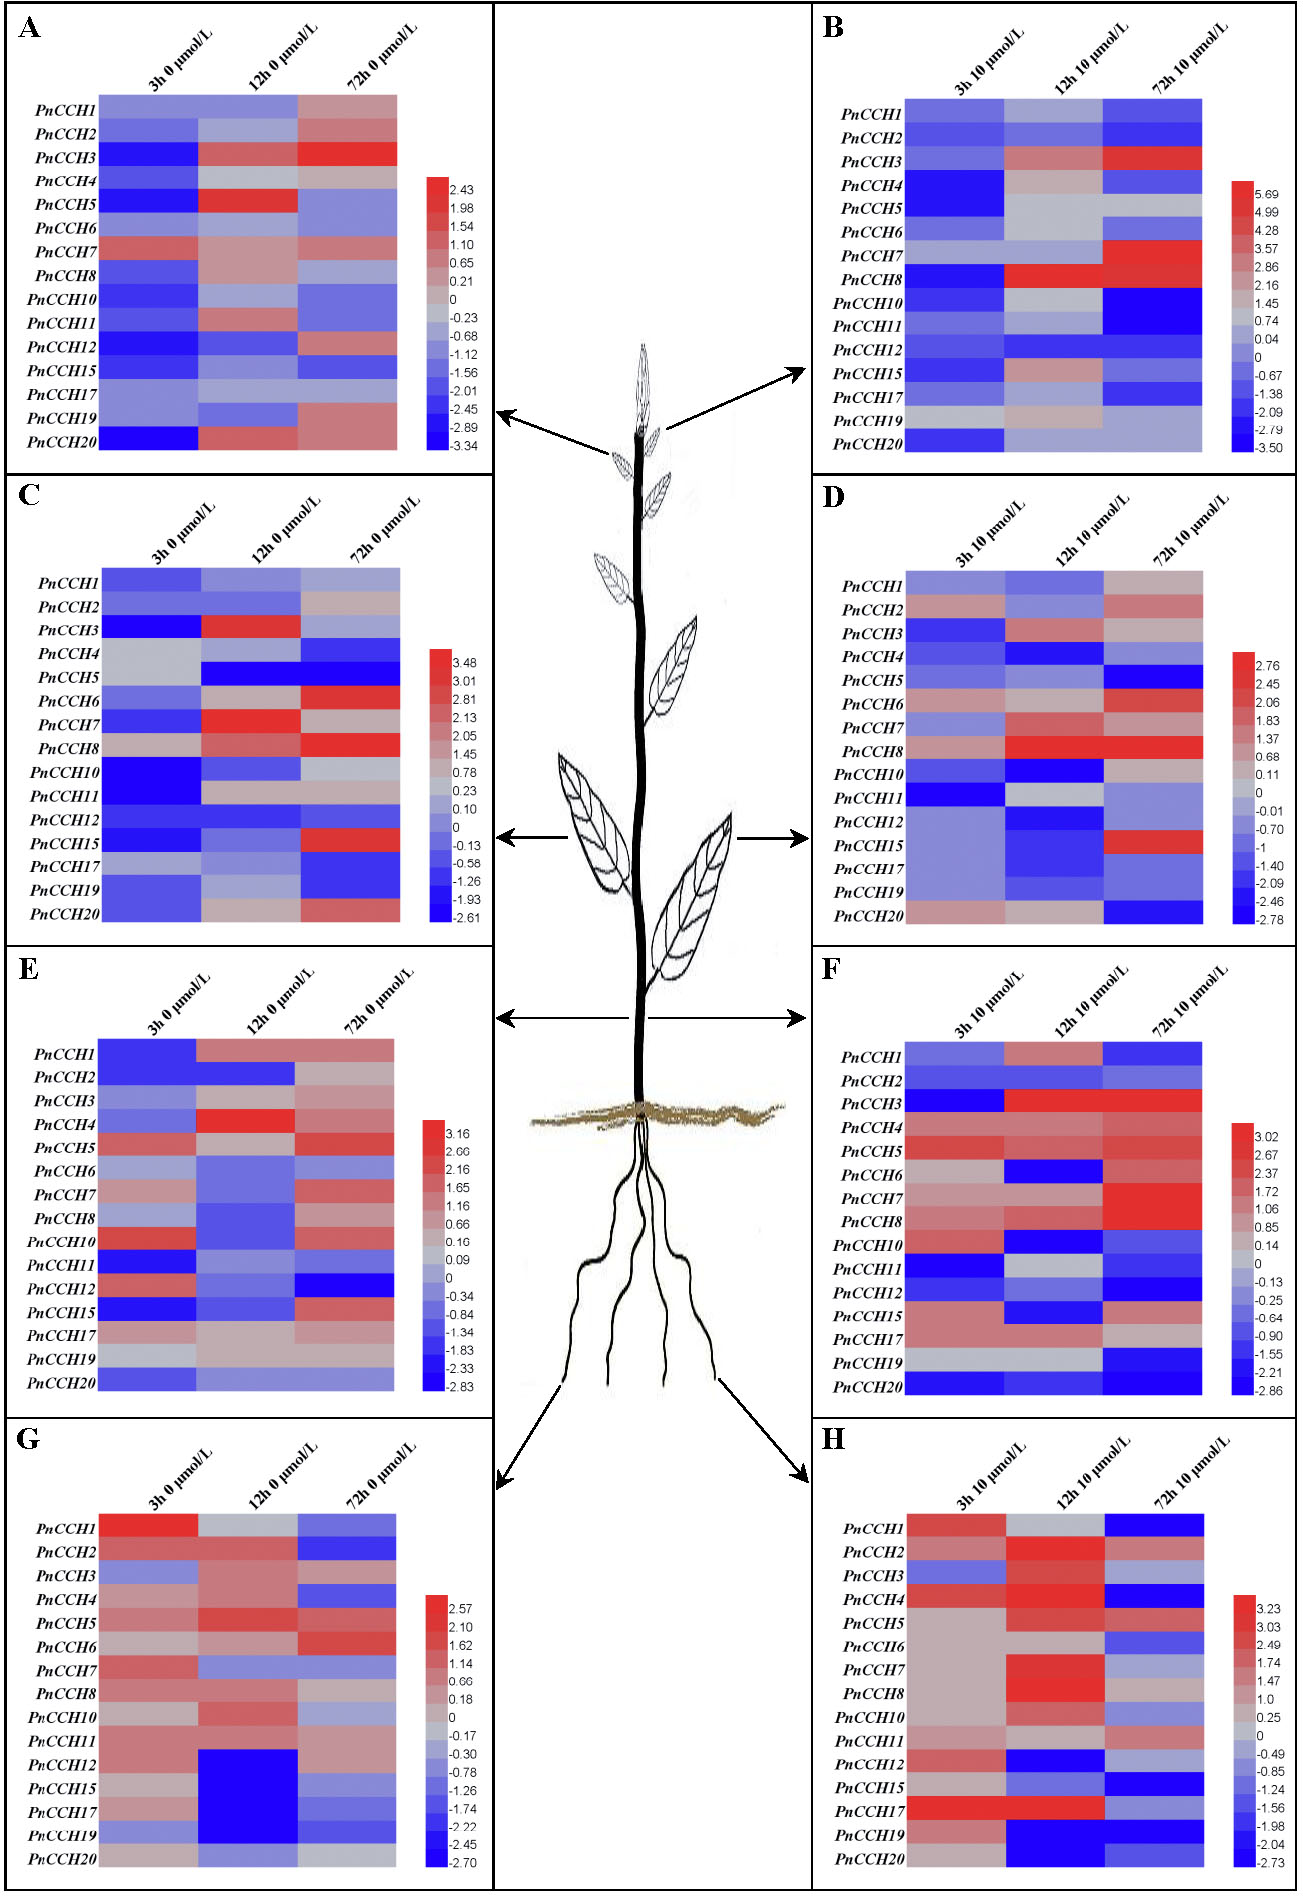
Tissue-specific expression patterns of PnCCHs in P. simonii × P. nigra roots, stems, and mature and young leaves were measured and analyzed by qRT-PCR. The primers were designed based on the nucleic acid sequences of the PtCCHs (Table S1). PtCCH8 and PtCCH9 have identical sequences and may be tandem repeats (Fig. 2). PtCCH15 and PtCCH16 are the different transcripts that were described in the gene information of P. trichocarpa genome database and their putative proteins have highly similar amino acid sequences, as well as PtCCH17 and PtCCH18; therefore, we did not design primers for PtCCH16 and PtCCH18. We could not design primers for PtCCH21 because its nucleotide sequences shared high identity with other genes in the Populus database (Tuskan et al., 2006). Beside this, we did not obtain the amplification results of PnCCH13 and PnCCH14. So, the primers for PtCCH9, 13, 14, 16, 18, and 21 genes are not included in Table S1. The results showed that PnCCH3, PnCCH4, PnCCH6, PnCCH7, PnCCH8, PnCCH17, and PnCCH20 were most highly expressed in roots, and PnCCH1, PnCCH5, and PnCCH15 were most highly expressed in mature leaves. PnCCH10 and PnCCH11, PnCCH12 and PnCCH19 had the highest expression levels in young leaves, roots/stems, respectively, while PnCCH2 was most highly expressed in young and mature leaves (Figs. 5A–5R). The expression patterns of the remaining PnCCHs could not be measured by qRT-PCR.
Expression patterns of PnCCH genes under copper stress
Previous studies showed that the function of AtCCH was copper-dependent, and that AtCCH mRNA was induced in the absence of copper and reduced with excess copper (Himelblau et al., 1998; Shin, Lo & Yeh, 2012). To investigate the functions of PnCCHs, the expression patterns of the PnCCH genes under copper stresses (deficiency and excessive) were analyzed by qRT-PCR. All the PnCCH genes exhibited expression variations in response to deficiency (0 µM CuSO4) and/or excessive copper (10 µM CuSO4). In different tissues, the expression levels of PnCCH genes relative to controls (0.5 µM CuSO4) differed (Fig. 6, Table S5). In young leaves, the expression levels of PnCCH3 were higher than the controls under either deficiency or excessive copper conditions for 72 h, and the differences were significant. PnCCH7 and PnCCH8 had increased expression levels with significant differences under excessive copper for 72 h and 12 h, respectively. The expression levels of PnCCH2 and PnCCH12 under excessive copper, and PnCCH4, PnCCH6, PnCCH10, PnCCH15, and PnCCH17 under copper deficiency could not be induced (Figs. 6A–6B). In mature leaves, the expression levels of PnCCH3 and PnCCH7 increased significantly under copper deficiency for 12 h, and the expression levels of PnCCH6, PnCCH8, and PnCCH15 were higher than the controls significantly under the deficiency or excessive copper conditions for 72 h. The expression levels of PnCCH12 under copper deficiency and PnCCH4, PnCCH5, PnCCH11, PnCCH12, PnCCH17, and PnCCH19 under the copper excessive condition were not induced (Figs. 6C–6D).
In stems, the expression levels of the PnCCH genes increased under copper deficiency, except for PnCCH6, PnCCH11, and PnCCH20; notably, the expression level of PnCCH4 was distinctly higher than the control after treatment for 12 h. When treated with excess copper, PnCCH3, PnCCH7, and PnCCH8 had increased transcript levels significantly in stems compared with those of the controls after treatment for 72 h, while the expression levels of PnCCH2, PnCCH12, PnCCH19, and PnCCH20 were not be induced by excessive copper treatment. Unlike its lack of response under copper deficiency, the expression of PnCCH6 was higher than the controls significantly after excessive copper treated for 72 h (Figs. 6E–6F). In roots, the expression of most PnCCH genes was induced under the copper deficiency condition after treatment for different times, except for PnCCH19, which had lower expression levels relative to the controls significantly. The expression levels of PnCCH12, PnCCH15, PnCCH17, and PnCCH19 were significantly decreased compared with controls after copper deficiency treatment for 12 h, and the expression levels of PnCCH1, PnCCH4, PnCCH17 and PnCCH19 were decreased significantly after copper deficiency treatment for 72 h (Fig. 6G). Under excessive copper treatment, the expression levels of PnCCH1, PnCCH4, PnCCH6, PnCCH15, PnCCH17, PnCCH19, and PnCCH20 were lower than those of the controls significantly after treated for 72 h; and the expression levels of PnCCH4 and PnCCH17 increased distinctly after treatment for 3 h and 12 h (Fig. 6H).
Discussion
In this study, we identified 21 PtCCH genes in the P. trichocarpa genome. The chromosomal location and duplication analysis indicated that the PtCCH gene family may have arisen as the result of the whole-genome duplication and tandem duplication event, according to a genome-wide analysis of other gene families in P. trichocarpa (Liu et al., 2012; Lan, Gao & Zeng, 2013). Five pairs of PtCCH genes were in tandem repeat locations on the chromosomes, while PtCCH3 and PtCCH8/9, as well as PtCCH5 and PtCCH13, were located in a pair of paralogous blocks and could be regarded as the direct result of the salicoid duplication event. Nine PtCCH genes were located in WGD duplicate blocks but lacked the corresponding duplicate genes (Fig. 2), which suggested that the loss event might have happened after the whole-genome duplication, or these nine genes might have arisen after the salicoid duplication event (Lan, Gao & Zeng, 2013). In addition to the similarity of their amino acid sequences (89%), PtCCH1 and PtCCH19 were on the same branch of the phylogenetic tree and had highly conserved motifs, but PtCCH1 and PtCCH19 genes were located outside of the WGD duplicated blocks. It was deduced that these two genes might be the products of segment duplication. All these data indicated that both WGD and tandem duplication events may have played important roles in the expansion of CCH gene family in the Populus genome. To date, only one CCH gene has been reported in A. thaliana (ATU88711), O. sativa (AF198626), and Glycine max (AF198627), and the function of AtCCH is more clearly defined than the other two CCHs (Himelblau et al., 1998; Shin, Lo & Yeh, 2012). Large gene families formed by natural selection may contain more functional members associated with speciation or adaptation (Lynch & Conery, 2000; Demuth & Hahn, 2009). The expansion of the CCH family in the Populus genome might reflect the special roles played by these genes related to the powerful adaptability against physical and biotic stresses of this perennial woody species, as has been suggested for other gene families in Populus (Hu et al., 2012; Liu & Widmer, 2014).
Recently, some CCH genes with the conserved N-terminal metal binding motif MXCXXC and lysine-rich region have been identified in plants; for example, PoCCH (AY603358) in Populus (Populus alba × P. tremula var. glandulosa), HbCCH1 (GU550955) in Hevea brasiliensis, and LeCCH (AY253832) in Lycopersicon esculentum. However, all of these genes lacked the C-terminal extension that existed in previously described CCH type copper chaperones in plants that seemed to be related to copper intercellular transport from the senescent tissues (Himelblau et al., 1998; Company & González-Bosch, 2003; Lee et al., 2005; Li et al., 2011). In our study, all the deduced PtCCH proteins contained the MXCXXC motifs and the C-terminal extended sequences. The MXCXXC motifs were located in the first loop of the βαββαβ structural fold of PtCCHs. The N-domain of ATX1-like copper chaperones in plants, such as AtCCH and AtATX1, contributed to the copper chaperone function and antioxidant protection against oxidative damage, as described in the yeast Atx1 and human HAH1 counterparts (Himelblau et al., 1998; Shin, Lo & Yeh, 2012). The antioxidant and copper chaperone properties of PtCCHs could be investigated by identifying whether they are capable of complement the growth defects of yeast atx1Δ mutant cells on iron deficient medium, as well as the aerobic lysine growth deficiency of yeast sod1Δ mutants. Furthermore, 10 of the 21 PtCCHs identified in this study had the lysine-rich region, which was proposed to be involved in recognition and interaction with its target proteins. It was demonstrated that the lysine-rich region of yeast ScAtx1 might be associated with protein–protein interactions mediated by the electrostatic attraction between the lysine residue of Atx1 and acidic residues of Ccc2, a copper transporting ATPase (Lamb et al., 1999; Mira et al., 2001b). The results of yeast two-hybrid experiments indicated that AtATX1 could interact with the heavy metal P-type ATPases HMA5 and RAN1 of Arabidopsis, as well as AtCCH after deleting the C-terminus (Andrés-Colás et al., 2006; Shin, Lo & Yeh, 2012). Further experiments are required to verify whether PtCCHs have the important role of delivering copper to P-type ATPase, and to clarify the specific functions of their plant-exclusive C-domains.
In our study, some PtCCH genes that had a near relationship in the evolutionary tree had the same exon/intron organization, and the distributions and arrangements of the putative motifs in the deduced proteins were similar. In addition, the unique motifs and their arrangements in different subgroups might be correlated with the specific functions of the PtCCH family members. Except for motif 3, which was present in all the PtCCHs and contains the MXCXXC site that is essential for copper binding, all the other motifs of PtCCHs had no related report in copper binding and transporting. So we speculated that most motifs might just conserved sequences between CCH proteins, and the functions of them need further identification. We could not use the domain combination analysis to identify novel functions of PtCCH proteins yet. According to the up-to-date genome annotations, we found 21, 13, and 12 putative CCH genes in P. trichocarpa, A. thaliana, and O. sativa, respectively. All the CCHs from these three species were classified into three groups in the phylogenetic tree (Fig. 4). The expansion of the CCH gene family in poplar, compared with Arabidopsis and rice, may be related to the stronger growth and adaptability of woody plants than herbaceous plants on the land, and also reflected the specialized roles played by these genes in copper transport and copper homeostasis regulation (Tuskan et al., 2006; Zhang et al., 2015). In addition, the CCH genes of Populus and Arabidopsis had fewer than three introns. According to some studies, genes which can rapidly change their expression levels in response to stresses generally contain fewer introns to minimize the cost of transcription and other molecular processes (such as splicing), and highly expressed genes appear to have developed short introns during the natural selection (Castillo-Davis et al., 2002; Jeffares, Penkett & Bähler, 2008).
Furthermore, the reservation of duplicated genes may be due to either genetic redundancy or function renewal (Lynch & Conery, 2000; Dean et al., 2008). Functional novelty includes neo-functionalization by obtaining new functions, or sub-functionalization by dividing the functional modules, and the functional complementation of both duplicates could perform the original roles of their ancestral gene (Liu & Widmer, 2014). To evaluate the retention modes of PtCCH genes after duplication, we constructed visual images using the expression data of P. trichocarpa in http://PlantGenIE.org (Figs. 5A–5R). The results showed that these PtCCH genes in Populus displayed expression divergence in mature leaves, young leaves, roots, nodes, and internodes. For instance, PtCCH3 and PtCCH8/9, as well as PtCCH5 and PtCCH13, was deduced be the result of whole-genome duplication event. PtCCH3 and PtCCH8, PtCCH13, PtCCH15 had higher expression levels in roots, internodes, mature leaves, respectively. The redundancy or renewal functions of PtCCH3 and PtCCH8, as well as PtCCH5 and PtCCH13, need further identification. In Arabidopsis, AtCCH mRNA was expressed in roots, stems, leaves, inflorescences, and siliques, and the CCH protein was located mainly along the vascular bundles of senescent leaves, petioles, and stem sieve elements (Himelblau et al., 1998; Mira, Martínez-García & Peñarrubia, 2001a). Whether all the PtCCH genes underwent neo-functionalization or sub-functionalization remains to be explored.
The comparative analysis of the tissue-specific expression profiles of the PnCCHs detected by qRT-PCR and the PtCCHs from http://PlantGenIE.org showed that consistent expression patterns between PtCCHs and PnCCHs existed mostly in roots, while the biggest difference in expression was in the young leaves. All members of subgroup SIII in the phylogenetic tree of PtCCHs (Fig. 3A), were highly expressed in mature leaves (Sundell et al., 2015), and the PnCCHs (PnCCH2, PnCCH10, and PnCCH11) that corresponded to most of them (PtCCH2, PtCCH10, and PtCCH11) had high expression levels in young leaves. Five PtCCHs (PtCCH1, 4, 17, 18 and PtCCH19) that clustered in subgroup SII, as well as four PnCCHs (PnCCH4, 12, 17, and PnCCH19), had high expression levels in roots (Figs. 5D, 5K, 5M and 5N). P. trichocarpa is cultivated mainly in western North America, and P. simonii × P. nigra is a hybrid poplar widely planted in northern China. The discrepancy and coherence of expression patterns between PtCCHs and PnCCHs might be caused by species-specificity between P. trichocarpa and P. simonii × P. nigra. Further investigations are required to clarify the roles of these putative copper chaperones in metal transport.
Expression patterns are usually associated with the functions of genes (Guo et al., 2008; Ma et al., 2016). The analysis of differential expression profiles of PnCCH genes could provide important information about their function specializations. In this study, we analyzed the expression profiles of PnCCHs in response to copper stress conditions. In different tissues, PnCCH genes exhibited variations in expression under deficiency or/and excessive copper conditions relative to controls (Fig. 6, Table S5). For example, tissue-specific expression profiles indicated that PnCCH3, PnCCH4, PnCCH6, PnCCH7, PnCCH8, PnCCH12, PnCCH17, PnCCH19, and PnCCH20 were highly expressed in roots. The expression levels of PnCCH3, PnCCH4, PnCCH7, PnCCH8, and PnCCH17 increased distinctly after being treated with excessive copper for 12 h, while the expression levels of PnCCH3, PnCCH6, and PnCCH7 increased only slightly under copper deficiency condition treated for 12 h. In addition, the expression levels of PnCCH19 and PnCCH20 decreased under both deficiency and excessive copper conditions after being treated for more than 12 h. The expression level of PnCCH6 increased gradually under copper deficiency condition with increasing treating times, while it reduced significantly under excessive copper after treated for 72 h. For PnCCH17, the expression level decreased under copper deficiency condition with increasing treating times, while it first increased and then decreased significantly under the excessive copper condition (Figs. 6G–6H). These results indicated that PnCCHs might take part in a complex copper homeostasis network of different tissues. To date, only one CCH gene has been identified in Arabidopsis, and although the function of the encoded copper chaperon was studied to some extent (Himelblau et al., 1998; Mira et al., 2004; Shin, Lo & Yeh, 2012), the roles of AtCCH and its CTD need to be explored further. Because of the stronger adaptability of trees on land, we deduced that the CCH proteins identified in Populus might have more complex functions in copper cellular homeostasis than AtCCH. The mechanisms of the actions of PnCCHs in copper binding and transport processes require further exploration combining the tissue-specific expression profiles.
Until now, only a few CCH genes were identified in plants, and none in Populus. This study has laid a foundation for our further identification the functions of CCH gene family members in poplar, as well as for clarification the relationship between structure and function of CCH genes in Populus. Our research might also provide some references for understanding the complex mechanisms of poplar CCH proteins in copper homeostasis.
Conclusion
Bioinformatics technology was used to screen and analyze CCH gene family in the woody plant, P. trichocarpa. All 21 PtCCHs had the metal-binding motif MXCXXC, βαββαβ secondary structure, and the extended C-terminal. The PtCCH genes that had a near relationship in phylogenetic tree generally had similar exon/intron structures and the conserved motifs in the encoded proteins. The tissue-specific expression traits of PtCCHs in P. trichocarpa and PnCCHs in P. simonii × P. nigra had discrepancy and coherence. In different tissues, the expression profiles of PnCCH genes under deficiency or/and excessive copper conditions exhibited variations. The present study opens up a new perspective to study copper homeostasis in poplar, and may also provide useful genetic resources for further research on heavy metal phytoremediation.
Supplemental Information
List and description of PtCCHs and reference genes primers used for qRT-PCR analysis
The amino acid identity of the 21 PtCCH s was aligned using BLAST in NCBI
46 of CCH genes identified from Populus trichocarpa, Oryza sativa and Arabidopsis thaliana
Motif sequences of CCH proteins identified in P. trichocarpa by MEME tools
The effect of copper stress on the expression profiles of PnCCH genes in different tissues tested by qRT-PCR
∗ represents statistical significant differences ( P < 0.05) using t test.