Monitor Logic App action inputs/outputs in Log Analytics (OMS) using tracked properties
This blogpost walks through how you can use tracked properties in Logic Apps to track action outputs and create customized dashboards in Log Analytics (OMS). It demonstrates an example of a simple order processing logic app which logs data to a Log Analytics workspace. We will then create a dashboard in Log Analytics which will provide a visualization of revenue generated over time and order categorization by city and source platform (app/website). In this example, we’ll use compose actions for demonstration. However, tracked properties can be added in any action and in more than one action in a Logic App.
Create a Logic App and add trackedProperties to the actions.
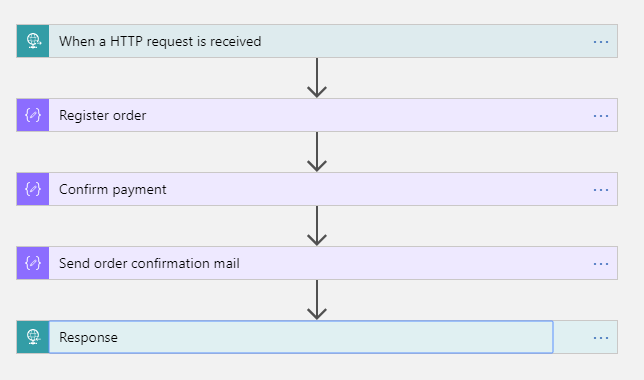
- The logic app (ProcessOrder) mimics an order processing workflow which receives an order via HTTP request trigger, records the order, confirms the payment and sends notification email to the customer. Each of the actions has trackedProperties object in their definition which tracks the outputs of the corresponding action.
- Designer View:
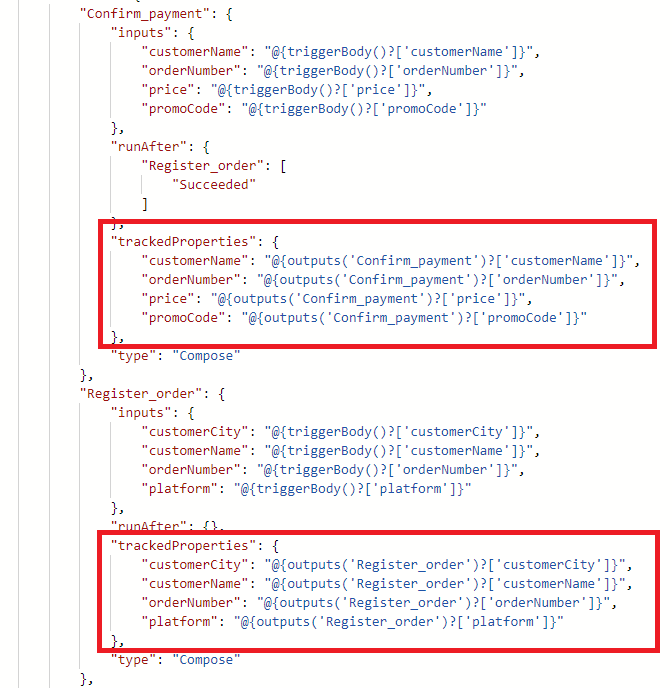
- Code view for the Register_order and Confirm_payment actions:
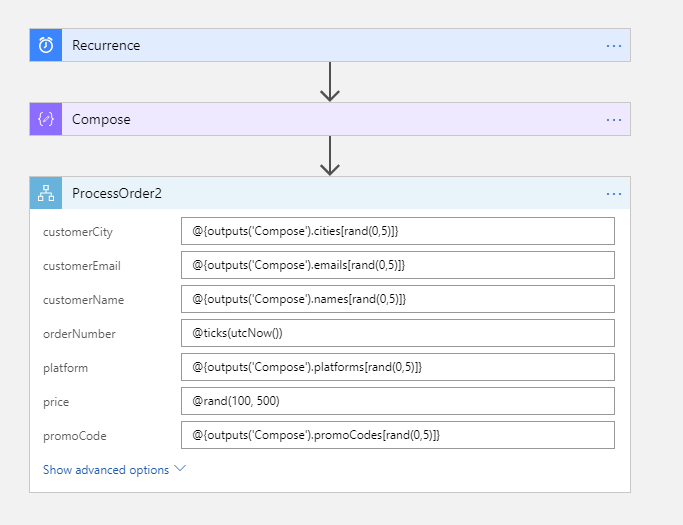
- Download the full logic app definition here: ProcessOrder.json_. Look here under the Azure Diagnostics event settings and details section to see how you can add tracked properties in any action. As of now, you can add tracked properties using only code view, they would be available in the designer soon. Here’s a SendOrder logic app which sends order to the ProcessOrder logic app. Download the full definition here: SendOrder.json_
Turn-on diagnostics for the Logic App
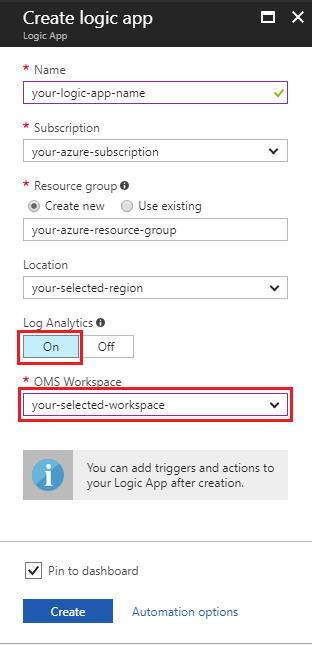
- While creating a Logic App, you can select the OMS workspace that you want to push the logs to.
- For an existing Logic App, follow this navigation path: Logic App resource blade -> Diagnostics logs (under monitoring section) -> Turn on diagnostics -> Select Log analytics -> Select workspace (If you don't have one, create one)-> Select WorkflowRuntime events -> Save. Look here under the Turn on diagnostics logging for your logic app section for more details.
- While creating a Logic App, you can select the OMS workspace that you want to push the logs to.
Create dashboard in OMS
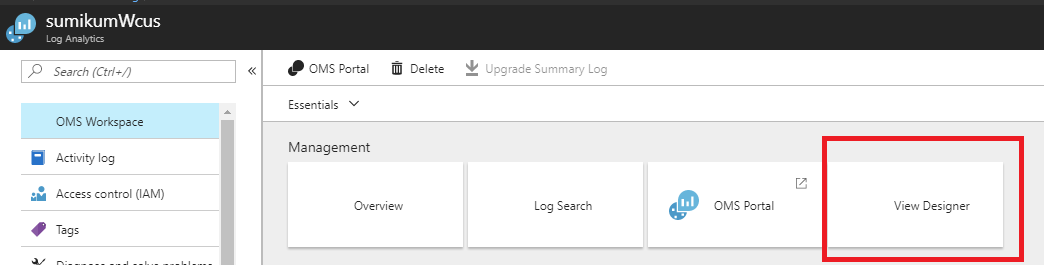
- Navigate to your Log Analytics workspace and click on View Designer
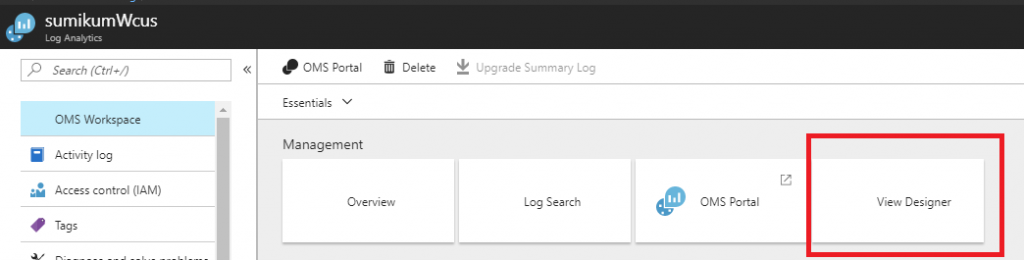
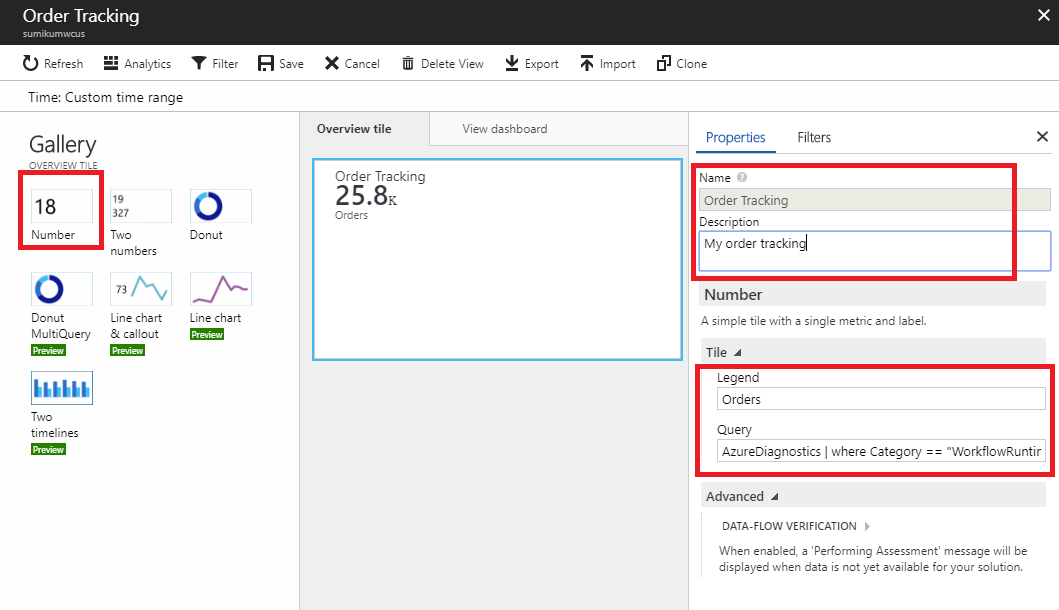
- You will see two tabs in the View Designer, one for overview tile (this will be pinned to the OMS overview dashboard) and one for the View dashboard (this will be the actual dashboard)
- For Overview tile, I have used a number tile template which shows the total number of orders received
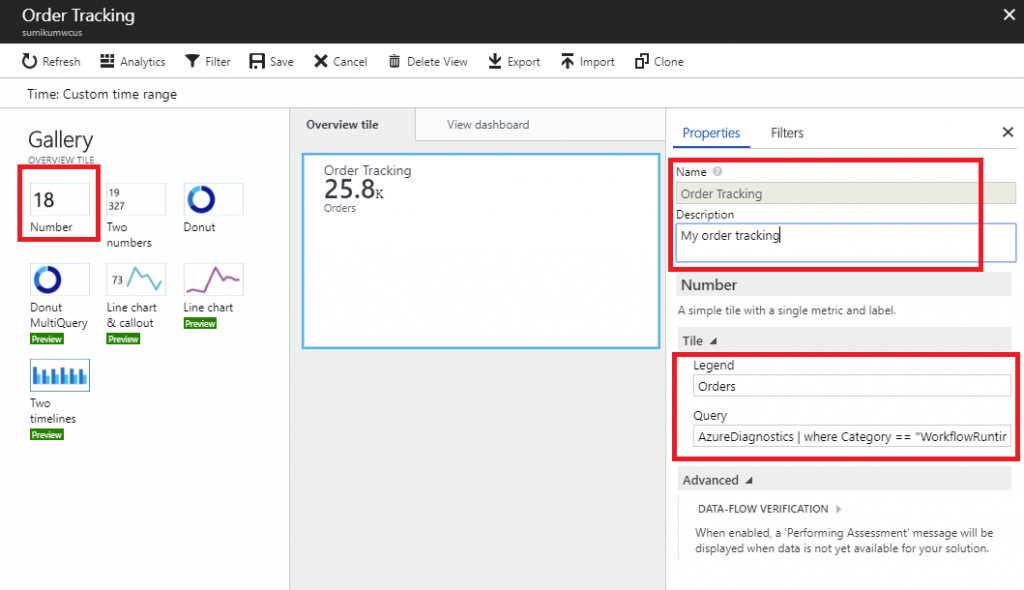
- Query (update the workflow ID and action name in the query):
AzureDiagnostics
| where Category == "WorkflowRuntime
| where OperationName == "Microsoft.Logic/workflows/workflowActionCompleted
| where workflowId_s == "/SUBSCRIPTIONS/<subscriptionID>/RESOURCEGROUPS/<resourceGroupName>/PROVIDERS/MICROSOFT.LOGIC/WORKFLOWS/<logicAppName>
| where resource_actionName_s == "Register_order
| summarize count()
- Query (update the workflow ID and action name in the query):
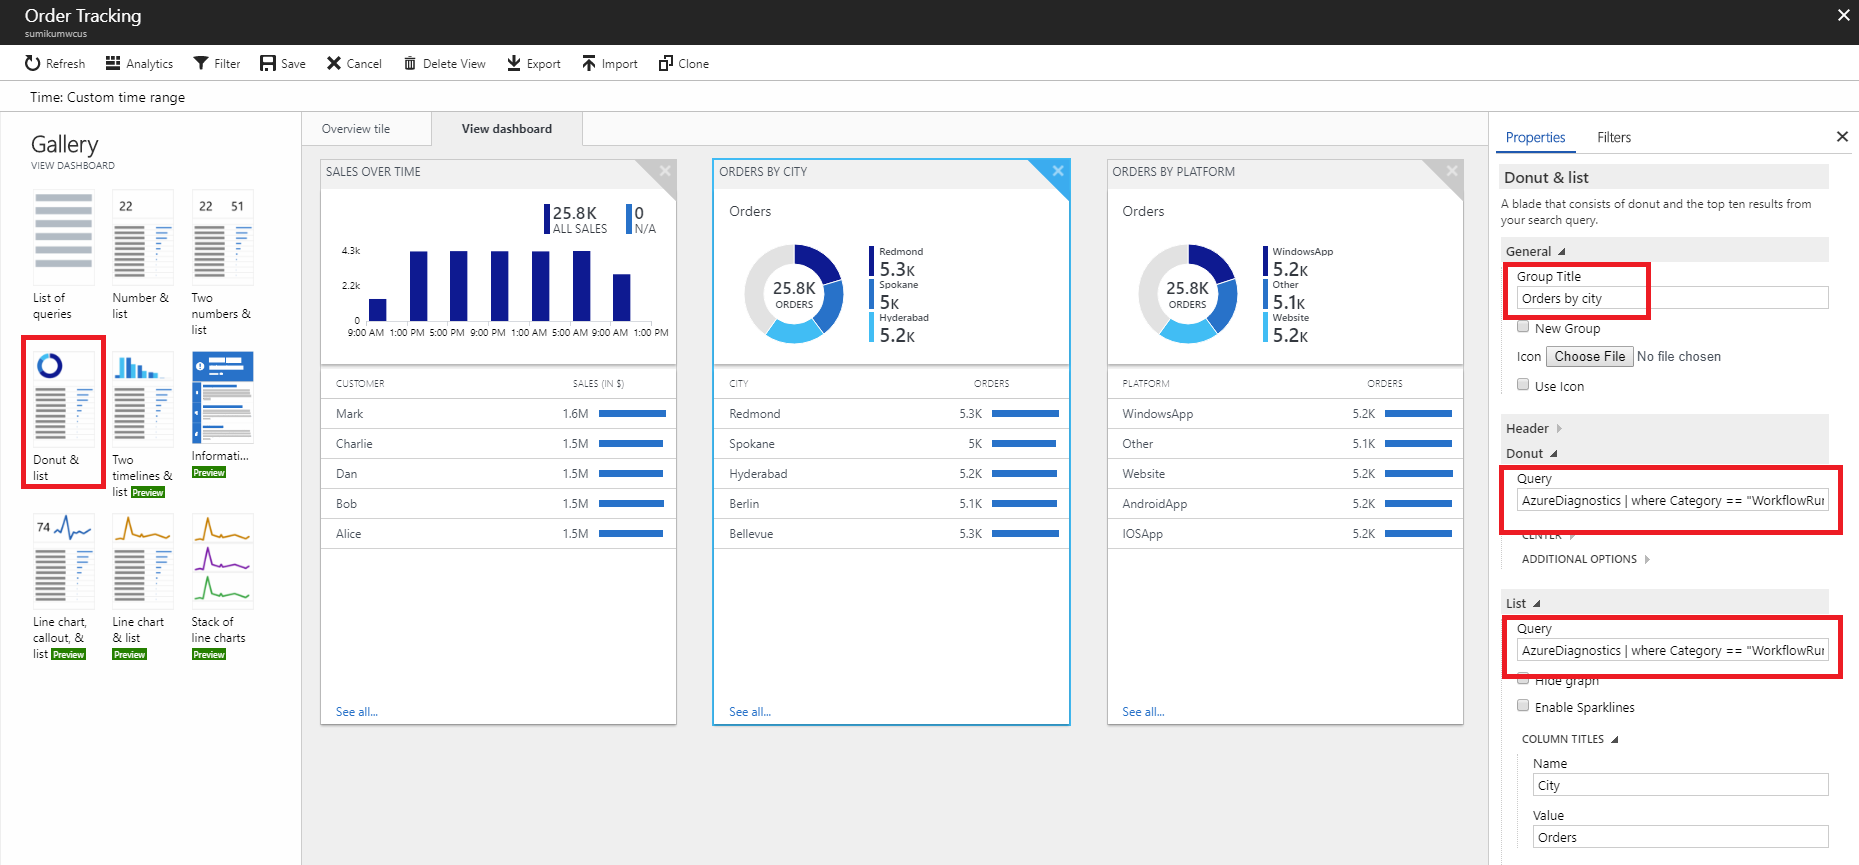
- For View dashboard, I have used Two timelines and list template for the Sales over time blade.
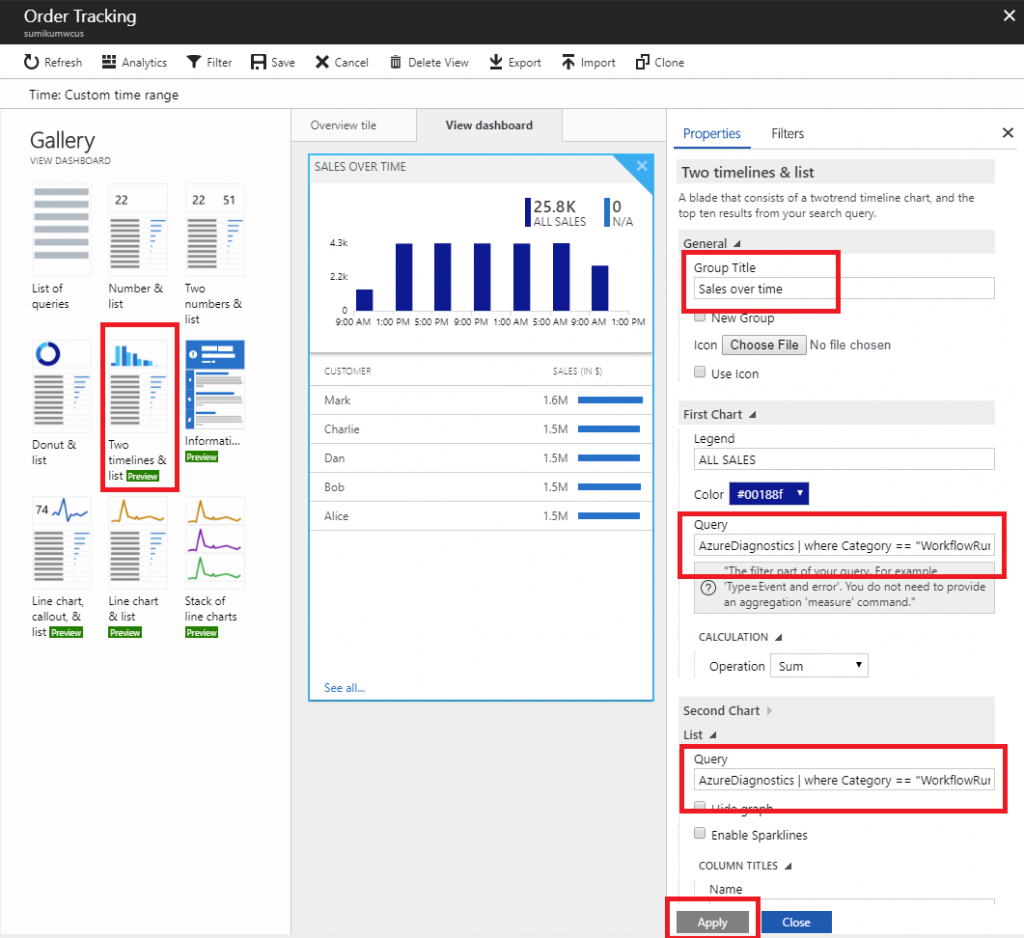
- Queries (update the workflow ID and action name in the query)
- Bar chart:
AzureDiagnostics
| where Category == "WorkflowRuntime"
| where OperationName == "Microsoft.Logic/workflows/workflowActionCompleted"
| where workflowId_s == "/SUBSCRIPTIONS/<subscriptionID>/RESOURCEGROUPS/<resourceGroupName>/PROVIDERS/MICROSOFT.LOGIC/WORKFLOWS/<logicAppName>"
| where resource_actionName_s == "Confirm_payment"
| project price=toint(trackedProperties_price_s), TimeGenerated - List:
AzureDiagnostics
| where Category == "WorkflowRuntime"
| where OperationName == "Microsoft.Logic/workflows/workflowActionCompleted"
| where workflowId_s == "/SUBSCRIPTIONS/<subscriptionID>/RESOURCEGROUPS/<resourceGroupName>/PROVIDERS/MICROSOFT.LOGIC/WORKFLOWS/<logicAppName>"
| where resource_actionName_s == "Confirm_payment"
| project price=toint(trackedProperties_price_s), TimeGenerated, trackedProperties_customerName_s
| summarize sum(price) by trackedProperties_customerName_s
- Bar chart:
- Queries (update the workflow ID and action name in the query)
- Navigate to your Log Analytics workspace and click on View Designer
-
- Similarly, I added two more blades which shows orders categorized by city and source platform.

- Queries:
- Orders by city (Donut and list)
AzureDiagnostics
| where Category == "WorkflowRuntime"
| where OperationName == "Microsoft.Logic/workflows/workflowActionCompleted"
| where workflowId_s == "/SUBSCRIPTIONS/<subscriptionID>/RESOURCEGROUPS/<resourceGroupName>/PROVIDERS/MICROSOFT.LOGIC/WORKFLOWS/<logicAppName>"
| where resource_actionName_s == "Register_order"
| project TimeGenerated, trackedProperties_customerCity_s
| summarize count() by trackedProperties_customerCity_s - Orders by platform (Donut and list)
AzureDiagnostics
| where Category == "WorkflowRuntime"
| where OperationName == "Microsoft.Logic/workflows/workflowActionCompleted"
| where workflowId_s == "/SUBSCRIPTIONS/<subscriptionID>/RESOURCEGROUPS/<resourceGroupName>/PROVIDERS/MICROSOFT.LOGIC/WORKFLOWS/<logicAppName>"
| where resource_actionName_s == "Register_order"
| project TimeGenerated, trackedProperties_platform_s
| summarize count() by trackedProperties_platform_s - You can download this view here: OrderTracking.omsview and import in your workspace using View Designer -> Import. Tip: Use Log Search to test your queries before creating the view.
- Orders by city (Donut and list)
- Queries:
- Click Save.
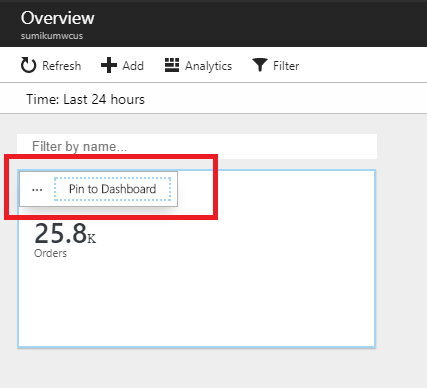
- Now, you’d be able to see the overview tile in your Log analytics overview dashboard. Click on the overview tile to navigate to the dashboard that we just created. You can also pin the overview tile to your Azure portal dashboard.
- Similarly, I added two more blades which shows orders categorized by city and source platform.
You can also use the out-of-box LogicAppsManagement solution in Log Analytics to view and search tracked properties across multiple Logic Apps. Look at the docs here.
Resources:
- SendOrder Logic App definition: SendOrder.json_
- ProcessOrder Logic App definition: ProcessOrder.json_
- Log analytics dashboard’s JSON: OrderTracking.omsview
- Log analytics search query reference: https://docs.loganalytics.io/docs/Language-Reference