- India
- International
Wednesday, May 22, 2024
Journalism of Courage
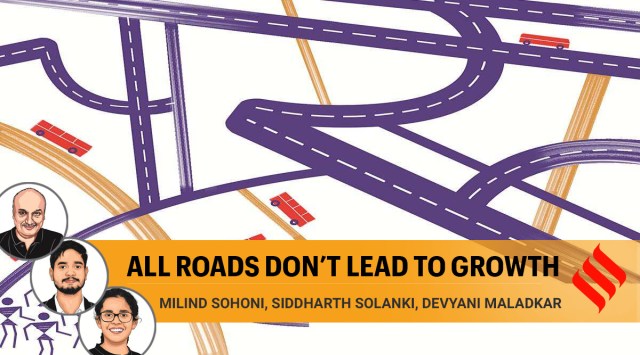 The not-so-surprising fact is that Tamil Nadu does better than Maharashtra and Uttar Pradesh in most indicators connected with roads. (Illustration by C R Sasikumar)
This year’s budget has been hailed as an “infrastructure” budget, with its increased expenditure on capital investments in infrastructure rather than on developmental services such as education or on subsidies and support. The offered argument is the expected multiplier effect as these investments bear fruit.
One example is the Ministry of Roads, Transport and Highways, which has seen a 30 per cent increase in its budget, from Rs 92,000 crore in 2020-21 to Rs 1,18,000 crore this year. Now, roads are certainly very important for both social and economic well-being. From the Census data, we see that more than 12 per cent of high school students travel more than 5 km to go to school, and about 27 per cent use public transport. For college-going students, both these numbers are above 40 per cent. It is also known that road connectivity increases economic activity and expands avenues for employment.
So, how will the new investments translate into outcomes? Fortunately, the budget documents present an Outcome Framework and a list of what was achieved in the preceding year. There, we see that 12,000 km of highways are planned for this year. Last year, of the promised 2,500 km of highways, fully 237 km have come onstream. Contracts for the remaining length have been issued.
Economists and contractors may watch kilometres and crores of rupees, but common people want mobility. Sadly, there is no mention of this term in the Outcome Framework, nor a suitable metric in the research agenda of the ministry. In any case, with an allocation of Rs 30 crore last year, or about 0.05 per cent of its outlay, this particular detail must have escaped attention.
We propose here, two simple indices to measure the state of the road network. These are (i) the Mobility Index (MI), which measures the average speed of the typical journey, and (ii) the Excess Distance Index (EDI) which is the ratio of distance travelled to the straight-line distance. The first measures the quality of roads and congestion, while the second measures the connectivity and density of the road network. The advent of web-based map services allows us to estimate these indices at close to zero cost, which otherwise could have taken fully 0.1 per cent of the ministry’s outlay to measure.

We use the Google Maps service to estimate the travel time and distance between a pair of locations, using one’s own car, at 10 AM on a weekday. We do this for a set of key cities and towns and a random selection of villages within a given region. Based on this simple strategy, we compute the indices for three states — Uttar Pradesh, Maharashtra and Tamil Nadu.
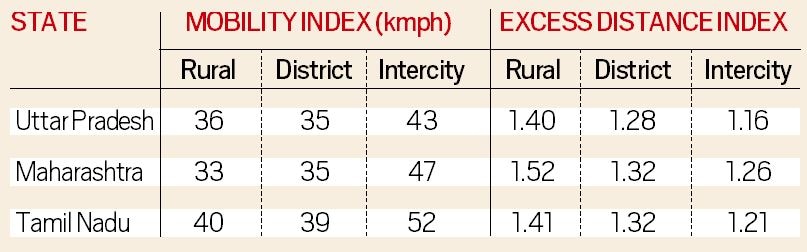
An important point is that the roads within a region are administered by different bodies — the district, the state government, and the central government. We measure each by disaggregating the set of location-pairs as rural, that is, village to village, district; village to district place, and intercity — district place to major city. The results are presented in the table.
Note that the unit of the Mobility Index (MI) is kilometres/hour (kmph), while the Excess Distance Index (EDI) is simply a ratio, and will always be greater than 1. Thus, for a region, an MI of 33 kmph and an EDI of 1.2 tells us that the speed of the average journey is 33 kmph and that it is about 20 per cent longer than the straight-line distance.
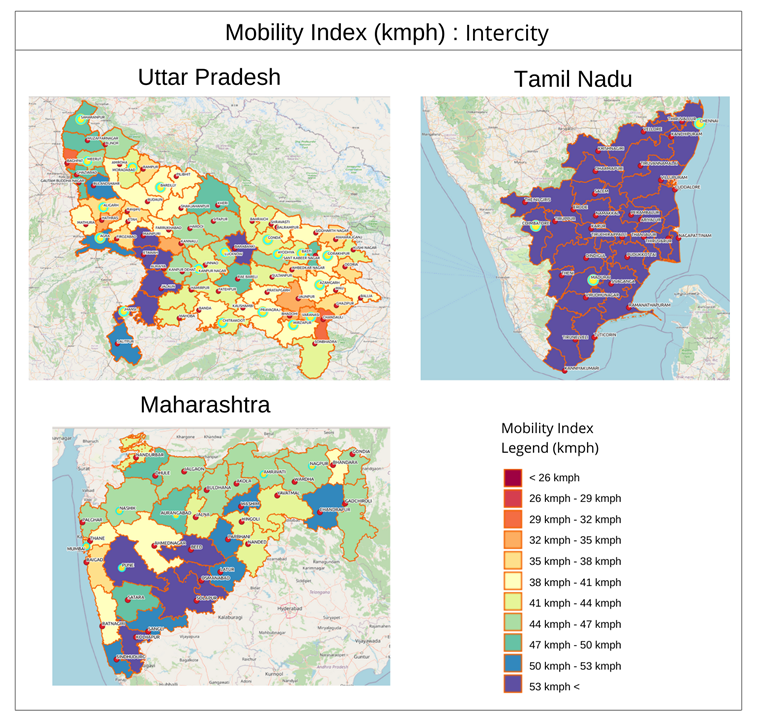 Intercity mobility – Uttar Pradesh, Tamil Nadu, Maharashtra
We see that, in mobility, Tamil Nadu is clearly ahead of the other two states by 4-8 kmph, and at all levels. With intercity speeds of 52 kmph, it is no surprise that it is a preferred destination for industries. This also sustains an important tradition — of a high-speed intercity public bus service. The only bottleneck seems to be the Chennai-Kanchipuram-Vellore industrial belt. The districts adjoining the Nilgiri mountains also show reduced speeds.
For Maharashtra, rural speeds of 33 kmph, and that too in one’s own-vehicle, highlight the misery of rural life. Intercity mobility is less than 40 kmph in most parts of the state. The exceptions are NH 361 from Solapur to Wardha, and parts of the Pune-Bengaluru NH 48. The tribal district of Nandurbar is the most backward at all levels. Thane and Raigad show that congestion due to the proximity to Mumbai, and heavy industrial traffic is taking a toll.
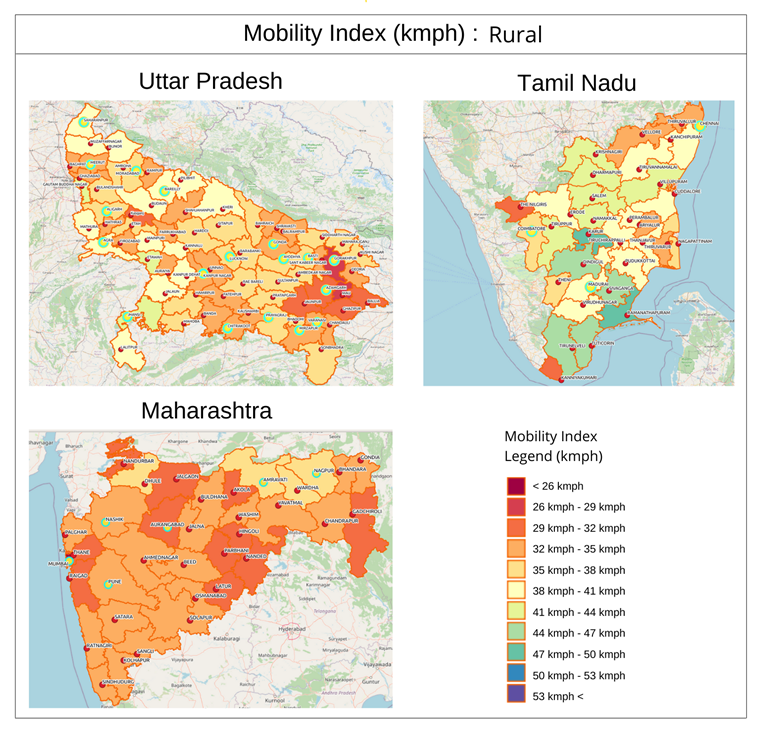 Mobility Index – Rural – Uttar Pradesh, Tamil Nadu, Maharashtra
For Uttar Pradesh, barring a few exceptions, the rural and district speeds are in the range of 30-35 kmph and the intercity speeds at 40-45 kmph. The areas around Gorakhpur and Azamgarh have poor mobility at all levels. For intercity traffic, the Sitapur-Lucknow-Kanpur corridor (NH 27 and 30) and areas bordering the NCR fare much better than the rest of the state.
As far as the excess distance index (EDI) is concerned, there is about 40-50 per cent excess travel for rural journeys which reduces to 15-25 per cent for inter-city travel. Maharashtra is clearly at the bottom with 52 per cent extra travel in the rural areas and an astounding 26 per cent excess for intercity travel. Much of this is centred around Konkan where the hilly terrain makes connectivity difficult. Most of Tamil Nadu has uniformly good EDI.
The not-so-surprising fact is that Tamil Nadu does better than Maharashtra and Uttar Pradesh in most indicators connected with roads. The per capita state domestic product of Tamil Nadu is higher, there are substantially more non-farm workers of both genders, and far more women travel than in Maharashtra and Uttar Pradesh. And yet, both Uttar Pradesh and Maharashtra have received about 40 per cent more per capita investments in the period 2014-2018.
So, there is more to roads and welfare than just money! And, unless care is taken, the infrastructure budget may well become a subsidy and support budget, albeit for a different class of people.
This column first appeared in the print edition on March 18, 2021 under the title ‘All roads don’t lead to growth’. Sohoni is with IIT- Bombay and IIT-Goa. Solanki and Maladkar are students at IIT-Goa

OpenAI’s GPT-4o has some insane capabilities: 7 use casesSubscriber Only

All We Imagine As Light: How to make it toSubscriber Only

UPSC Key | India's climate policy, Green Credit Program andSubscriber Only

What the upswing in J-K voter turnout could mean forSubscriber Only
Former WHO chief scientist at Idea ExchangeSubscriber Only
The history of SC orders against illegal mining in SariskaSubscriber Only

Bollywood superstar Shah Rukh Khan was hospitalized in Ahmedabad due to a heatstroke while attending an IPL match between Kolkata Knight Riders and Sunrisers Hyderabad with his children and other actors. He was later seen celebrating his team's victory and accidentally interrupted a post-match show, but quickly apologized. Fans and media await further updates on his condition.