The Education Policy Institute has launched a new series of research papers examining school expenditure, and how it has evolved over the last two decades.
The new series of analyses aims to develop a greater understanding of school spending patterns, by examining the nature of school income and expenditure, and how it is changing at both a system level and for individual schools.
The first introductory paper, which can be found below, or downloaded as a PDF here, outlines the evolution of expenditure since 2002-2003, and considers how much schools have spent on teachers, other school staff, and non-staffing costs.
Why do we need another study on school funding?
Key results
- Recent funding announcements represent a major shift in funding policy with significant increases in the amounts that schools will receive over the next three years.
- But schools are still likely to feel budget pressures and the need to focus on efficiency remains.
- In 2016-17, total school revenue expenditure was £46 billion – equivalent to £5,789 per pupil and an increase of 42 per cent in real terms between 2002-03 and 2016-17.
- Expenditure on teachers increased at a much slower rate, 17 per cent in real terms. In total, expenditure on staffing costs increased by 33 per cent and non-staff by 68 per cent.
- For every pound spent by schools in 2016-17, 49p was spent on teachers (down from 59p in 2002-03).
- In this new series of analyses the Education Policy Institute will explore the long-term trends in school expenditure and workforce and how they can inform the efficiency debate.
Discussion
In September 2019, the Chancellor of the Exchequer presented the outcomes of the Spending Round 2019 to parliament. While the spending round for most public services was for one year only, 2020-21, England’s state-funded schools were one of the few areas of public expenditure that received a multi-year settlement that provided funding 2022-23.
The additional spending represented a significant increase, equivalent to £7.1bn a year by 2022-23, that the Institute For Fiscal Studies have said should be enough to reverse the cuts of the last decade.
In our earlier analysis we stressed the importance of looking beyond the large numbers that are typical of Treasury announcements to try to understand what they really mean for schools in England. For example:
- the announcements at that point lacked detail on how the additional money would be distributed to schools though we know a focus on ‘levelling-up’ funding would disproportionately benefit schools with less challenging intakes;
- the announcement of increases in teacher pay would put fresh pressure on school budgets but without further details it is difficult to say how much and whether particular schools would be affected; and
- the increases build up over several years and so even schools that make the largest gains from this settlement are still likely to be feeling the squeeze for some time.
There is therefore an ongoing need to focus on school efficiency.
As part of that, the Education Policy Institute will be publishing a series of notes that aim to build understanding of how the nature of school income and expenditure is changing at both system level and for individual schools. Much of the analysis and research to date has focused on the macro level – what do schools have coming in, primarily through grant funding, and how much they have going out. Much less has been written about the ways that schools are spending their money and how that has changed in recent years.
What do we already know about how schools are spending money?
Since 2002-03 the Department for Education (DfE) has collected detailed income and expenditure data from individual local authority maintained schools through the Consistent Financial Reporting data collection. From 2011-12 the collection of school expenditure data was expanded to include data from academies through the Academies Account Return. DfE use this data to populate the schools financial benchmarking website, enabling schools to compare their patterns of expenditure – such as how much they spend on teaching assistants, how much they spend on energy – with other schools.
Last year, DfE published new analysis – ‘Trends in school spending: 2002-03 to 2016-17’ – to examine how overall school expenditure has changed over time, including in individual expenditure categories.
In 2016-17, state-funded schools in England spent nearly £46 billion. This is equivalent to £5,789 per pupil, per year, and between 2002-03 and 2016-17 per pupil expenditure across all state-funded schools in England increased by 42 per cent in real terms.
Per pupil expenditure of £5,789 in 2016-17 was £1,708 higher in real terms than in 2002-03. The increases were fastest over the first half of the period where expenditure per pupil increased by £1,357 in 2016-17 prices over the seven years to 2009-10 before seeing a more modest increase of £351 in the following seven years.
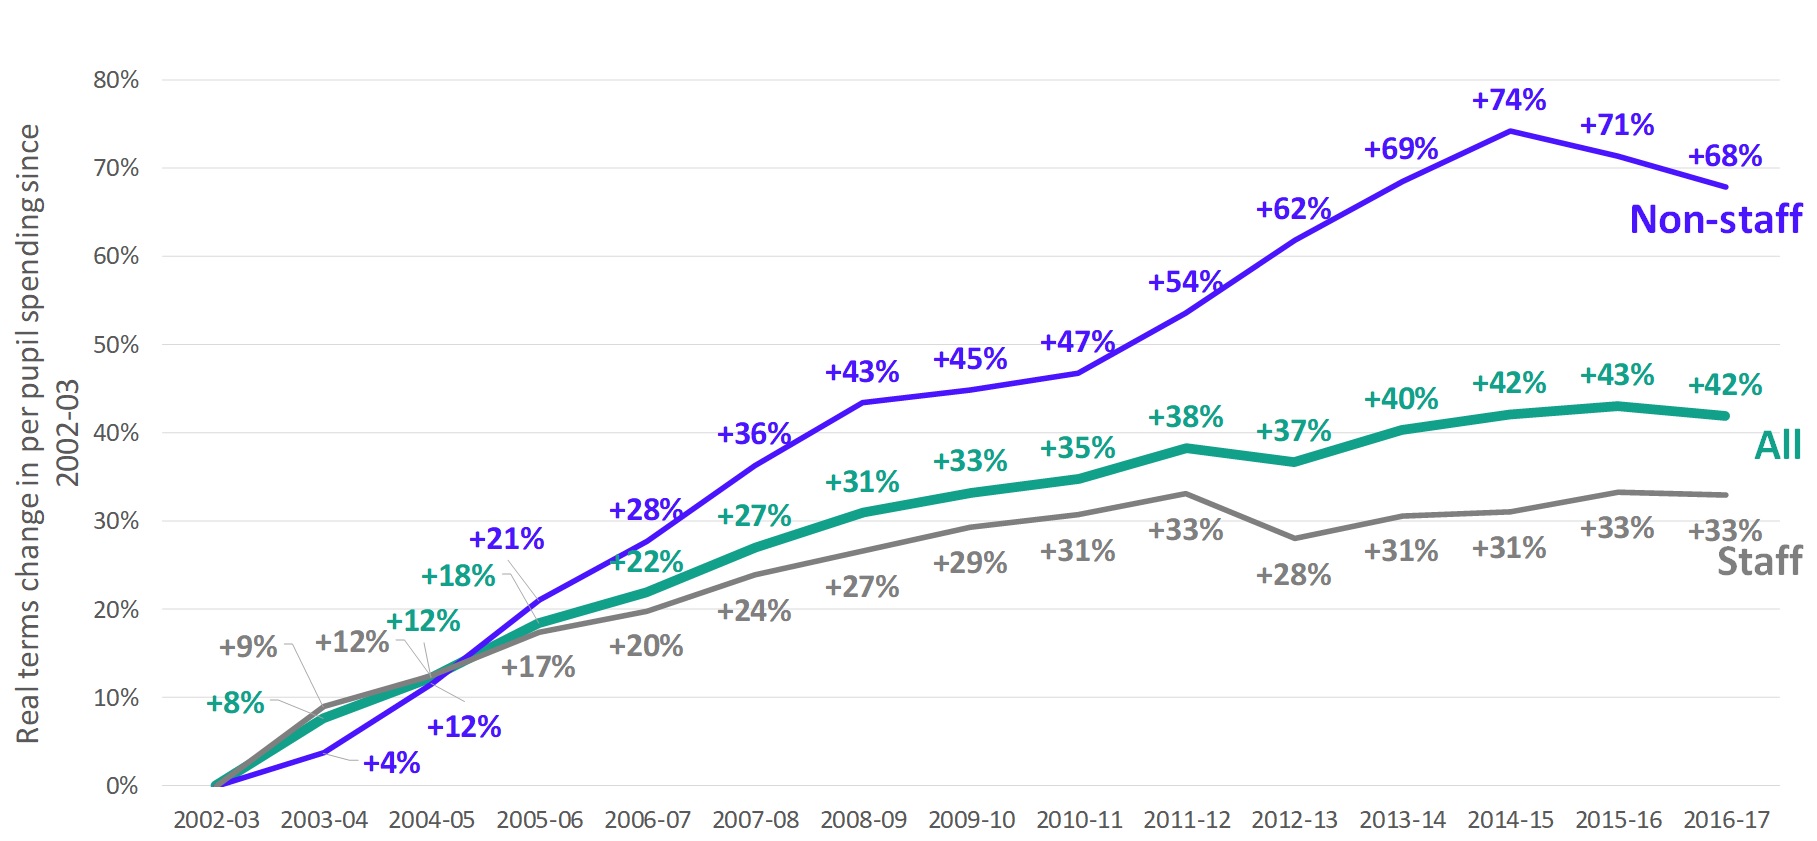
It is not just overall expenditure that has changed in that time, but the profile of spend too with different lines of expenditure increasing at very different rates. Whilst staffing costs represent the majority of school expenditure, the largest increases were seen in non-staff expenditure which increased at over twice the rate of staffing costs. Expenditure on non-staff costs – such as premises costs and ‘back office’ functions – increased by 68 per cent in real terms overall, compared to 33 per cent on staffing costs.
The divergence of these two broad categories of expenditure is most noticeable in the years since 2010-11. Both had followed a steady upward trend from 2002-03 (though non-staff costs were already increasing at a faster rate) before expenditure on non-staff costs then increased rapidly, reaching a peak in 2014-15 before falling back slightly.
In fact, expenditure on non-staff costs increased by over half in just four years, at the same time as expenditure on staff costs remained broadly flat. This pattern is likely to reflect a combination of public sector pay policy and the number of teachers and, in particular, teaching assistants – which combined make up the majority of expenditure – flattening over this period
Figure 1: Change in real terms per pupil expenditure since 2002-03 [1]
By far the biggest source of expenditure in schools is on teaching staff, accounting for almost half of all revenue expenditure at £2,811 per pupil in 2016-17. A further £894 – or 15 per cent – was spent on education support staff including teaching assistants. Overall, 70 per cent of school expenditure goes towards staff costs. The relative size of these areas of expenditure are worth remembering when we begin to consider the potential scope of efficiency savings. Learning resources – both IT and non-IT based – account for just five per cent of school expenditure and energy costs are on average just over one per cent of a school’s costs.
Figure 2: Average per pupil expenditure across all state-funded schools, 2016-17
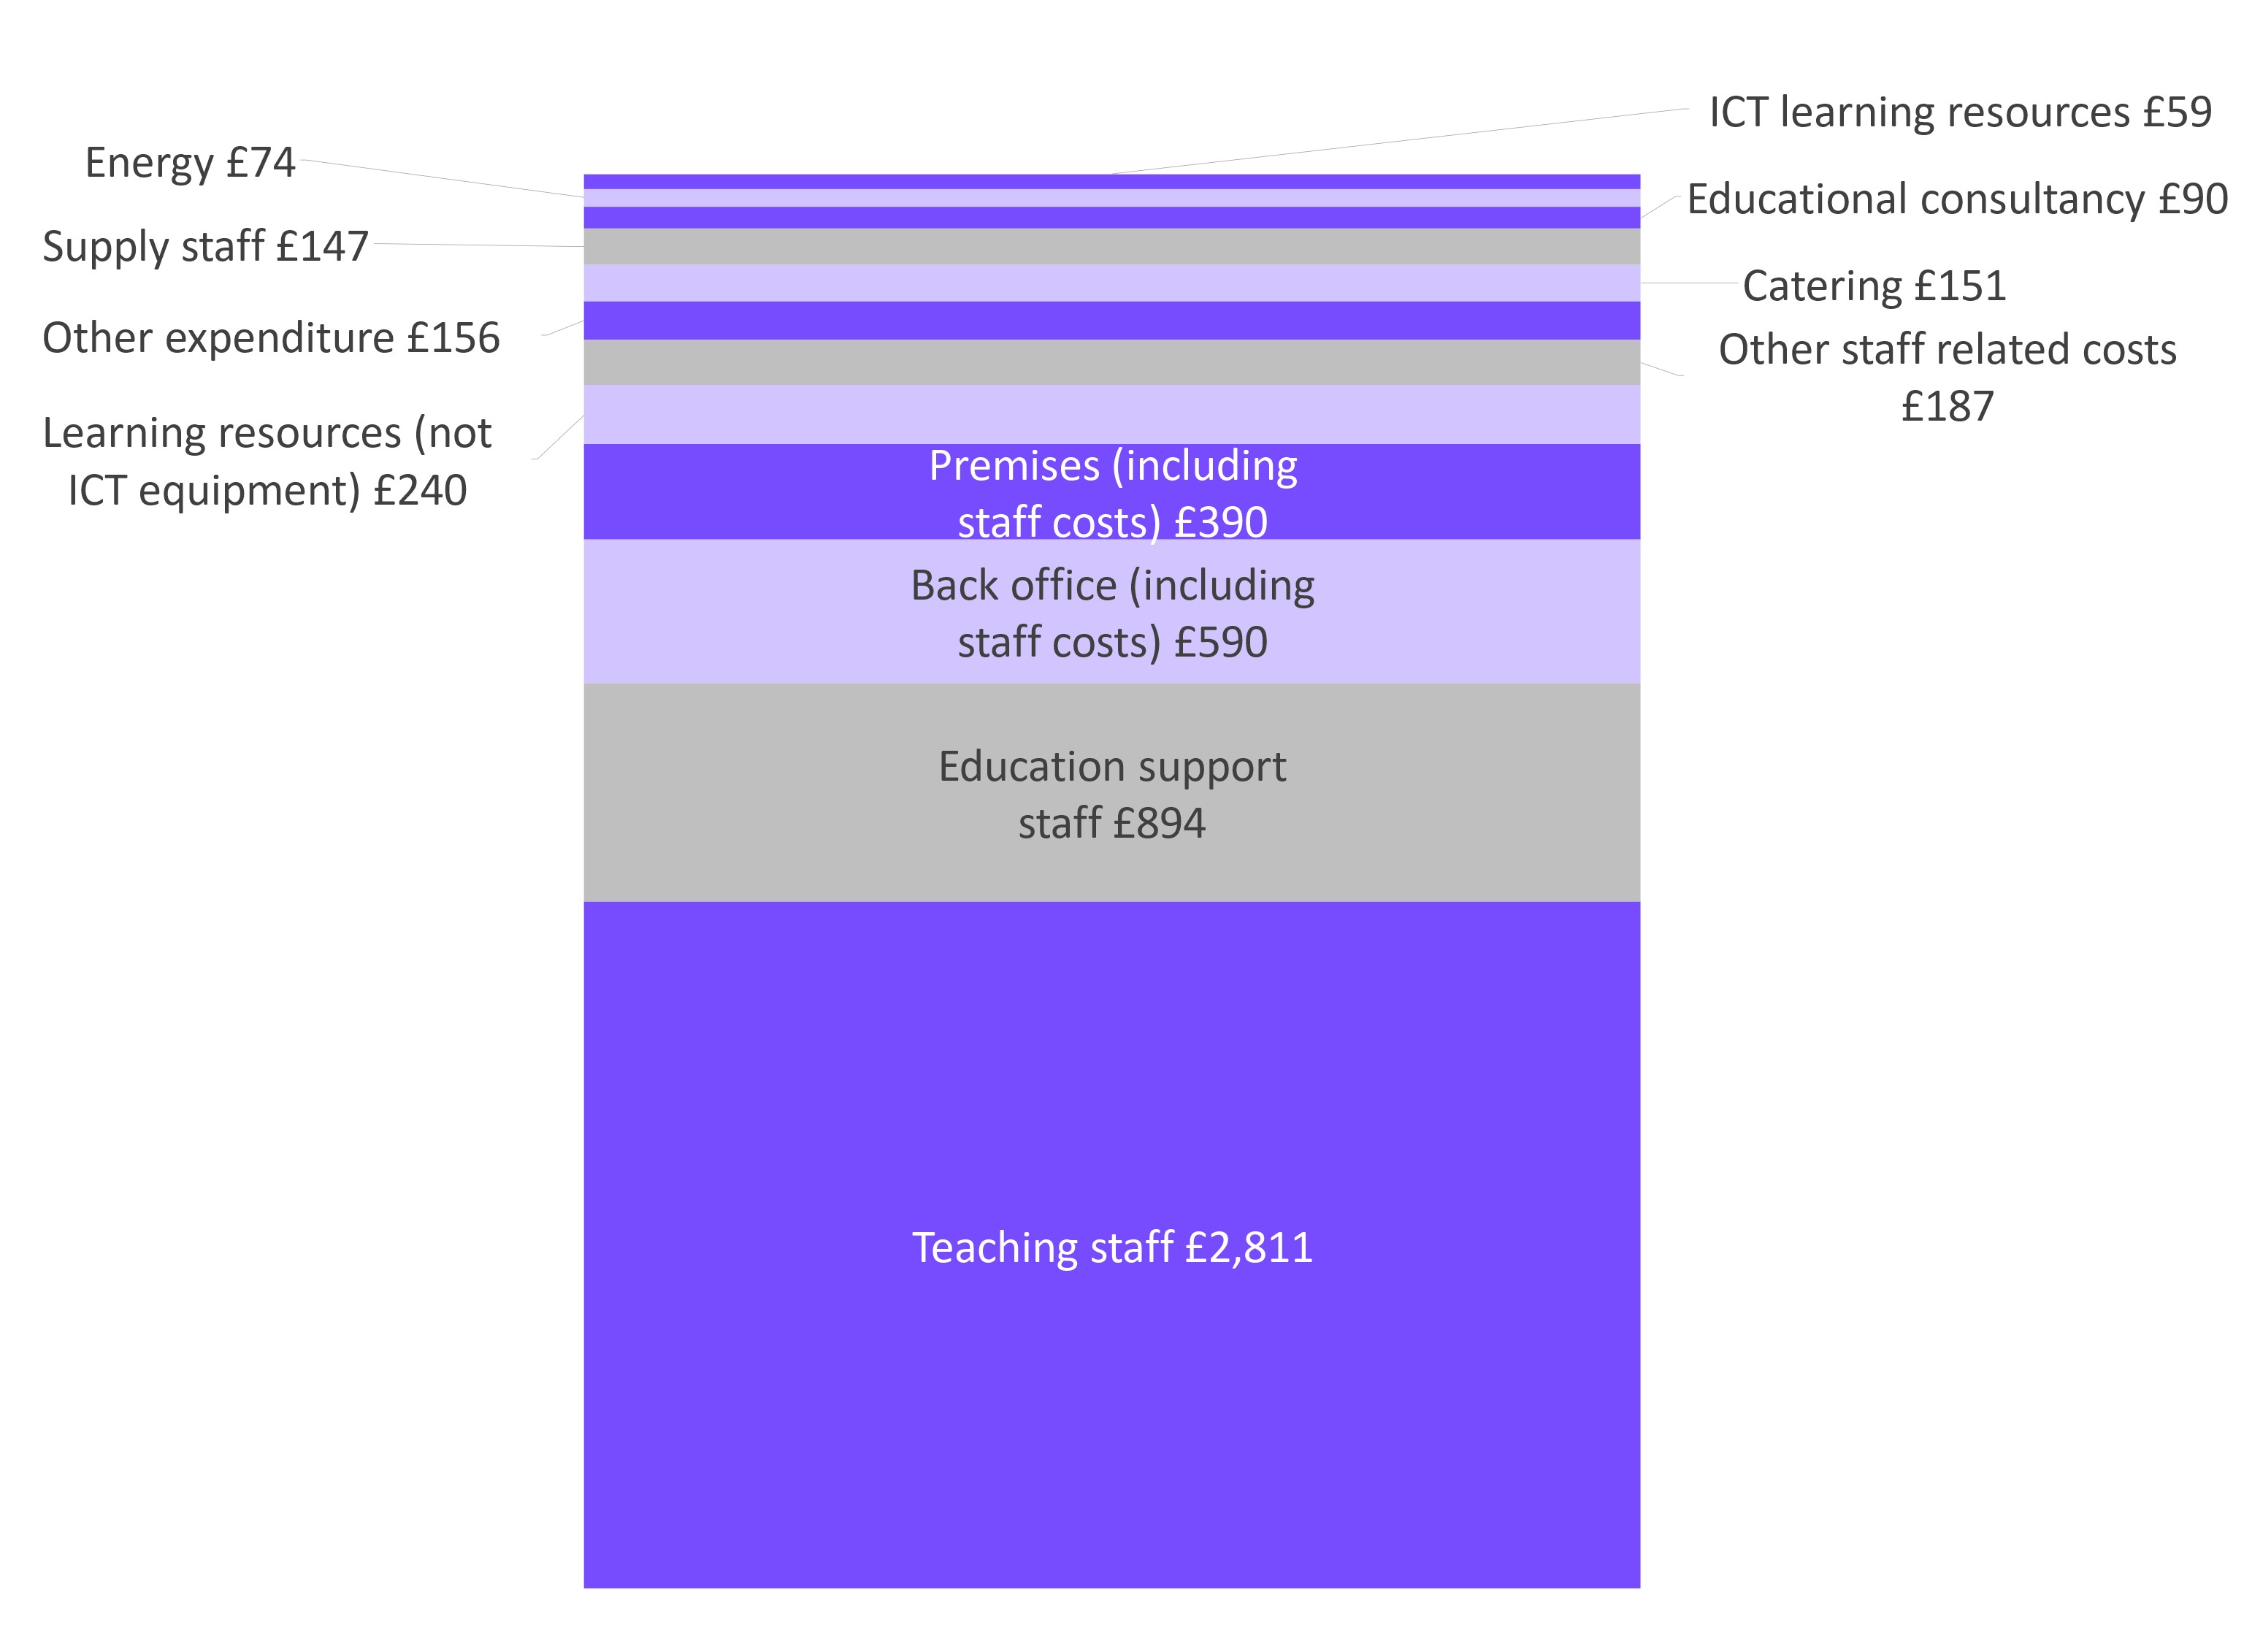
Figure 3 shows how expenditure has increased over time over the complete range of expenditure categories. Expenditure on teachers, by far the largest single source of expenditure, has increased at just over half the rate of all staffing costs. Between 2002-03 and 2016-17 per pupil expenditure on teaching staff increased by 17 per cent in real terms, compared to 33 per cent on all staff costs and an overall increase of 42 per cent.
In 2002-03, for every pound that schools spent, 59p was spent on teachers. By 2016-17 that had fallen to 49p. So, while, overall school spending has increased rapidly, the majority of the additional money that schools are now spending is going on other types of expenditure. For every additional pound schools are spending today in comparison to 2002-03, 76p is being spent on something other than teaching staff.
It is another area of staffing – education support staff, including teaching assistants – that has seen large gains, an increase in per pupil spending of 138 per cent in real terms – equivalent to £519 per pupil. Expenditure on education support staff now accounts for 15 per cent of all school expenditure, an increase from 9 per cent in 2002-03.
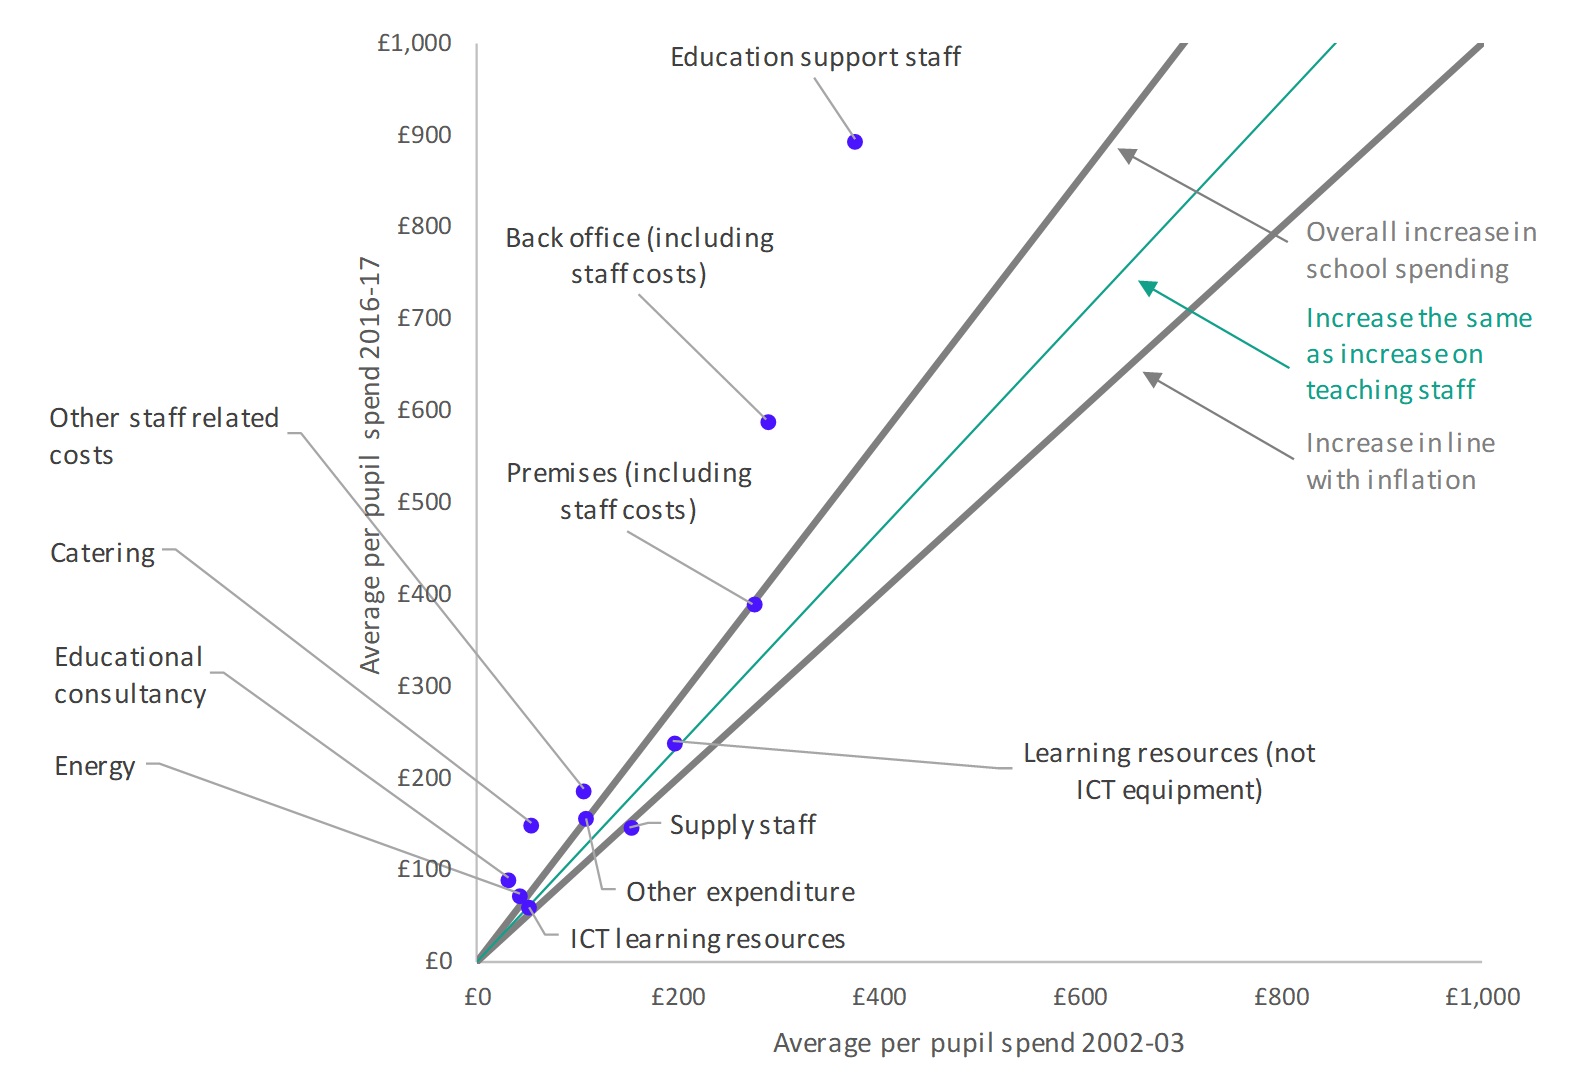
Figure 4 illustrates more clearly both the overall level of expenditure on each expenditure line (excluding teachers to aid clarity with the scale) and how it has changed over time. With the exception of expenditure on supply staff, all lines of expenditure have increased faster than general inflation and most have increased at a faster rate than expenditure on teachers. But it is education support staff, and back office functions, which were already significant contributors to school expenditure in 2002-03, where increases have had the biggest effect on overall expenditure.
Figure 3: Real terms change in per pupil expenditure since 2002-03 across all state-funded schools by detailed line of expenditure
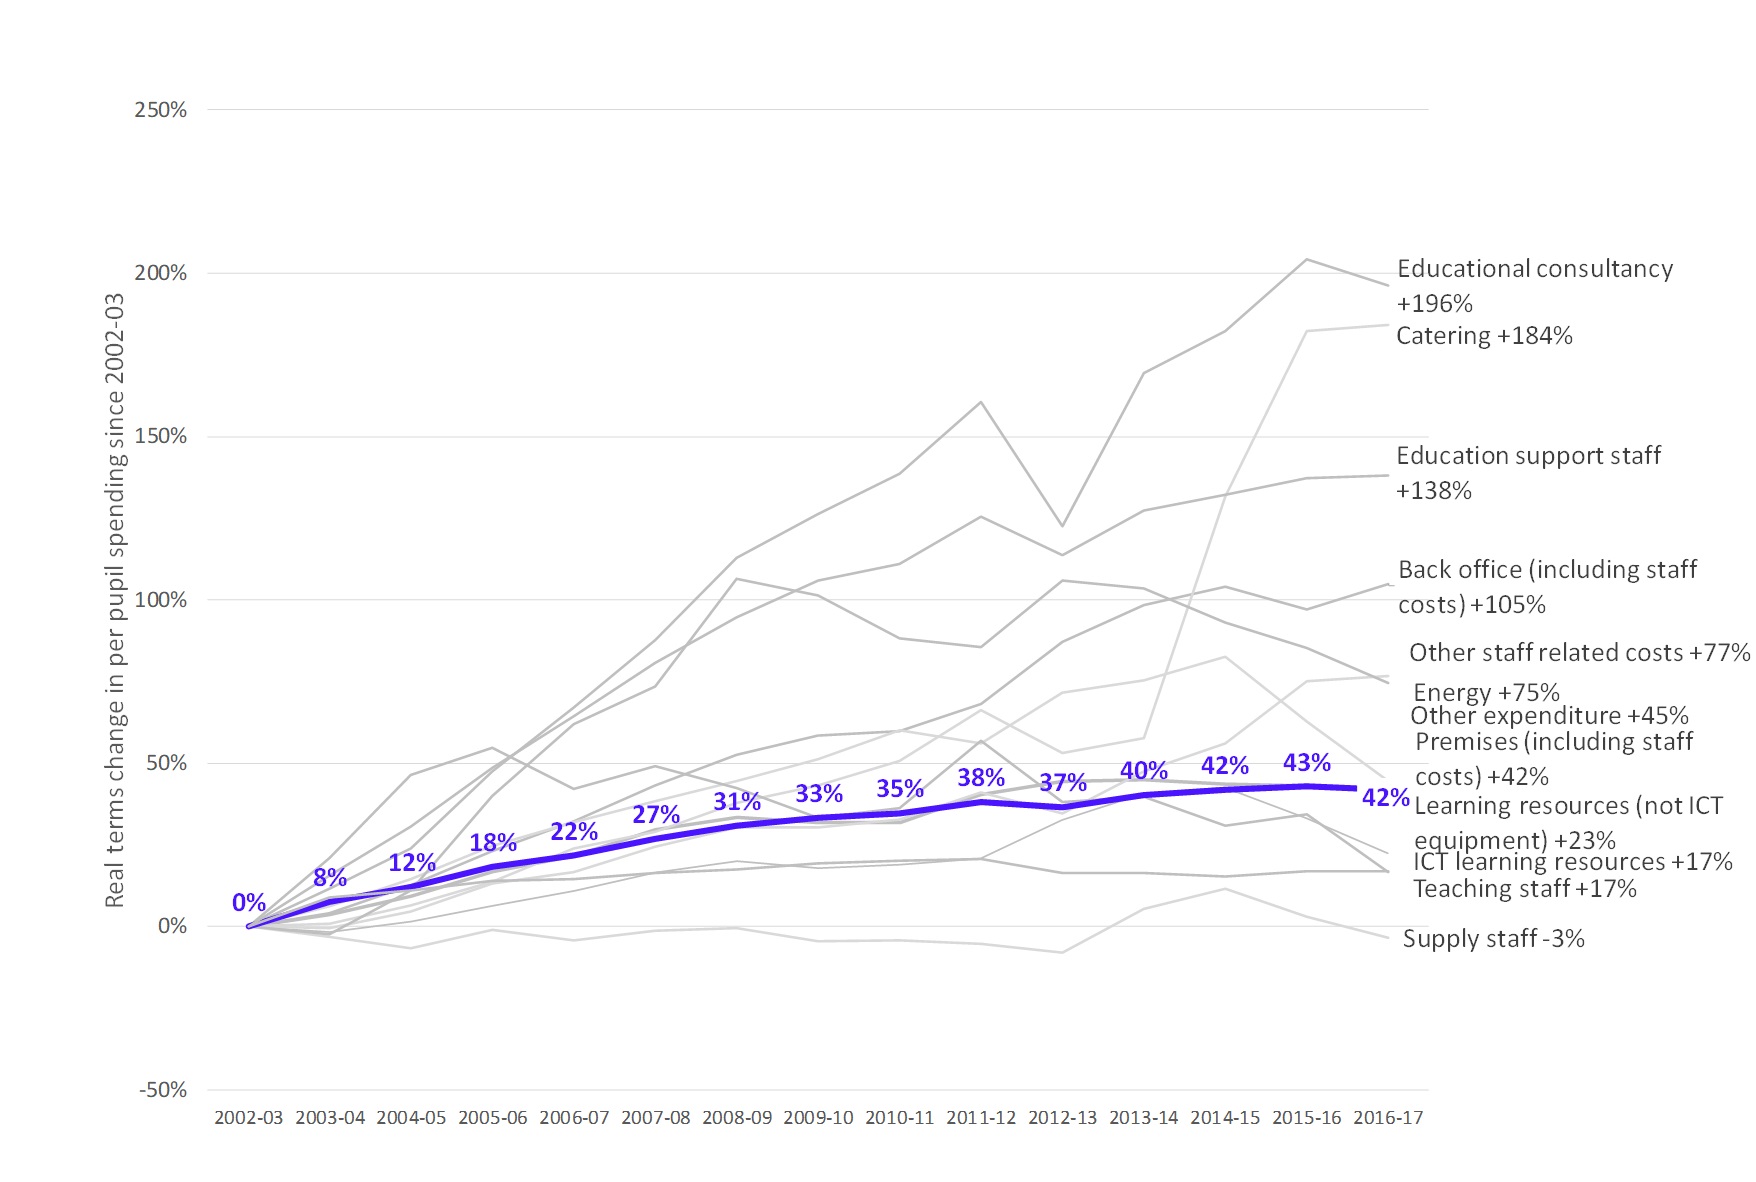
Figure 4: Spend per pupil in 2002-03 and 2016-17 across all state-funded schools by detailed line of expenditure
The need to develop a greater understanding of school expenditure
In subsequent posts we will consider how these long-term trends vary by the characteristics of schools and look in detail at the trends on the most important expenditure categories.
Understanding this is an important part of the school funding puzzle. Despite being a major source of government expenditure, we do not really know how much it costs to run a school. How much should a school be spending on teachers? How much should they be spending on text books? The government’s National Funding Formula schools is designed to distribute the total pot of money fairly, based on a set of school and pupil characteristics, but that’s quite different from a school being funded ‘correctly’.[2]
As such, we have a system whereby there’s wide variation in the amounts of funding that schools are receiving (even under the NFF) and considerable differences in the ways in which they are spending that money. That then raises a rather obvious question. If school A can offer a high-quality education for a given amount, then why can’t school B? Is School B being inefficient? Or to look at it from the other direction, what could school A achieve if it had the resources of school B?
In this new series the Education Policy Institute will explore school income and expenditure in more depth examining how they have changed over time and how they continue to evolve.
We will be adding new analysis to this resource as it becomes available.
[1] Note that the Department for Education data for 2012-13 is incomplete and as such the fall in that year as recorded in the statistics does not represent a genuine fall.
[2] DfE (2018), ‘National funding formula for schools and high needs’