Florian Kräutli: Using Timelines to Visualize MoDA’s Collections
Timelines are familiar devices in museum settings. They are often used to communicate historical narratives. Dr Florian Kräutli’s research looks at timelines for another reason, namely how they may be used to analyze digital collections. Florian used MoDA’s collections to help find out how timelines can enable us to understand the richness and complexity of historical data.
In my research I asked: What knowledge can we gain from analyzing digital collections through timeline visualizations?
 Museums and archives have long made use of digital databases to catalogue and maintain their collections. One of the earliest digital cataloguing systems, GRIPHOS, was released in 1967 and some museums use it even today.(1)
What has changed since then is the amount of data such digital catalogues can store and the fact that digital datasets can easily be shared online.
Publishing their digital collections on their website has become the norm for cultural institutions. Now many are asking, what more can be done with these vast resources of cultural data? (2)
Research Background
This research constitutes a part of Florian’s PhD completed in 2016 at the Royal College of Art. It was supervised by Professor Stephen Boyd Davis (formerly of Middlesex University) and jointly funded by the EPSRC (Grant number EPSRC EP/J502169/1) and System Simulation Ltd.
The project builds on Stephen’s ongoing research on historic visual timelines. This includes an earlier visualisation project done in collaboration with MoDA and two students at Middlesex University in 2010. MA students, Emma Bevan and Aleksei Kudikov designed a prototype timeline interface for MoDA’s collection, thereby discovering and having to face the challenges around the visual representation of cultural artefacts in a temporal dimension
Florian is now a Knowledge Graph Engineer & Digital Humanities Specialist at the Swiss Art Research Infrastructure (SARI), University of Zurich

Prototyping
I worked closely with researchers and curators within cultural institutions including Lucy Walker from the Britten Pears Archive in Aldeburgh and David Rooney from the Science Museum in London. These are people who have in-depth knowledge of cultural collections and are the potential beneficiaries of visualization tools.
Together we discovered what kind of insights we could gain through visualizing their collections in prototype tools. We also discussed how the tools should be designed in order to answer the research questions that were often triggered by interacting with the visualizations.
As a result, I developed a visualisation tool for the Britten Pears Archive which mapped the sources of Britten’s song lyrics over time.
Preliminary Findings : Visualizing Collections
By visualizing collections data, users are able to ‘see everything’ in a collection. Having an overview is useful for both casual and expert users. Even curators who are very familiar with a collection are not necessarily able to grasp it in its entirety.
Presenting collections data in a visual way also meant we could begin to see how digital collections are not simply representations of physical archives. Initially, when I asked curators what they would like to find out with visualization tools, their questions largely revolved around the artefacts in their collection and would not necessarily require digital tools to be answered. During the research it became evident that digital collections store not only data about artefacts, but contain traces of the history of an institution; they reflect biases, beliefs and shifting focuses in collecting.
Cultural collections used to be seen as neutral representations of the past, but they are actually formed by the people that make and use them. These are issues that curators may be aware of, but until this point they did not have ‘tangible’ or ‘visual’ evidence.
Through appropriately-designed timeline tools, we can begin to make this embedded ‘hidden data’ visible.
The patterns that emerge can tell us about the history of a collection, the influence of individuals, and how different events have shaped the content of archives.
By visualizing digital collections we can not only examine their contents, but – more importantly – see the different ways people have collected and catalogued artefacts over time.
Collaboration with the Museum of Domestic Design and Architecture
Initially curators were primarily interested in visualizing collections data to find out more about the items in their collections. But our discoveries led them to ask questions about their own institution and the way they and others have worked with a collection over the years.
Florian’s work built on a visualization of MoDA’s collections that was developed by Middlesex MA students Emma Bevan and Aleksei Kudikov in 2010.
Working with Zoë Hendon at the Museum of Domestic Design and Architecture (MoDA) gave us a chance to look deeper into these questions.
Museums not only use databases to catalogue their collections, but also to manage and document all the processes involving collections, including acquisitions, exhibitions, loans, etc. While museums tend to focus on the lives of objects before they entered their collections, these ‘procedural’ aspects of their datasets are telling of the lives of objects as museum artefacts.
Usually this data is removed when institutions shared their collections online. But Zoë provided us with an export of MoDA’s digital collection that included both data that described artefacts and data that described exhibitions and publications.
Visualizing this data on new kinds of timeline allows us to discover the lives of things as museum artefacts and, on a broader scale, the usage patterns and changing uses of a cultural collection as a whole.
From this usage data we are able to gain important intellectual insights, and also to derive evidence for museums to demonstrate the public interest and value of their collections – something which is becoming increasingly important for cultural institutions.
Visualizing Relationships: MoDA’s Collections
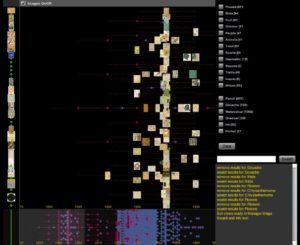
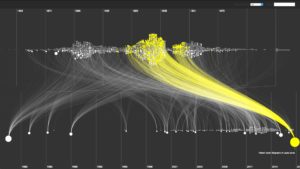
I developed a double timeline layout to map the relationships between items in the collection and their usage in different projects over time.
Objects are represented as bubbles in the upper row of this visualization, in which the dates run from 1880 to 1960.
A curved line links each of them to a ‘procedure’, (which can stand for an exhibition, a publication or a research project).
To see how this works, feel free to try the interactive version of the visualisation yourself.
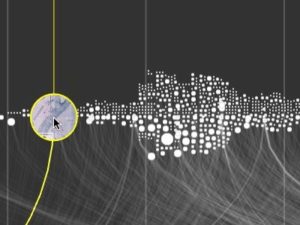
Highlighting an object reveals the corresponding thumbnail image, where available.
Museum objects from MoDA’s collections are represented as bubbles in the upper row, organized by their assigned date of production. The size of each bubble corresponds to how often a particular object appears in ‘procedures’, which are represented by the bubbles in the lower row. Hovering over one bubble highlights the corresponding records in the other timeline. It is also possible to search and filter the content of the visualization.
Project Findings
In the objects timeline, the largest bubble represents a Silver Studio design that has been widely used in exhibitions and publications.

The visualisation showed that this design for the decoration of a wall and door by Arthur Silver, of around 1885, is MoDA’s busiest object.
It has travelled to numerous exhibitions, and has featured in countless publications and exhibition catalogues since the early 1980s.
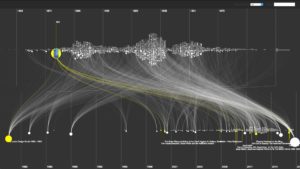
The largest bubble in the procedures timeline represents work on the biography of a Silver Studio designer called Lewis Jones. It branches out to numerous objects whose production dates correspond to the time Lewis Jones (1894–1953) worked for the Silver Studio – with one outlier that likely bears an incorrect production date.
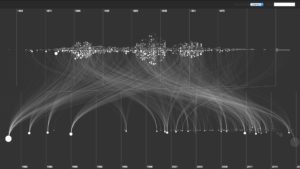
Filtering the procedures by their type allows us to get a sense of the different contexts the collection is being used as well as how these are distributed in time.
We can, for example, compare ‘Exhibition’ with ‘Research’ projects. We see that a considerable part of the collection has over time been exhibited and that exhibitions have taken place since the early 1980s.
This is fascinating because it demonstrates very clearly just how many objects from MoDA’s collections have been part of scholarly conversations over the years.
Research Implications
Florian’s research reveals something very interesting about the number and range of MoDA’s objects that have featured in exhibitions, publications and other activities over the years. One of the next steps would be ask how we might feed back the insights offered by this tool into the work of curators.
For example, are there parts of the collection that have received no attention at all, and could that be a new area for research? Might this change the way that curators think about the objects in a collection, both individually and as a whole?
But also, how reliable are these findings? Have the objects that don’t appear associated with a Research or Exhibition procedure really never been researched or exhibited? Can we include more data to offer new perspectives on a collection?
Another student working with Professor Stephen Boyd Davis, Olivia Vane, is currently doing a placement with the digital team at the V&A. Data visualization clearly offers a lot of potential to change the way we think about and understand museum collections.
If you are interested in developing similar projects please do get in touch -we would love to hear from you.
References and Further Reading
(1) Williams, D., 2010. A Brief History of Museum Computerization. In R. Parry, ed., Museums in a Digital Age. New York: Routledge, pp. 15–21.
(2) “Collection metadata is both a key asset representing centuries of person years of investment and a potential enabler for current operations and future developments. However, despite its strategic importance for numerous stakeholders, the potential value […] remains under exploited.” The British Library, 2015. Unlocking The Value – The British Library’s Collection Metadata Strategy 2015-2018. London: The British Library. Available at: http://www.bl.uk/bibliographic/pdfs/british-library-collection-metadata-strategy-2015-2018.pdf
For academic publications about this research please follow this link.