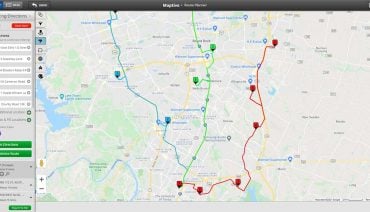
Maps have come a long way from the general reference maps of the past. While they were once only used for directions and getting from point A to point B, today’s maps display all kinds of data and findings.
This is where thematic maps come in. If you’re looking to use a map to tell a specific story then you’ll likely need to utilize some kind of thematic map to do so.
Keep reading to learn everything you need to know about this useful map variation.
Thematic maps are single-topic maps that focus on specific themes or phenomena, such as population density, rainfall and precipitation levels, vegetation distribution, and poverty. This differs from reference maps which include a number of different elements like roads, topography, and political boundaries.
Thematic maps have attributes that make spatial patterns more clear, shedding new light on the theme in questions and allowing for further insights.
These maps are very useful when you want to analyze the spatial distribution of your information, or look for any geographic patterns and trends contained within your data sets. They are also an excellent way to search for correlations between data in two different locations.
There are likely a number of important insights contained in your data that may not be evident when viewing it in a spreadsheet. Thematic maps let you visualize your location-based information and bring it to life, making those insights much easier to spot.
There are many different types of thematic maps available through GIS software. Here are six map types you should be familiar with:
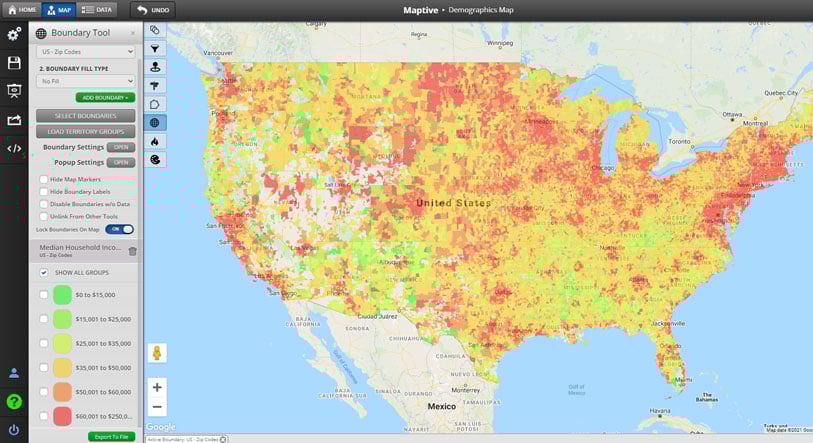
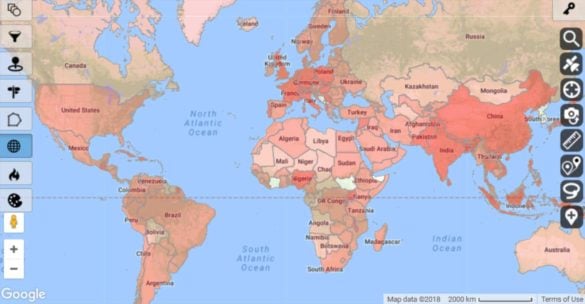
Choropleth maps represent data values in geographic areas with different colors and patterns. Data is categorized into classes, with each class assigned a unique color or pattern.
For example, if you’re mapping sales data you could classify any sales amount under $5000, yellow, amounts between $5000 and $10,000 orange, and amounts over $15,000 red. Those colors are then used for different sales territories so users instantly know which category a territory falls into.
Bivariate Choropleth maps allow creators to visualize two variables of data into color-coded or patterned classes at the same time.
This type of thematic map is best for businesses or organizations looking to analyze contrasting data sets, run competitor analysis, compare year-to-year performance, and more. However, Bivariate Choropleth maps are inherently more complex than traditional Choropleth maps, making them more likely to become cumbersome or difficult to read.
Value by Alpha maps are a form of Bivariate Choropleth maps where two variables are color-coded or patterned on the same map—then weighted by transparency to reflect the concentration of data. The more opaque the data, the more data exists in that class.
Value by Alpha maps are often used to track elections, wherein counties are divided into red or blue classes based on votes by party, and voter turnout (the alpha variable) is measured by opacity.
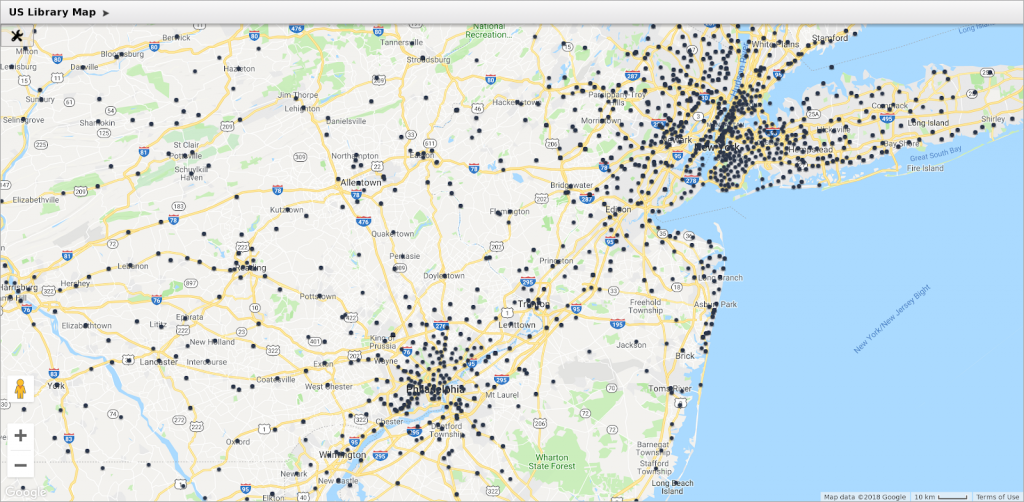
These maps represent each data point with a dot and are a great way to measure density. Regions with a large number of dots packed close to together are easily identified as high-density areas, whereas regions with few or no dots are clearly areas where your data is lacking.
Dot maps have been around for a long time but are still extremely popular due to their simplicity and wide range of applications.
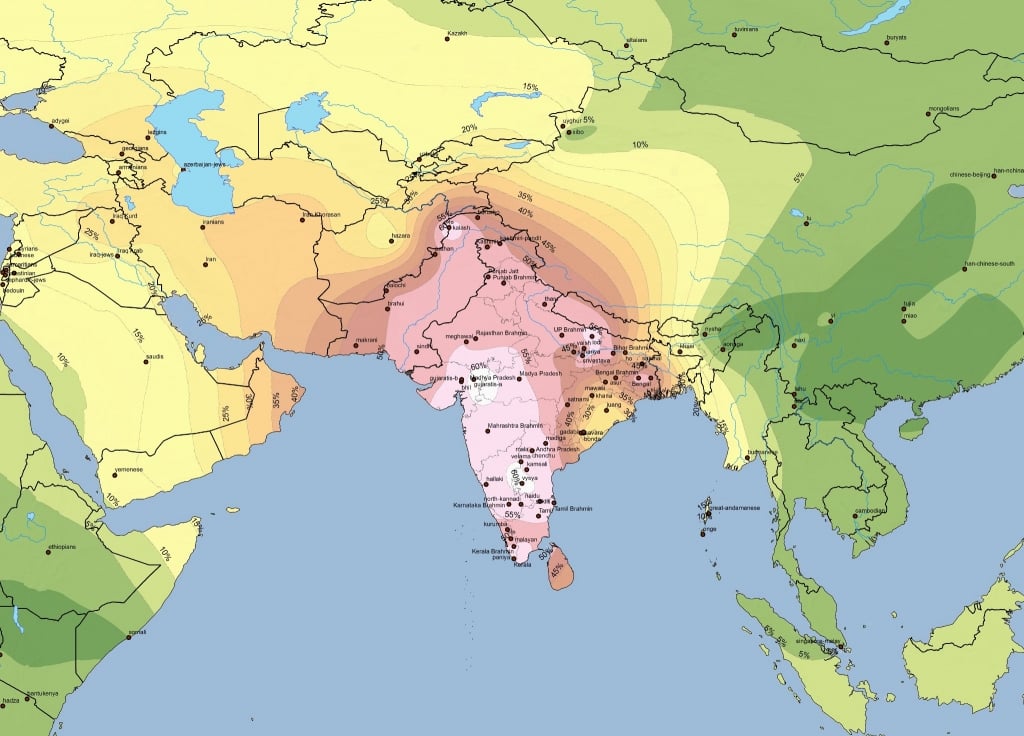
Isopleth maps use colors and shades to represent data, similar to choropleth maps. However, they differ in that data isn’t grouped within predefined boundaries such as census tracts, counties, or states.
Instead, contoured lines divide the map into different areas and show where data levels change.
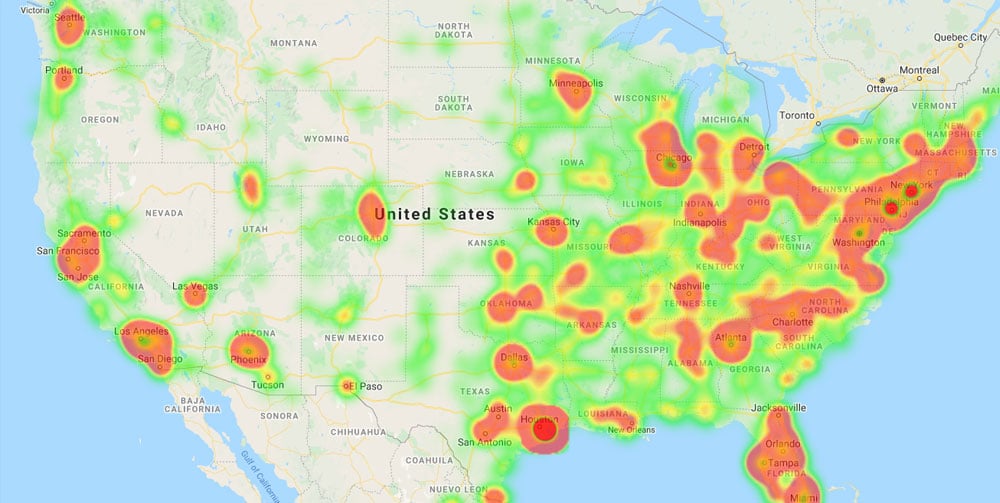
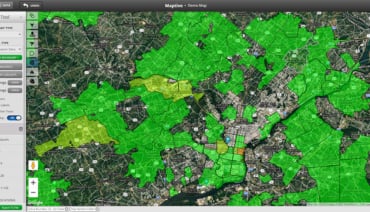
Heat maps measure density across a map. Like many other map types, they represent data using color. Darker shades indicate higher density areas while lighter shades show lower density areas.
This type of map doesn’t use geographic boundaries. Instead, it works similarly to a dot density map. Plot individual data points on the map with colors assigned based on the distribution and number of points in a given area.
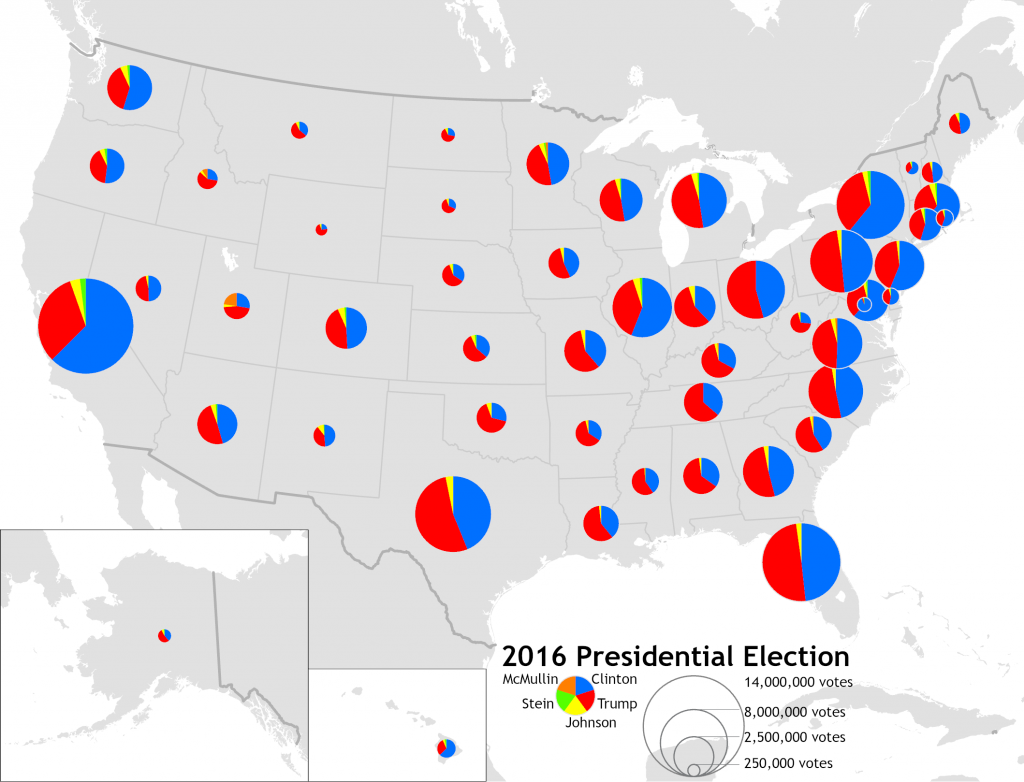
These maps show data using varying sizes of symbols. Larger symbols represent higher concentrations of data while smaller symbols represent lower concentrations of data.
Similar to choropleth maps, data is placed into different categories. However, instead of color or shades representing data, different symbol sizes stand in for data categories. The number of symbol sizes depends on the number of categories you decide to create.
If you don’t want to divide your data into classes you can use a proportional symbol map, which scales the size of its symbols with an absolute magnitude.
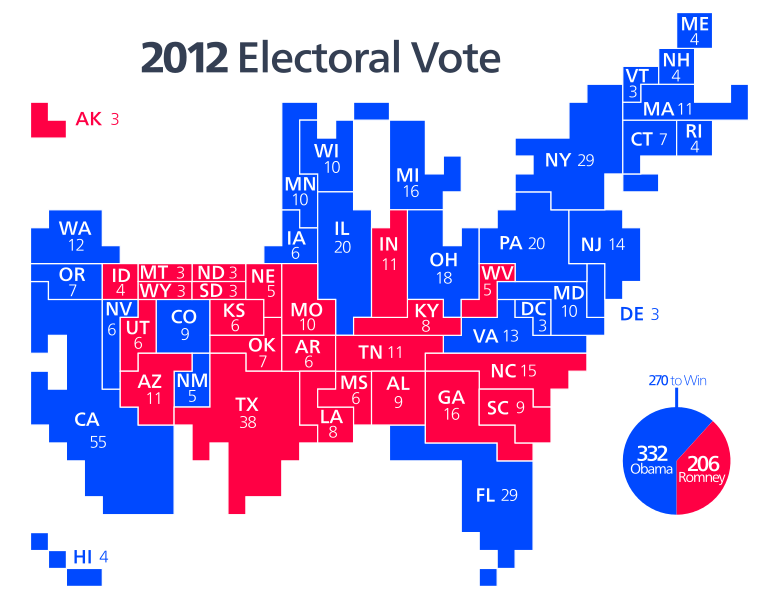
Cartograms visualize the concentration of data in a boundary by distorting its shape and size relative to other geographic areas on a map. While good for presenting the variance in density of data, cartograms tend to be hard to read and aesthetically displeasing.
Cartograms provide a great value. However, the types of thematic maps listed above also measure the density of your data without sacrificing your map’s legibility and realism. Therefore, cartograms are not good for thematic mapping if you require an accurate representation of your chosen geographic area.
Want to build your own interactive maps to customize and share? Sign up for a free trial and start creating your maps today.