The story so far, in one picture

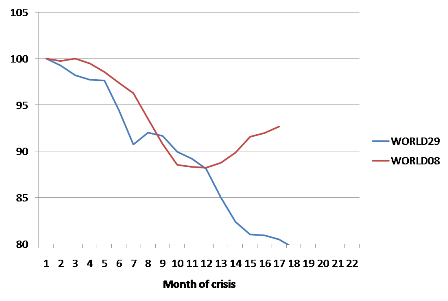
World industrial production in the Great Depression and now:
DESCRIPTION

Data for the Depression courtesy of Eichengreen and O’Rourke. Data for the Great Recession (starting April 2008) from Netherlands Bureau for Cyclical Economic Analysis.

Basically, we started out with a year that matched the Great Depression, but have since pulled back a bit from the edge of the abyss.

Comments are no longer being accepted.

Of course, we’re still in the early stages compared to the Great Depression data in the graphs. We have to see what the next few years bring.

This does look better than things feel; guess we may be myopic over here and should take more of a global view instead of just U.S.

btw – can’t wait to see tomorrow’s front-page companion piece about the Carlyle Group war profiteers to go with John Broder’s piece today about Al Gore; holding my breath for that one.

Also, since GS made a handy $1 billion yesterday by betting CIT would fail, and since the tax-payers saw $2.3 billion go up in smoke, wonder if any funds flow back to the Treasury – maybe a little lagniappe ?

Appears that the turn in production occurred 8-9 months ago, i.e. before the Democratic Stimulus Package had any effect.

I wonder how much of the turn-around is due to China and , to a lesser extent, India having the capacity and economic knowledge to start a big expansionist spending policy quickly after the crisis begain. I the the west in general and the US in particular also started the same type of policies but their response was limited by their collective overblown fear of deficits. I think the BRIC (or at least BIC) countries are going to be the key to a sustained recovery and I hope they keep their doors open enough to allow the rest of the world to recovery as well.

Joseph O’Shaughnessy November 3, 2009 · 10:02 am

Yeah, well, we had better tell the Neocon Obstructionist Party that this line could drop down again pretty rapidly if we don’t start looking for solutions to unemployment that do not include more government bail-outs.

It is time to shake up the investment community. Someone has to administer a explosive suppository to our Secretary of Treasury and our White House Chief Economics advisor and point them towards Wall Street.

This is serious. We need jobs starting yesterday. If it doesn’t happen soon, that red line will drop through the floor.

That is one of the most encouraging images I have seen in quite some time. Too many people simply do not realize that the world economic system experienced a Collapse (capital “C”) last autumn. If this upturn in the WORLD08 line on the graph can turn from a grin into a big, broad smile, they’ll be spared some very painful lessons of the bliss v. ignorance sort. That’s fine by me, as the pain has been plenty severe in any case already, for the ignorant and the informed, the blissful and the bleak alike.

Zombies in Economics

When economists are comparing cycles from before 1984 with after 1984.
Industrialized economy developed into a service economy developing into an IT economy.

When economists are comparing employment data from before 1984 with after 1984.
Using mathematics it is easy to see that something very special happened the last four years.

When economists… I can go on and on but economists don’t like Change. Better to stick to old time religions and when we are swimming in the debt swamp: No one had a clue.

What is forgotten is Economic History with focus on how Keynesian policies have affected the real world. How it was done with Keynes is mentioned by Eichengreen in “The European Economy since 1945. Coordinated Capitalism and Beyond” chapter two: The effects are hard to find.

And the updates of Eichengreen and O’Rourke, same site:
“New findings: World industrial production continues to track closely the 1930s fall, with no clear signs of ‘green shoots’.”

You need a label on your y-axis! I assume it is an index of relative world industrial production.

And what this suggests to me is that monetary policy has been effective EVEN AT THE ZERO BOUND.

The turnaround happend in Q1 2009 – Ben Bernanke did his job.

No more horrible Stimulus Bills, please!!!

That’s a graph of *world* Industrial Production, not the U.S., which has barely flattened. If you graphed the US Ind. Prod. in a similar manner, the graph would have dropped even WORSE than the Great Depression, falling all the way down to 85.2. Since bottoming out in June, it’s risen back up to 87.6. Granted that’s still a rise. But it’s the only coincident indicator showing any signs of life.

What this really shows is that Obama’s policies saved China, Germany, Brazil and a host of other countries at US taxpayer expense. So Paul, are you bragging that he saved the rest of the world, or complaining that the U.S. is a minor participant in the rebound?

Did you know that according to Brian Wesberry government spending has made the economy worse?

The link you included for NBCEA directs us to data on world trade. Do you have the link for the world industrial production data?

Hi Professor K,

I’m quite surprised that global production levels have risen for that long already; it’s a shame we’re not really feeling it yet. I still remember you referring to those months when global production levels this crisis were below that of the Great Depression during that series of lectures you did at the LSE.

Thank you for your continued blog posts, you are an inspiration to a very curious gap year student.

Some people here are acting as if the US government was the only entity in the world that did anything about the recession.

I would like to see someone put the 1939 Depression on this chart.

//1.bp.blogspot.com/_pMscxxELHEg/SsdKai2JmWI/AAAAAAAAGgM/69Fd8pPGr0s/s1600-h/2007Revised.jpg

Employment numbers give a more realistic picture of how the country is doing than GDP or industrial production.

The chart in my previous comment should have been attributed to Calculated Risk.

//www.calculatedriskblog.com/2009/10/comparing-employment-recessions.html

Wow, what a pretty picture.

All hail science!

Now, of course, there is the aspect of its direct application in this case that pertains to entities other than lab rats…but, hey, let’s worry about that later. Let’s celebrate the fact that dearth and famine was headed this way and instead of hearing about Malthus an alternative was discovered.

And the only issue now is will the alternative be able to survive those who simply don’t want it to succeed?

Thanks!

I’m just curious about where the Great Depression curve goes from here. I’m guessing it continued down and stayed there for most of a decade?

This reassuring graph does suggest that the system today has damping effects that were absent in the 1930s?

Prof. Krugman,

Something in the graphs strikes me as worthy of further analysis: look at how steep the “red line” gets between month 7 to month 10. It looks really, really scary. Then, suddenly, once it reaches the 10 month, full stop. What accounts for this sudden and abrupt change in the trajectory? Is it the effect of government action, of stimuli all over the world?

Thank you for your commitment to make economics available for non-economists.

Good show, Professor Krugman!

Now if “World” would pony up for the “defence of freedom and prosperity” I would breathe a lot easier.

For some reason there appears to be little headway in that direction. Seems odd, since Barack Obama’s election was heralded the world over as a new era of mutual understanding between countries. He received the Nobel Prize because he is seen as somebody who understands the need to work “together” with others in forging peace.

I guess not everybody is willing to share the “pie”.

I’m not an economist, just a poor underpaid engineer, but as far as I’m concerned, growing income inequality is the root cause of the current crisis, and I don’t really care what economic theory this falls under, but income inequality is a political choice that needs to be remedied PRONTO.

We have greatly increased productivity during the last decades, but the gains have mostly accumulated at the top layer of society. Since the rich already consume as much as they want (more or less), there is no corresponding increase in demand for that increased productive capacity. Since we produce more with less people, there is less demand for workers. Thus higher unemployment; thus more competition for jobs; thus lower wages; thus even more wealth transferred to the rich; thus less demand; thus more layoffs; thus …

Starting with Reagan, most productivity gains has been captured by the rich. The middle class has tried to keep up by reducing savings and going into debt. But you can only borrow so much before the inevitable day of reckoning arrives. It took 25 years for it to show up, bit it’s here, and we have to deal with it.

It’s real simple, double the productivity, allow the top 1% to horde all the gains, then because only half the workers are needed, there is massive unemployment. Whatever economic theory this is, it needs to be fixed NOW.

Your graphic is a bit dishonest: if you see the original, you can see, with the original scale, that the improvement in world industrial production is more modest than what it is show in your graph.

You can’t say nothing more with this part of curve.

There are still bubbles to burst that were not a part of the marketplace in 1928.

There was no such thing as consumer credit, credit cards didn’t exist before the 1950’s. Today there is $3 trillion in unsecured credit card debt that is increasingly falling into default.

Foreclosures are still on the rise.

Job losses continue.

Commercial real estate loans are falling into default status.

The simple formula is no job creation = no recovery.

A picture says a thousand words-in this case “Oh look Keynesian economics works!”

The difference is due to aggregate payroll cuts – ongoing reductions in work hours and and wage rates, that occured during the depression but not in this recession (or any post-WW2 recession). Aggregate payroll cuts killed aggregate demand. This is what caused the great depression.

It has nothing to do with ‘money supply’, ‘animal spirits’ or ‘stimulus’.