Harlem Success Academy Charter and Attrition
Update: Response to Michael Regnier and a couple caveats.
The new Common-Core-aligned New York state tests have, as expected, caused test scores to crater. Among the few who emerged from the wreckage seemingly intact are the numerous Success Academy charter schools, of which there are seven just in Harlem. Eva Moskowitz, former city councilwoman, and union-wary founder of the network, has engineered its rapid expansion, inviting no shortage of controversy.
But kids in these schools tend to do well bubbling answers on standardized tests. As the New York Post reported, “Of the 1,500 kids in her Harlem and South Bronx schools who took the Common Core exams, 82 percent got a passing score in math, and 58 percent passed English…. Across the city, the pass rates were 26 percent in English and 30 percent in math.”
Teacher-blogger Gary Rubinstein takes miraculous charter achievement claims with a grain of salt. As accolades fall upon Success, Rubinstein points to their significant student (and teacher) attrition numbers. He writes,
If they ‘lost’ many students, these scores are tainted. Now there is only one Success school that has been around since 2007. That school started with 83 kindergarteners and 73 first graders. Those cohorts just tested in 6th and 7th grade, respectively. The school has ‘lost’ a big chunk of those original 156 kids. Of those 73 first graders in 2007, only 35 took the seventh grade test. Of the 83 kindergarteners, only 47 took the sixth grade test last spring. Overall, they have ‘lost’ 47% of the original two cohorts. If this is one of the costs of having such high test scores, I’m not sure if it is worth it.
For the four cohorts that just took the fourth grade tests, those 316 students were, back in 2009, 443 kindergarteners, so they have ‘lost’ 29% of those cohorts. Now their high test scores aren’t completely explained by this nearly 30% attrition rate, but it is still something worth noting as we consider if this program is ‘scalable’ or not.
It’s true that Success owes its success to more than just general student attrition. But Rubinstein only examined the overall numbers. When you look at specific student demographics, even more troubling patterns emerge. I’ve been dissecting the student data of prominent NYC charters since Democracy Prep and I sparred over its unmistakable pattern of steadily losing students with disabilities and students learning English. (They promised a “debunking” of my post. I’ll assume it’s still forthcoming.)
At Success, the pattern is similar, if not more stark. Not only do its classes contain disproportionately few students with disabilities and English language learners (ELLs), but their numbers almost invariably decrease with each passing year. This should have no uncertain effect on test scores.
Here’s what their attrition* among students with disabilities looks like. (Like Rubinstein, I was only able to pull data from its flagship Harlem school, as the others are too young to afford meaningful information.)
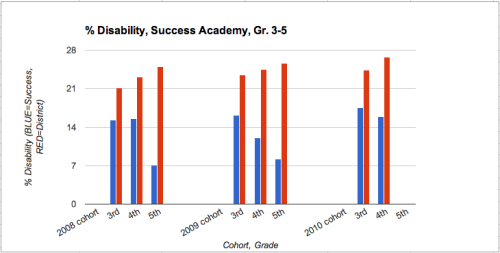
Clearly, the ranks of students with disabilities consistently dwindle. The pattern for students learning English is less consistent but equally egregious. In the first two years of available data, there were hardly any ELLs. In 2010 Success suddenly came up with a nearly representative portion of these students, but their numbers more than halved by the next year. (2012-13 data isn’t yet disaggregated by student demographic.)

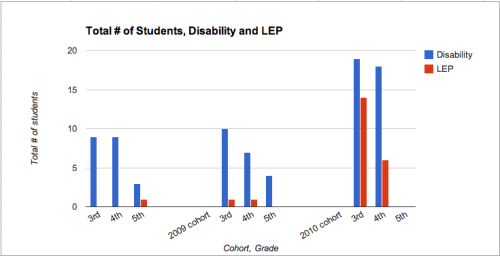
The above charts show the change in ELLs and students with disabilities as a percentage of their cohort. As Rubinstein has demonstrated (and as I’ve also found), those class sizes themselves decrease, so it’s instructive to see how the absolute numbers of these challenging students change.
What’s sad about this is how unsurprising it’s become. High-achieving charters, with no exceptions that I’ve found, enroll fewer needy students, witness substantial attrition of these students, or both. These patterns could reflect some implicit policy, or they could result from the extraordinary behavioral demands charters impose on students. The proximate cause doesn’t matter so much when it comes to test scores, though. Scores resting on high-needs student attrition shouldn’t withstand even the mildest scrutiny, yet they garner unreserved praise from the likes of Mayor Bloomberg and the Post.
It’s just an added irony that one of Moskowitz’s Success expansions literally pushed at-risk students out of an existing school.
I need not dwell on how disturbing all this is. Any notion of success should be predicated on serving the neediest students right alongside those who make “no excuses.” Anything less is reprehensible.
*UPDATE 8-22-13
Michael Regnier of the New York Charter School Center linked to this post as an example of “ignoring the limitations” of available data.
Admittedly, I didn’t mention the possibility that re-assignment of ELL and IEP classifications explains declining numbers. Nor did I bring up retention as a factor. Mea culpa.
I dealt with both of these possibilities in my Democracy Prep post, however, and the problems I brought up there also apply here.
As regarding ELL reassignment, I imagine you’d see students passing the NYSESLAT test for English language learners in the years before ELL numbers dipped. Those don’t show up in the state report cards.
As for retention, logic holds you would see a bounce in the number of students with special needs the year after a bunch were putatively retained from a class. Though that appears to occur in the third graph (above) in the 2010 cohort, that actually just reflects a much larger overall incoming class. The proportion of students with special needs is still below average (see graph 1).
Is it possible that retention and re-classification contribute to sagging numbers of ELLs and students with special needs at these charters? Yes, these could play a supporting role. In fact, I’ve been told by special education advocates that students with special needs often leave because they’re being held back too often.
But playing a part and driving the pattern constitute two very different things. Regnier writes, “What we don’t know, in other words, is a lot. We need better data. But ignoring the limitations of what we have, as Davis does, is no help.” It’s also no help to categorically dismiss evidence of a trend like selective attrition simply because other factors may play a part. I’m challenging charters to evince clear evidence of retention and reclassification because they actually have the power to do so. I’m left waiting for them to respond, or the city to change its data practices.
So far it’s been nearly a month since Democracy Prep promised a “full debunking" of my post, and Success has emailed me promising explanation. I wait with bated breath.
Notes
whitehotharlots liked this
strawrox-blog liked this
wonderfulslumber reblogged this from misseducation-blog
misseducation-blog reblogged this from commonal and added:
I’m not attacking my friends who are working in charter schools, I’m not attacking my friends who I think work/ed at...
coopmike48 reblogged this from commonal
commonal posted this