


Abstract
Natural genetic variation makes it possible to discover evolutionary changes that have been maintained in a population because they are advantageous. To understand genotype–phenotype relationships and to investigate trait architecture, the existence of both high-resolution genotypic and phenotypic data is necessary. Arabidopsis thaliana is a prime model for these purposes. This herb naturally occurs across much of the Eurasian continent and North America. Thus, it is exposed to a wide range of environmental factors and has been subject to natural selection under distinct conditions. Full genome sequencing data for more than 1000 different natural inbred lines are available, and this has encouraged the distributed generation of many types of phenotypic data. To leverage these data for meta analyses, AraPheno (https://arapheno.1001genomes.org) provide a central repository of population-scale phenotypes for A. thaliana inbred lines. AraPheno includes various features to easily access, download and visualize the phenotypic data. This will facilitate a comparative analysis of the many different types of phenotypic data, which is the base to further enhance our understanding of the genotype–phenotype map.
INTRODUCTION
Arabidopsis thaliana is a prime model system in plant biology (1). This is true for developmental biology, where many basic mechanisms have been analyzed, as well as for population genetics (2). Due to its selfing nature, individuals sampled from nature are generally inbred lines, homozygous throughout their genome. This allows efficient collection of many different phenotypes from genetically identical plants – an enormous advantage when studying complex trait variation, in particular the interaction between genotype and environment (3). Furthermore, the lines are direct products of local adaptation. Over the past years, many studies aimed to identify causative genetic variation for a plethora of different phenotypes. The rationale is to link genetic variation, which is present in the population, with observed phenotypic differences. Here, genome-wide association studies (GWAS), which were pioneered in human genetics well over a decade ago (4), constitute a preferred prime tool for such analyses. In GWAS, the effect of each genomic marker on the respective phenotype is assessed and a P-value reports likelihood of the association. To obtain meaningful results, a high marker density is required. In Arabidopsis thaliana, GWAS have been routinely performed using 214 000 markers generated with hybridization technology (5). Nowadays, full genome information for over 1000 different natural inbred lines are available (6, http://1001genomes.org/tools/). This resource is an exceptional genomic data set both in terms of quantity and quality. It allows the re-analysis of existing phenotypic data and has the potential to greatly improve the analysis. To fully exploit the advantages of A. thaliana for connecting genotypes to phenotypes, we are creating a central repository for phenotype data, which complements the central repository for genotype information. As A. thaliana is used for basic research worldwide, the existing collection of phenotypic data are exhaustive, but due to the fragmented nature of the data, comparative analyses are difficult.
To summarize, A. thaliana provides one of the best and most extensive collections of population scale phenotype and genotype data that exist, making the species a perfect tool for statistical method development in GWAS (7–10). These models are nowadays heavily used even outside the A. thaliana community (e.g. human genetics). It is highly likely that the collection of phenotypic data in A. thaliana will grow massively in the future. AraPheno provides a central phenotype repository for these data.
DATABASE CONTENT AND USAGE
AraPheno is a database for phenotypes of A. thaliana. Phenotypes are grouped together into studies. Initially, we added six published studies with a total of 260 phenotypes to the database. The detailed data statistics are summarized in Table 1. We plan to add more phenotypes in the future. At the moment AraPheno contains only published phenotypes, but the framework of the database will also allow the moderated integration of unpublished phenotypes (see future directions). The primary purpose of AraPheno is to provide detailed information about the studies and phenotypes stored in the database. All published phenotypes will be linked to trait ontologies (https://bioportal.bioontology.org/ontologies/PTO?p=summary), which provides a controlled vocabulary to describe phenotypic traits in plants and enables functional grouping of different phenotypes.
AraPheno data content and statistics as of 15. Aug. 2016
| Data content | Data statistics |
|---|---|
| General statistics | |
| Studies | 6 |
| Phenotypes | 260 |
| Accessions | 7425 |
| Phenotyped accessions | 1425 |
| Observational unitsa | 4064 |
| Phenotype values | 52 741 |
| Top 10 Trait-Ontology terms | |
| days to flowering trait (TO:0000344) | 33 |
| bacterial disease resistance (TO:0000315) | 20 |
| seed weight (TO:0000181) | 8 |
| boron concentration (TO:0006043) | 7 |
| cadmium concentration (TO:0006059) | 7 |
| calcium concentration (TO:0006047) | 7 |
| cobalt concentration (TO:0006050) | 7 |
| copper concentration (TO:0006052) | 7 |
| iron concentration (TO:0006049) | 7 |
| lithium concentration (TO:0006042) | 7 |
aObservational unit describes the number of actual physical different plants that have been used, even if they are genetically identical.
| Data content | Data statistics |
|---|---|
| General statistics | |
| Studies | 6 |
| Phenotypes | 260 |
| Accessions | 7425 |
| Phenotyped accessions | 1425 |
| Observational unitsa | 4064 |
| Phenotype values | 52 741 |
| Top 10 Trait-Ontology terms | |
| days to flowering trait (TO:0000344) | 33 |
| bacterial disease resistance (TO:0000315) | 20 |
| seed weight (TO:0000181) | 8 |
| boron concentration (TO:0006043) | 7 |
| cadmium concentration (TO:0006059) | 7 |
| calcium concentration (TO:0006047) | 7 |
| cobalt concentration (TO:0006050) | 7 |
| copper concentration (TO:0006052) | 7 |
| iron concentration (TO:0006049) | 7 |
| lithium concentration (TO:0006042) | 7 |
aObservational unit describes the number of actual physical different plants that have been used, even if they are genetically identical.
Users can either display a list of studies or a list of phenotypes in table form. The primary purpose of the database is to serve as a central repository for all A. thaliana phenotypes, with the potential to store and host thousands of phenotypes. Therefore, we provide a fulltext-search functionality in order to search for specific terms. Further, AraPheno provides access to a detailed FAQ, tutorials and guided tours that should help new users to navigate the site.
Users can obtain detailed information about a specific study or phenotype. In addition, a variety of information (Figure 1A) and interactive visualizations, such as geographic distribution (Figure 1B) of samples and phenotype histograms, are provided. In particular, the Explorer widget matches phenotypic values of the samples to their geographic locations and allows to visually uncover geographic patterns (see Figure 1C).
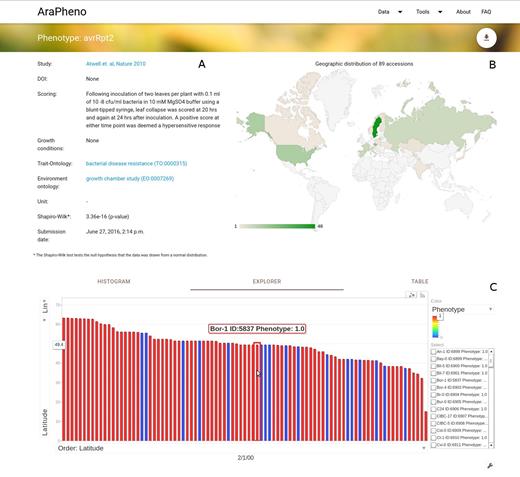
Screenshot of the detailed view for a phenotype of interest (https://arapheno.1001genomes.org/phenotype/43/). (A) General information such as ‘Scoring’ or various ontology terms are displayed in text form. (B) The geographic distribution of the samples that were scored are displayed as a GeoChart. (C) A powerful Explorer widget relates the phenotype value of each sample to its geographic location, thus bringing out potential geographic patterns.
All displayed information can be downloaded by the user in various data formats (CSV, PLINK and JSON for single phenotypes or PLINK and ISA-TAB for complete studies), as well as be accessed programmatically via an REST API. The Representational State Transfer (REST) architecture allows fast and scalable access to the data. Among common data formats, AraPheno will also support the ISA-TAB (www.isa-tools.org, www.isacommons.org, www.miappe.org) that has been developed to generate a standard format for capturing and communicating metadata that are required for the interpretation of experiments (11). This allows not only a direct analysis of the phenotypic data stored in AraPheno with different GWAS tools (e.g. 12, Grimm et al. (2012), arXiv preprint arXiv:1212.4788.), additionally the storing of metadata ensures that the phenotypes are understandable and, in principle, reproducible: an essential step in creating a comprehensive genotype–phenotype map.
AraPheno will provide Digital Object Identifiers (DOIs) for existing phenotypes and studies, as well as for user submitted data. This will enable the citability of individual phenotypes, and encourage the community to upload existing phenotypes, even if the phenotypes have not yet been published. The persistent DOIs will be assigned by DataCite (https://www.datacite.org), a non-profit organization that provides persistent identifiers (DOIs) for research data.
In addition to phenotypes and studies, AraPheno also stores a comprehensive list of all available A. thaliana accessions that have been collected in the wild. This information is connected to the phenotypes and as mentioned above allows users to look at geographic patterns. Furthermore, it also allows the user to have an accession-centric entry point into the database and retrieve a list of all phenotypes that have been scored for a certain accession (Figure 2).
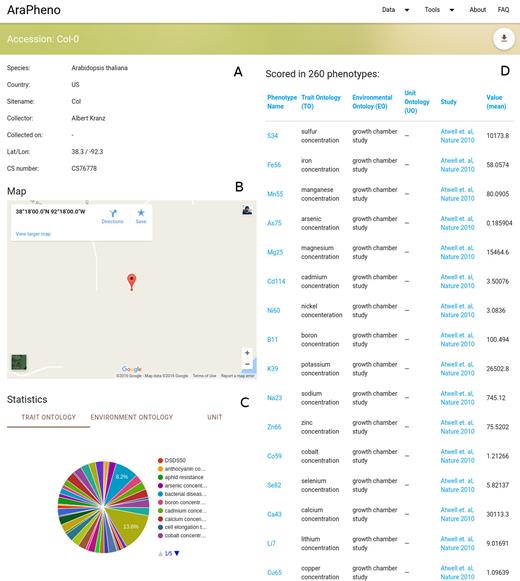
Screenshot of the detailed view for a specific accession (https://arapheno.1001genomes.org/accession/6909/). (A) General information such as ‘Country’ or ‘Collector’ are displayed in text form. (B) A map shows the geographic origin of the accession. (C) Various aggregated statistics about the ontologies for the (D) list of phenotypes that the accession was scored in.
For any organism, different phenotypes can be correlated. This phenotypic correlation can be due to shared genetic or shared environmental effects and many methods try to take advantage of phenotypic correlation to map underlying genetic components (7,13–14). AraPheno provides an easy to use correlation-wizard that allows the user to calculate correlations between a set of phenotypes in real time and to visualize the results in an interactive way (see Figure 3). This tool enables the choice of interesting phenotype combinations for downstream analyses.
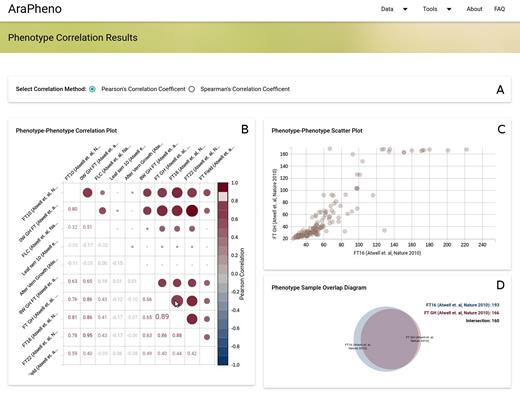
Screenshot of the Phenotype-Correlation results (https://arapheno.1001genomes.org/correlation/6,29,30,31,49,102,99,53,86,39/). (A) User can specify the correlation method (Pearson and Spearman are supported). (B) The Phenotype–Phenotype Correlation Plot displays pairwise correlation values for the selected phenotypes. When the user moves the mouse over a cell the (C) The Phenotype–Phenotype Scatter Plot plots the corresponding phenotypic values against each other and the (D) The Phenotype Sample Overlap Diagram shows the overlap between the two selected phenotypes.
Users, who want submit their own or new studies to AraPheno can easily do this using either a user friendly form at the AraPheno website or the REST API. Accepted submission formats for new data are PLINK and ISA-TAB. Demo files and a detailed description of the process is available in the FAQ section. Once the study is submitted, it will go through a manual curation step. Here, we will check the submission to make sure that relevant information, such as trait ontology terms, proper scoring information and meaningful phenotype names are provided. If any information is missing, we will notify the user to request a revision of the submitted data. Once this is completed, the study and phenotypes will be automatically made public and get an associated DOI.
AraPheno is hosted under the 1001genomes organization (http://1001genomes.org), and its framework will be made available as open source (see Implementation) and under the Arabidopsis Information Portal (https://www.araport.org/).
IMPLEMENTATION
AraPheno has been implemented using the Django web framework (https://www.djangoproject.com/), an open-source and popular web-application framework based on Python and Django REST (http://www.django-rest-framework.org), an open-source REST framework based on Django for the REST endpoints.
Documentation of the REST endpoints are done with the django-rest-swagger (https://github.com/marcgibbons/django-rest-swagger), an open-source swagger implementation for Django REST.
The data are stored in PostgreSQL (https://www.postgresql.org), which is an open-source and high performance database.
The interactive charts were developed using the google charts library (https://developers.google.com/chart), a free library developed by Google and D3.js (https://d3js.org), an open-source and popular JavaScript library for manipulating documents based on data.
For the correlation analysis, as well as the computation of phenotype statistics (i.e. Shapiro-Wilk score), we use scientific Python libraries such as NumPy (http://www.numpy.org), an open-source library for scientific computing for Python, and SciPy (https://www.scipy.org), an open-source library for mathematics, science and engineering for Python, as well as Pandas (http://pandas.pydata.org), an open-source library providing high-performance, easy-to-use data structures and data analysis tools for Python.
AraPheno is deployed using docker (https://www.docker.com), an open-source and popular software containerization platform. Docker enables us to provide a reproducible deployment of the entire AraPheno system without dealing with dependencies. In order to make it easier for others to start their own instance of AraPheno we provide a docker-compose.yml file for both the development version (using sqlite3 instead of PostgreSQL) as well as the production version of AraPheno.
The code for AraPheno is open-source and hosted on github (https://github.com/1001genomes/AraPheno) that allows the user to report issues with the database.
CONCLUSIONS AND FUTURE DIRECTIONS
AraPheno is the first comprehensive database to store phenotypic information for the model plant A. thaliana. As A. thaliana is a natural occurring inbred plant, this information can be easily linked to existing genotype data and can be reused for many downstream analyses. Storing phenotypes together with sample information in a single database is not only a useful resource for the community but also enables researchers to look at the data from different angles and dissect the information in different ways. At the moment AraPheno contains only phenotypes for A. thaliana inbred lines, but the design of the database will enable the integration of mutant phenotypes in the future as well. AraPheno supports searches for specific phenotypes, trait ontology terms or accessions. Interactive visualizations empower the user to uncover interesting patterns in the data and carry out correlation-analysis across the data. Persistent DOIs support unique referencing of phenotypes and attendant analyses, ensuring their citabilty. The submission–curation workflow will make sure that the data available in AraPheno are of high quality and useful to others. So far we have integrated more than 250 publicly available phenotypes from six independent studies, but this number will almost certainly increase markedly over the next years, based on the many still unpublished studies that have already been presented at conferences. The goal is to create a community resource of all phenotypic data in A. thaliana. We will continue (after getting permission of the authors) to upload published phenotypes to the database, as well as enable authors to upload their own phenotypes. This upload will be moderated, to ensure that essential meta-information (e.g. growth conditions, stock numbers and germplasm) is present to enable the interpretation of the phenotypic data. An automatic submission of published studies and phenotypes from easyGWAS (https://easygwas.ethz.ch/) and GWA-Portal (https://gwas.gmi.oeaw.ac.at/) is planned to prevent fragmentation of phenotypic data. This directly links to ongoing efforts to create a central GWAS catalogue for GWAS results in A. thaliana. The easy availability of genotype and phenotype data will enable a plethora of downstream analysis with different GWAS tools, as well as the development and testing of novel statistical methods. The latter is not only limited to GWAS, but will be of high interest for genomic prediction models as well.
ACKNOWLEDGEMENTS
The authors thank the members of the 1001 Genomes Consortium for their insights and discussion. Funding from the ERC (MAXMAP, M.N.; IMMUNEMESIS, D.W.), a collaborative grant from Austrian Science Fund and DFG (SPP ADAPTOMICS; M.N., D.W.), Austrian Academy of Sciences (M.N.) and Max Planck Society (D.W.) is acknowledged. This publication was supported by the Open Access Publication Fund of the University of Würzburg.
FUNDING
ERC [MAXMAP to M.N. and IMMUNEMESIS to D.W.]; Austrian Science Fund and DFG [SPP ADAPTOMICS to M.N. and D.W.]; Austrian Academy of Sciences [to M.N.]; Max Planck Society [to D.W.]. Funding for open access charge: Open Access Publication Fund of the University of Würzburg.
Conflict of interest statement. K.B. and D.W. are shareholders of Computomics GmbH. No other conflict of interest is declared.

Comments