Southeast Report

Come Heat and High Water: Climate Risk in the Southeastern U.S. and Texas

This report identifies the economic risks posed by a changing climate across 11 states in the Southeast, and Texas. The report also highlights the risks to manufacturing, a key driver of recent economic growth in this region.

Explore by region

Executive Summary

The Southeast U.S. and Texas are experiencing an economic boom, mostly due to manufacturing and energy industry growth. But that boom is at risk from unchecked climate change, which could render this region—already one of the hottest and most weather vulnerable of the country—at significant economic risk. However, if policymakers and business leaders act aggressively to adapt to the changing climate and to mitigate future impacts by reducing their carbon emissions, this region can lead in responding to climate risk. The Southeast can demonstrate to national and global political leaders the kind of strong response necessary to ensure a strong economic future.

This region, comprising the 11 Southeastern states of Alabama, Arkansas, Florida, Georgia, Kentucky, Louisiana, Mississippi, North Carolina, South Carolina, Tennessee and Virginia as well as Texas to the west, has witnessed a major recent manufacturing boom, and is poised for further economic growth in the coming years.1 In 2013, manufacturing contributed $2.1 trillion to the U.S. economy—more than 12% of GDP—and accounted for 88% of all U.S. exports, a remarkable 51% increase from declines during the last recession. The region’s economic vitality makes it one of the most productive parts of the country.

But climate change is putting that productivity at risk. While the Southeast and Texas are generally accustomed to heat and humidity, the scale of increased heat—along with other impacts such as sea level rise and storm surge—will likely cause significant and widespread economic harm, especially to a region so heavily invested in physical manufacturing, agriculture and energy infrastructure.

If we continue on our current greenhouse gas emissions pathway,2 the Southeastern U.S. and Texas will likely experience significant drops in agricultural yield and labor productivity, along with increased sea level rise, higher energy demand, and rising mortality rates. In particular, the region’s agricultural sector will be negatively influenced by the changing climatic conditions, with several commodity crops likely to face severe yield declines. Meanwhile, residents and businesses will likely be affected by higher heat-related mortality, increased electricity demand and energy costs, and declines in labor productivity, threatening the manufacturing base that is increasingly driving the regional economy. And in some cities, such as Miami and New Orleans, sea level rise will put significant amounts of existing coastal property at risk.

The mission of the Risky Business Project is to quantify the economic risks to the U.S. from unmitigated climate change. Our inaugural report, Risky Business: The Economic Risks of Climate Change in the United States,3 highlighted these impacts across every region of the country, with a focus on three sectors: agriculture, energy demand and coastal infrastructure. We also looked at overarching issues such as changes in labor productivity and heat-related mortality. This follow-up report focuses on the Southeast and Texas and offers a first step toward defining the range of potential economic consequences to this specific region if we continue on our current greenhouse gas emissions pathway.

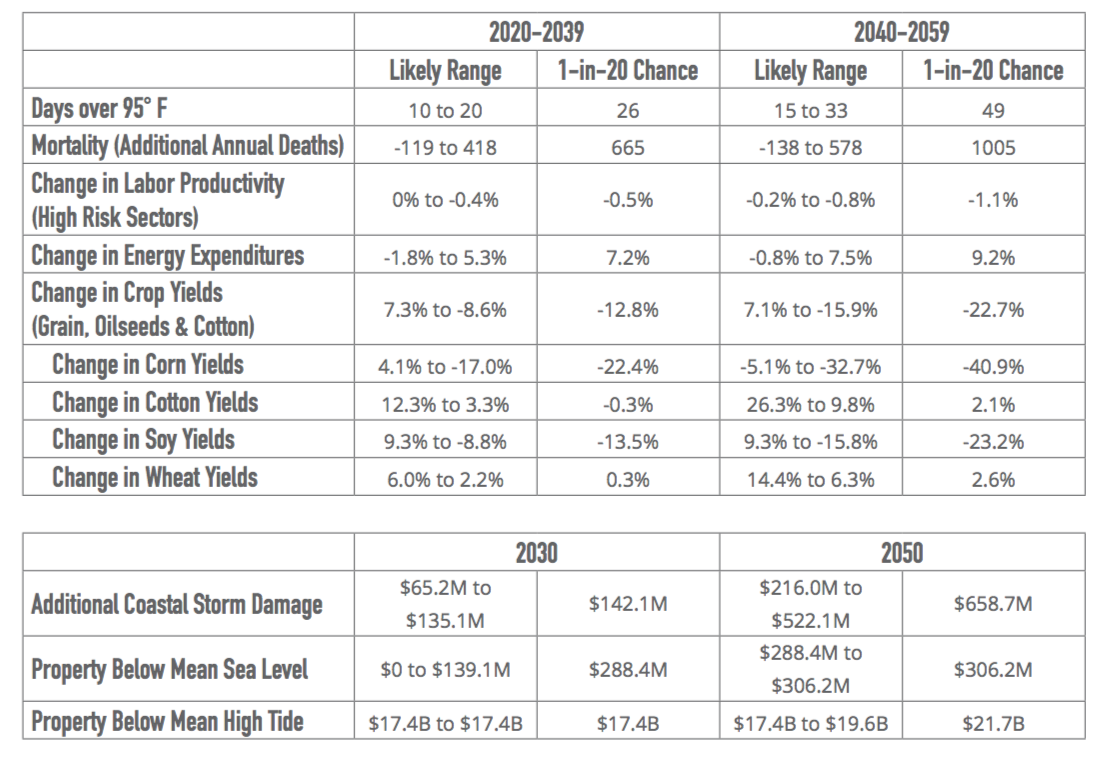
Our research combines state-of-the-art climate science projections through the year 2100 (and beyond in some cases) with empirically derived estimates of the impact of projected changes in temperature and precipitation on the Southeastern and Texan economies. We analyze not only those outcomes most likely to occur, but also lower-probability, higher-cost climate futures. These are tail risks, most often expressed in this report as the 1-in-20 chance events. As in our other reports, we look at climate impacts at a geographically granular level.

Our findings show that if we stay on our current emissions path, the Southeast and Texas will likely experience significant economic impacts due to climate change.

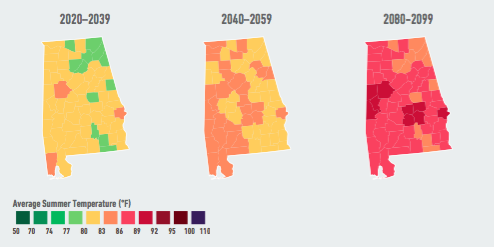
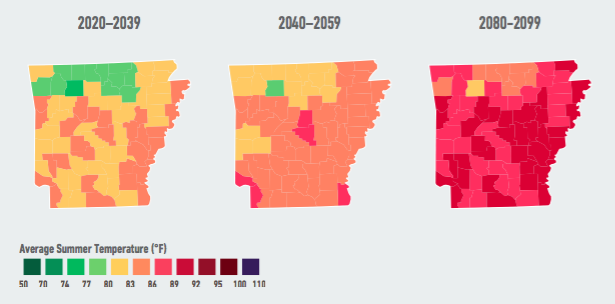
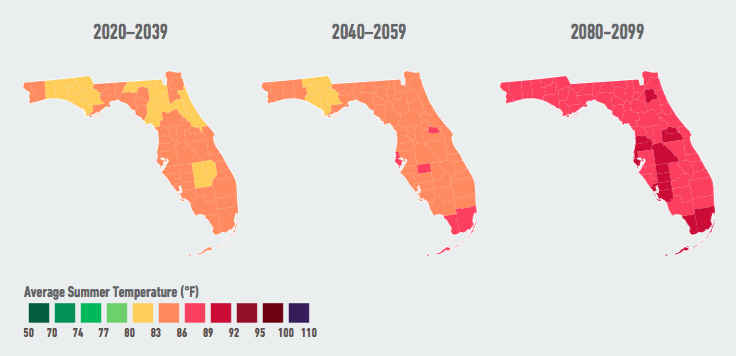
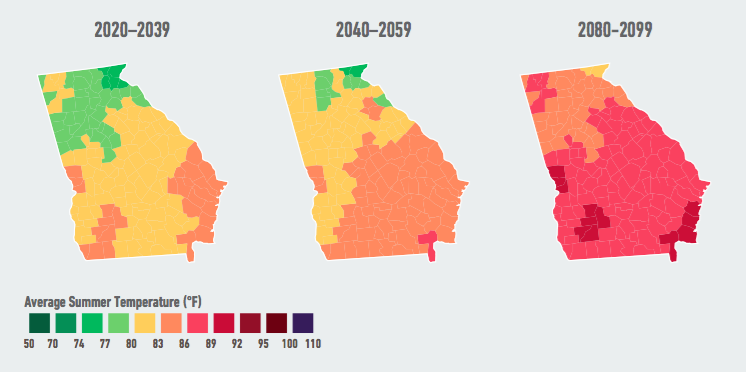
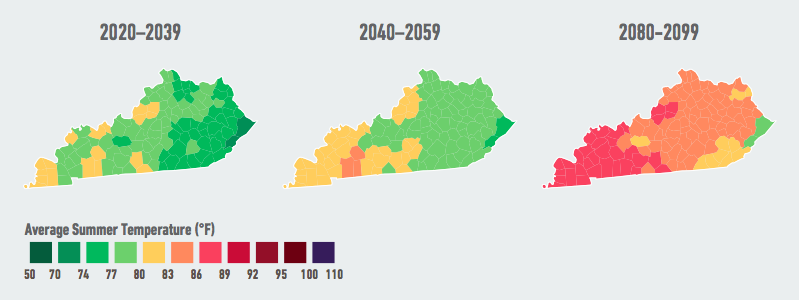
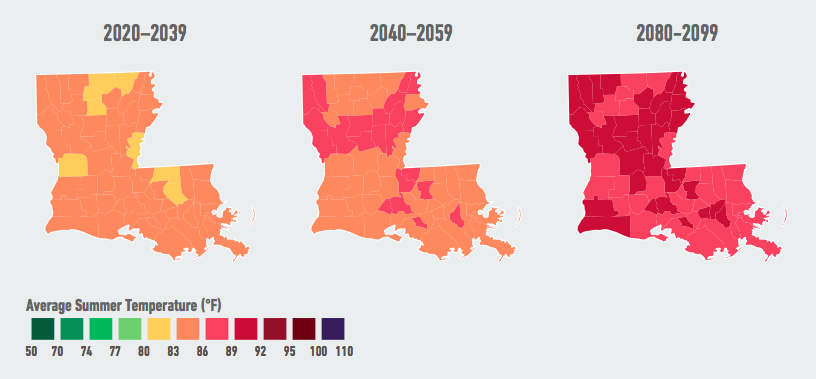
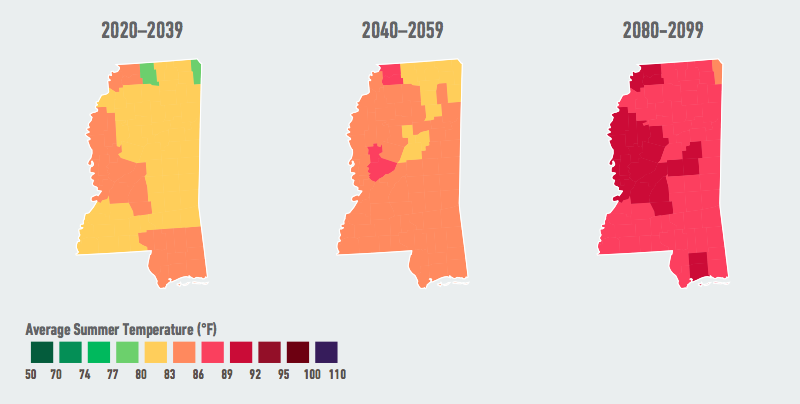
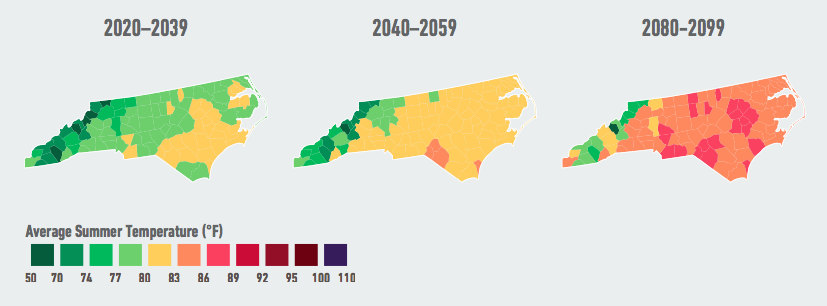
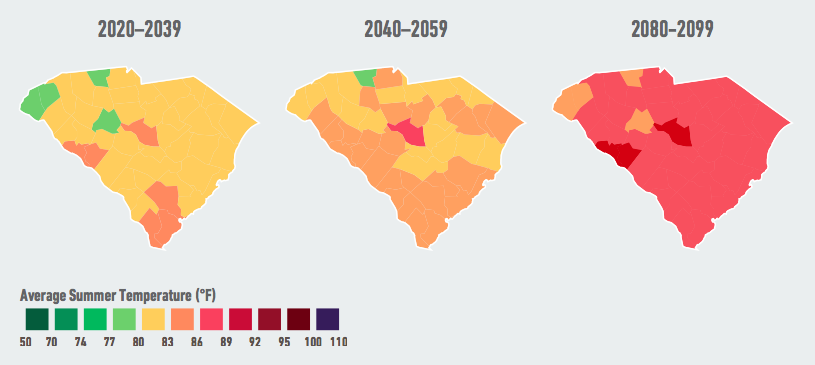
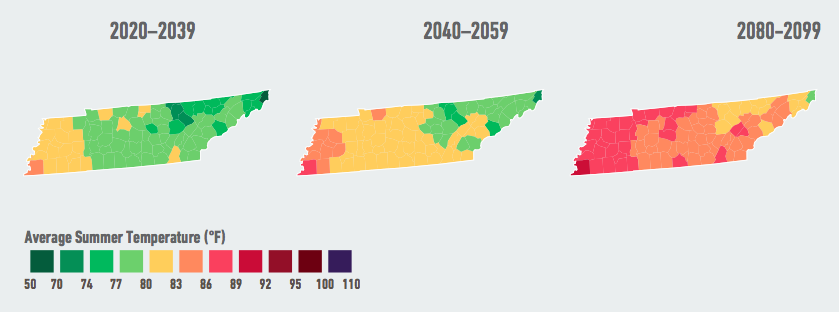
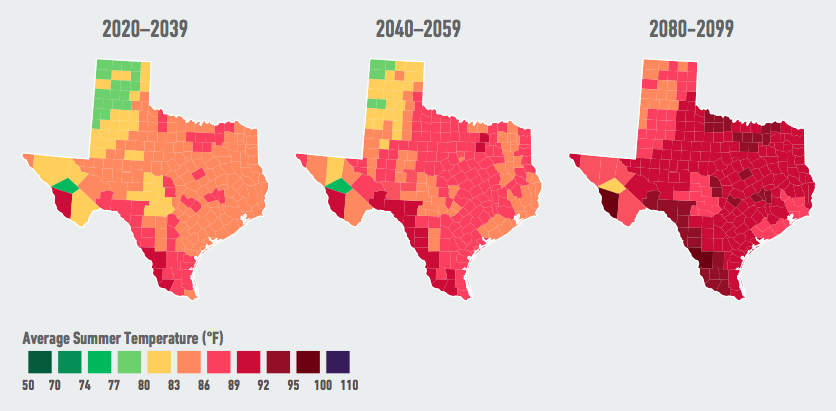
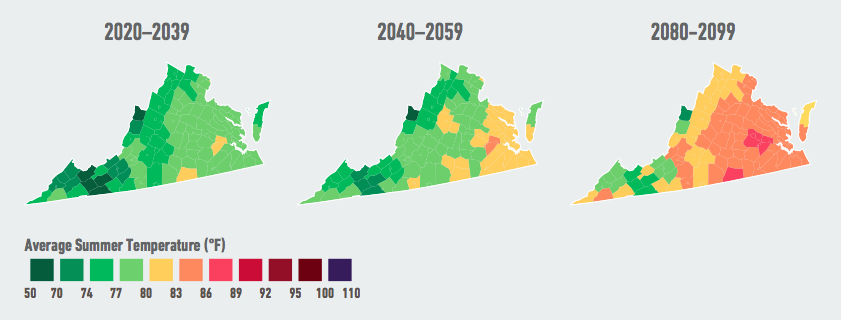
  • By the end of the century, the Southeast and Texas will likely experience dangerous levels of extreme heat.
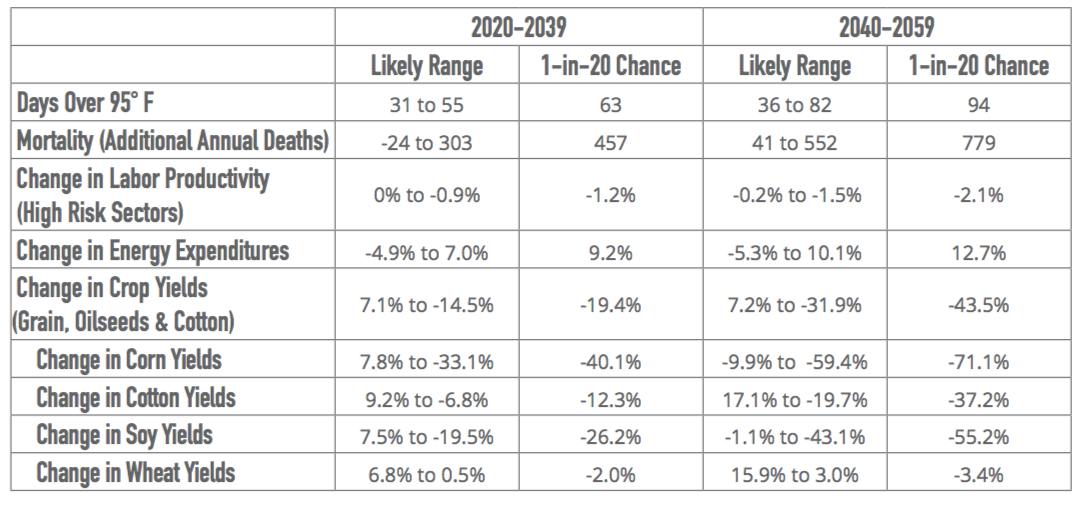
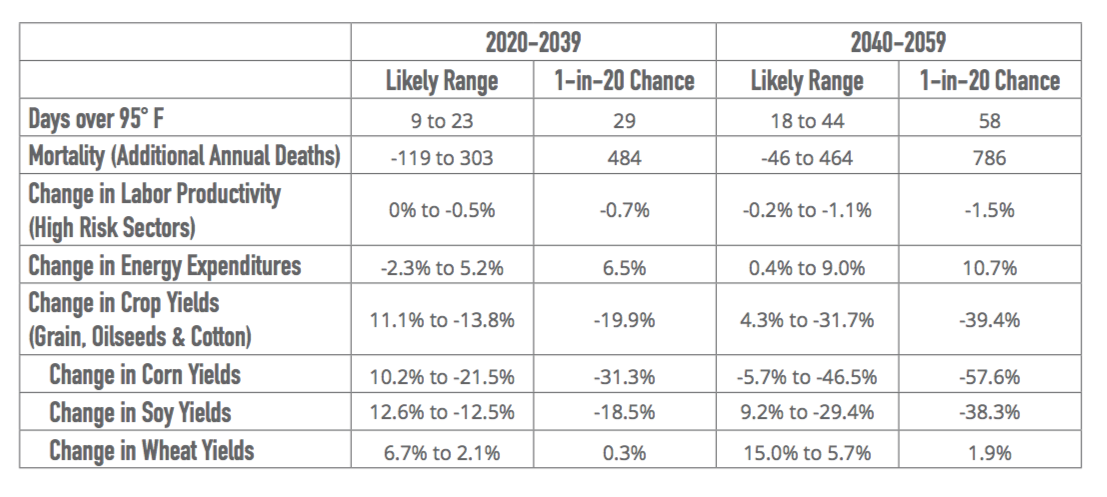
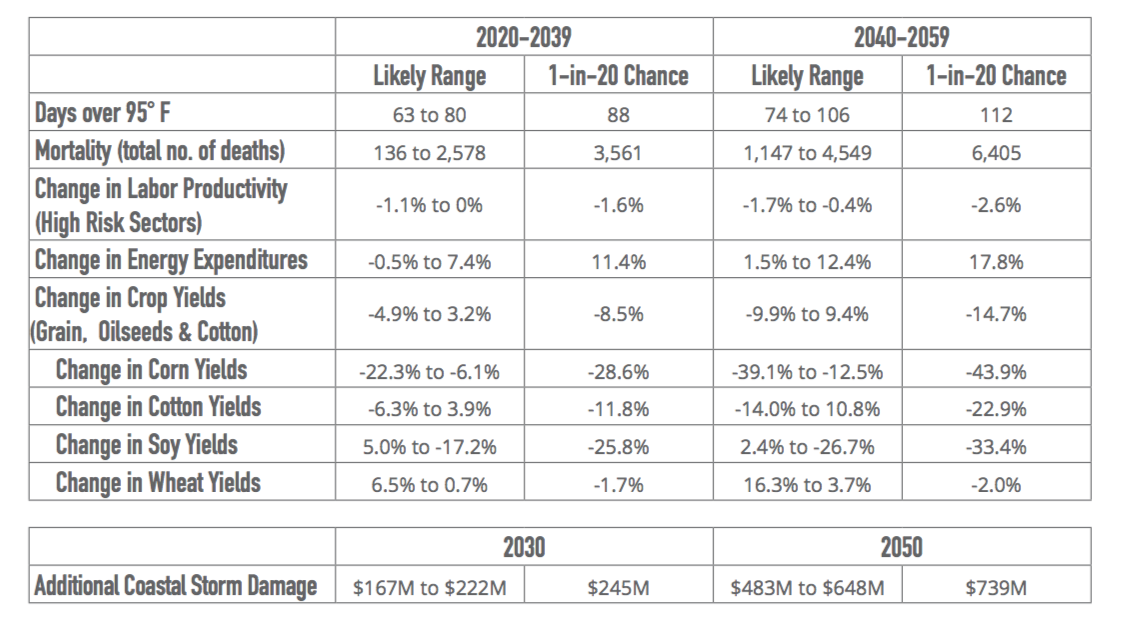
    • By the end of this century, the average number of extremely hot days across the region each year—with temperatures above 95°F—will likely increase by as much as 14 times from nine days per year in recent decades to as many as 123 days per year.
    • Rising humidity combined with increased heat across the region will likely mean more frequent days that reach extremely dangerous levels on the Human Heat Stroke Index.4 By the end of the century, Florida will likely experience as many as 24 days per year with heat and humidity conditions similar to the Chicago heat wave of 1995, which caused more than 700 heat-related deaths.
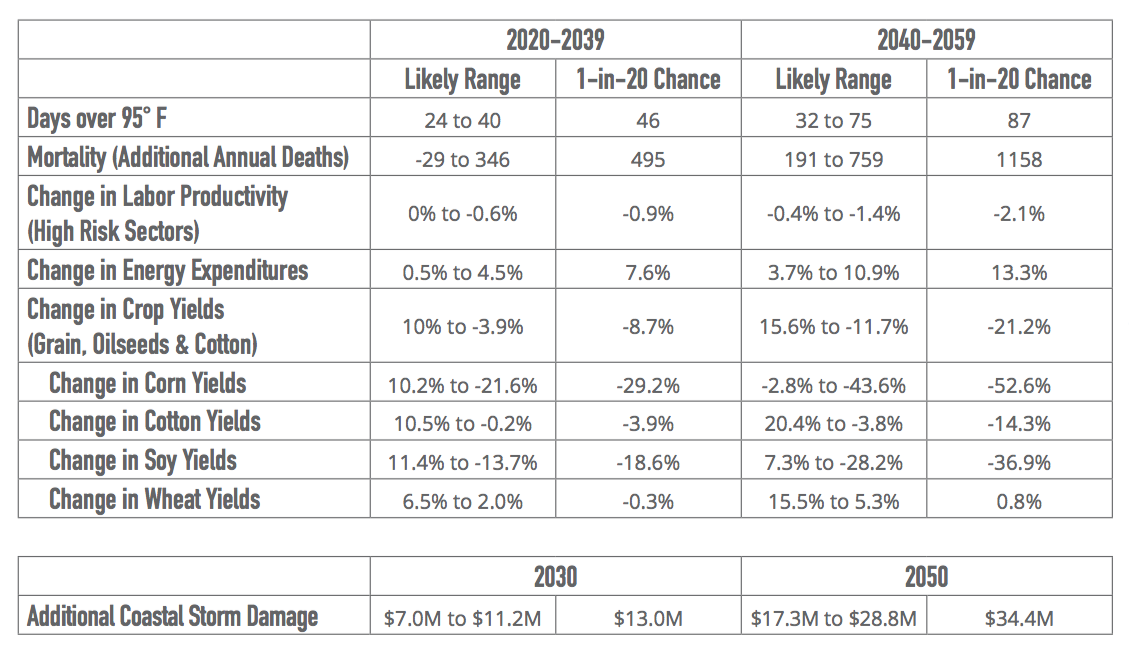
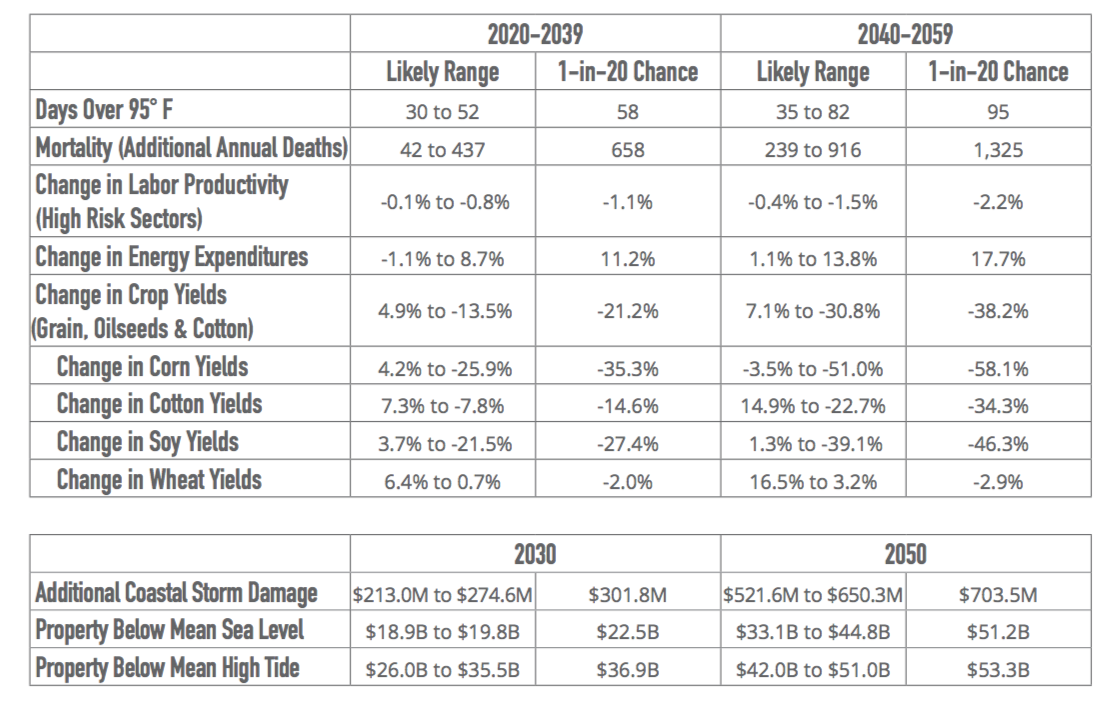
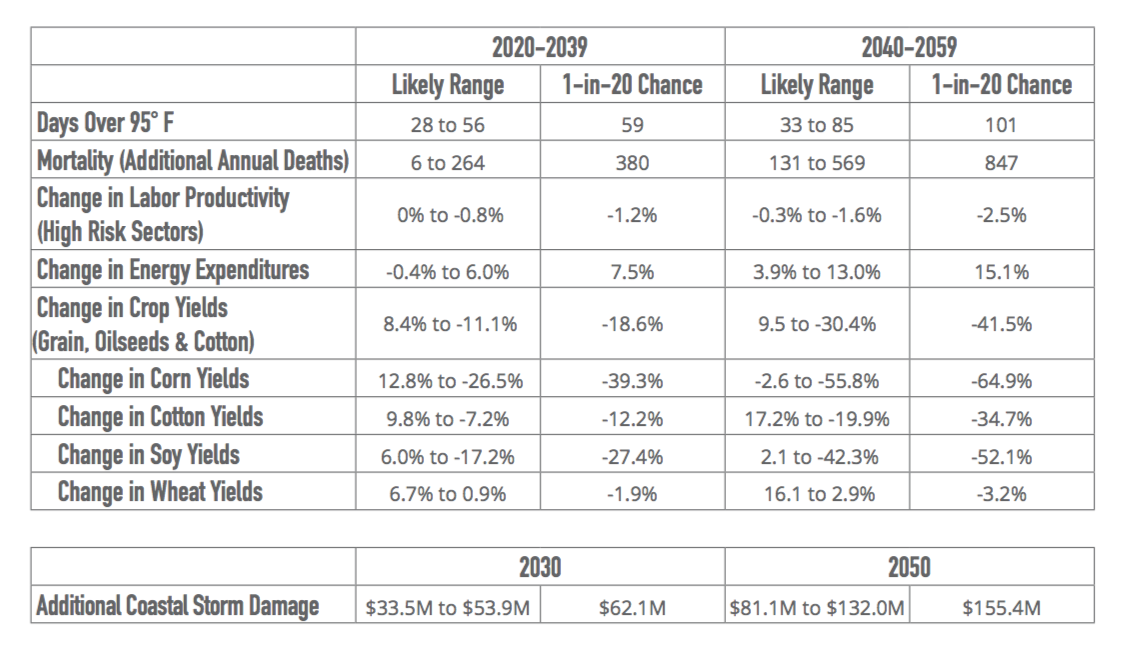
    • By mid-century, the average Mississippi resident will likely experience 33 to 85 days above 95°F per year, with a 1-in-20 chance of encountering more than 101 extremely hot days—more than three full months— per year. By the end of the century, the average Arkansas resident will likely experience between 65 and 135 days above 95°F in a typical year—more extremely hot days than the average Arizonan has experienced annually in recent decades.
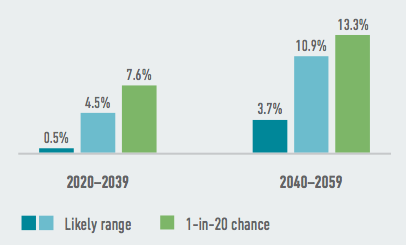
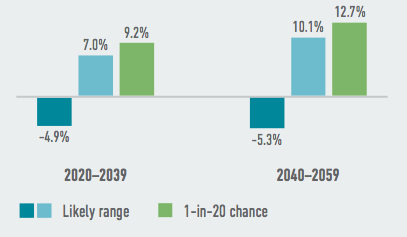
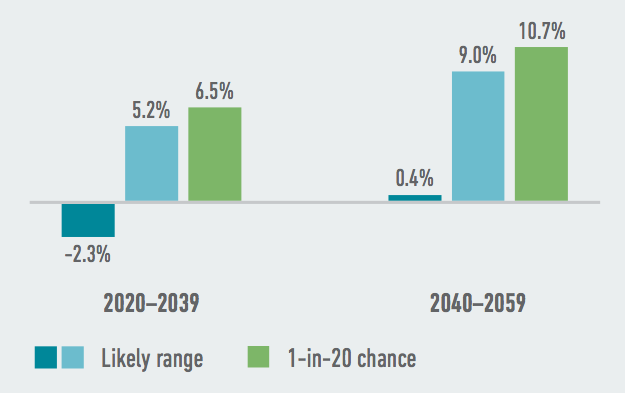
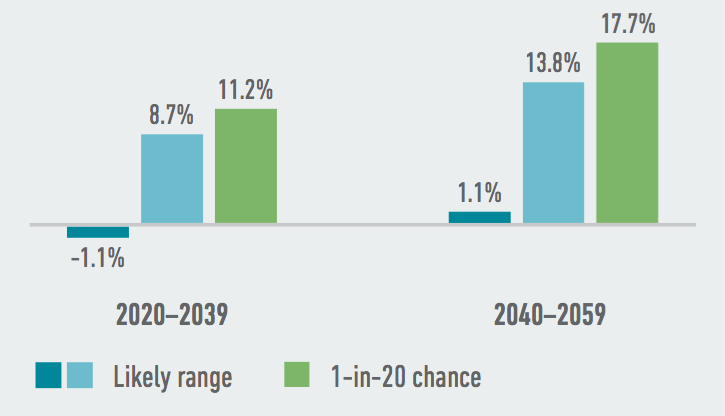
  • Rising temperatures will likely lead to a surge in electricity demand, as well as to a decline in energy system efficiency in many of the manufacturing-intensive states in the Southeast and Texas.
    • The Southeast and Texas are high-emitting and high energy-use regions, mainly due to their economic reliance on energy- and emission-intensive sectors such as manufacturing, agriculture, oil and gas production and mining.
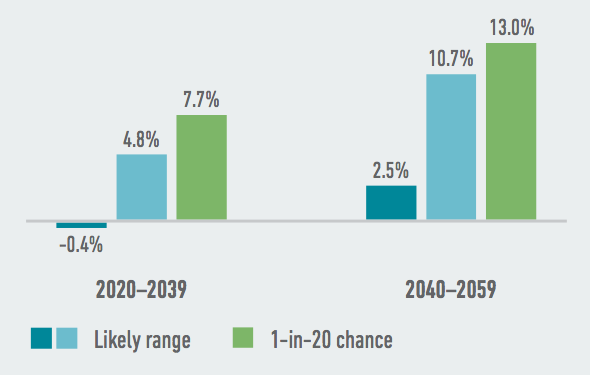
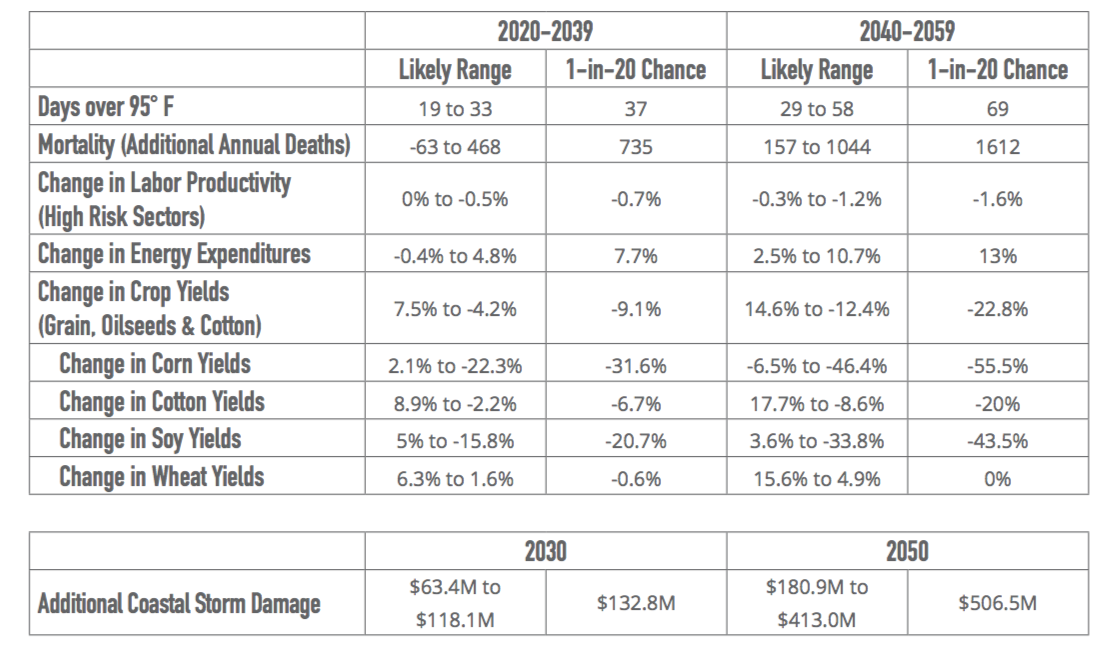
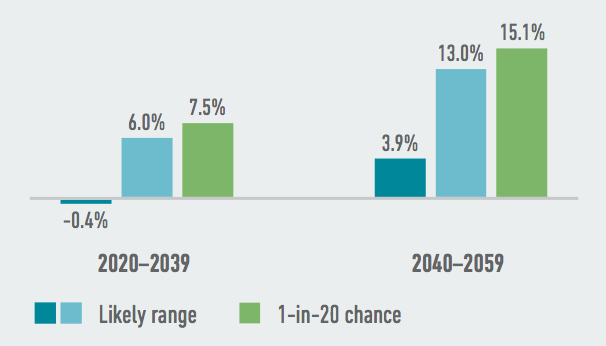
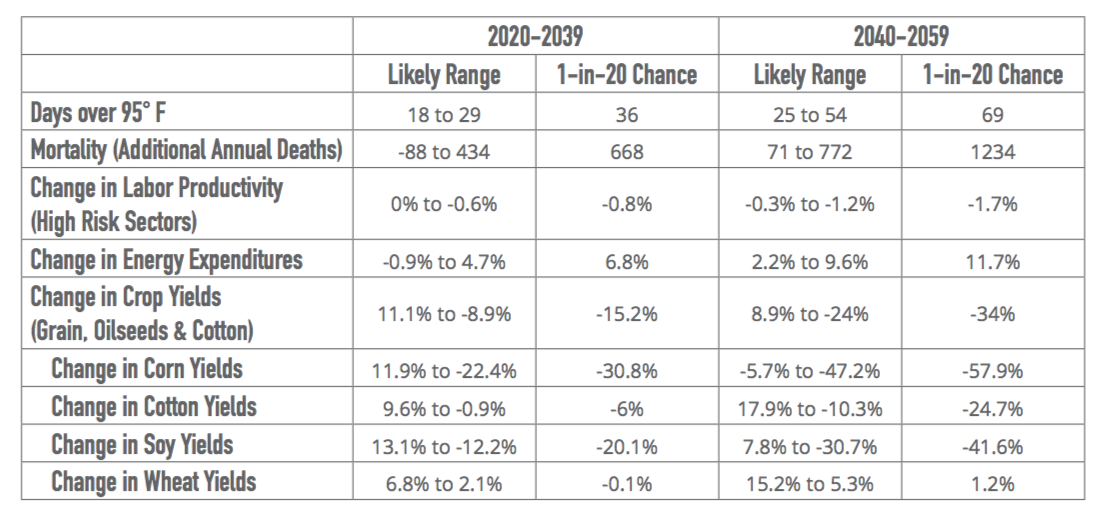
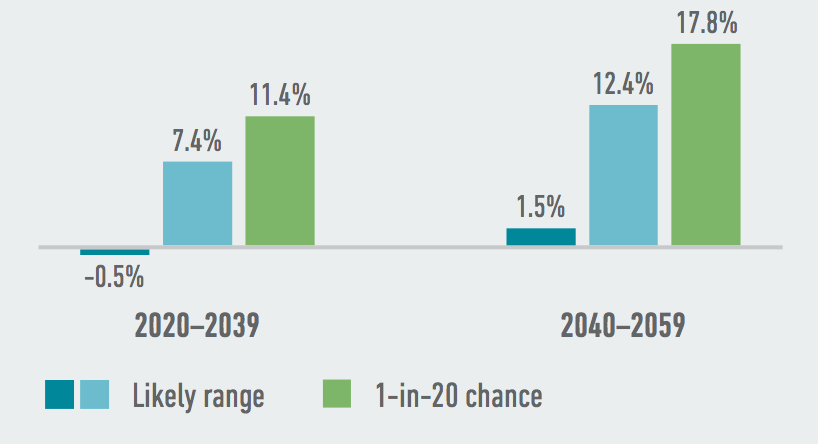
    • As temperatures rise and individual households and businesses increase their use of air conditioning, electricity demand across the region will rise—with a corresponding increase in prices. The Southeast region will likely see an average increase of 4% to 12% in energy costs by mid-century, with a 1-in-20 chance these costs will increase by more than 38% by the end of the century.
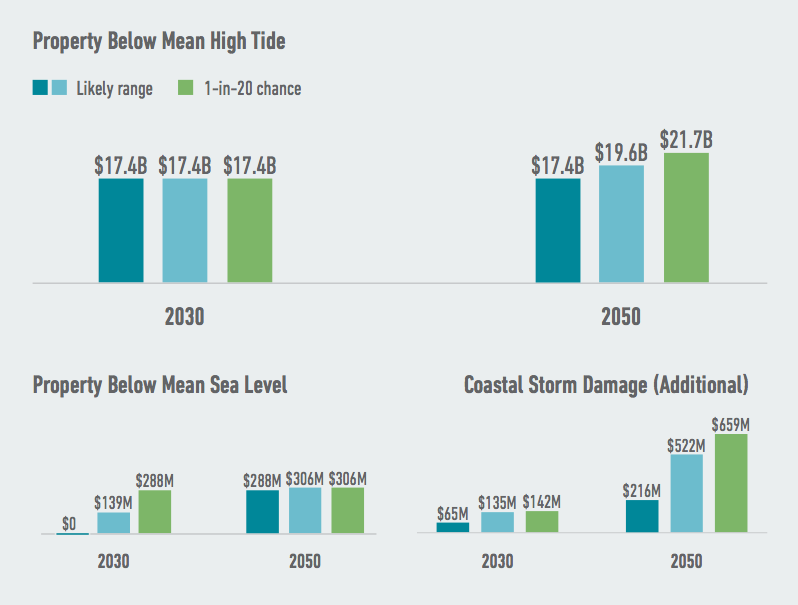
  • Sea level rise along the Atlantic and Gulf coasts will likely lead to large-scale losses from damage to coastal property and infrastructure.
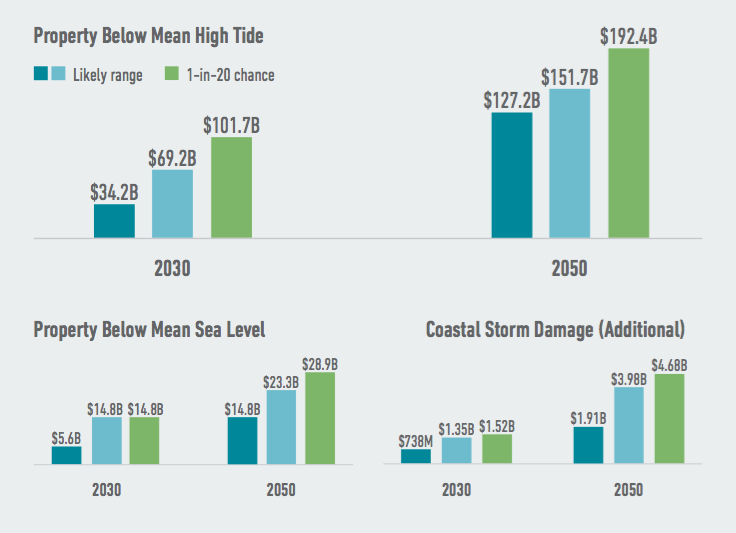
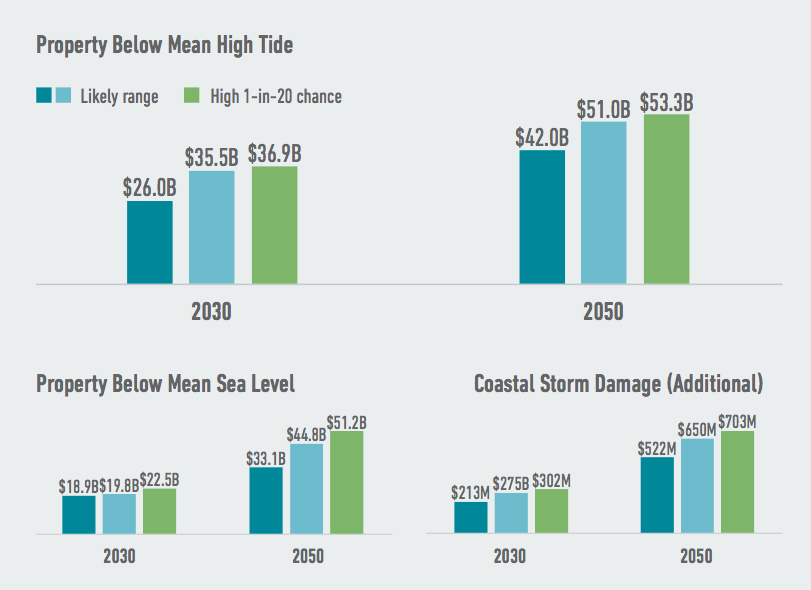
    • The Southeast region faces the highest risks of coastal property losses in the nation. If we continue on our current emissions path, between $48.2 billion and $68.7 billion in existing coastal property in the Southeast will likely be below sea level by 2050, with a 1-in-100 chance of more than $107 billion in existing property at risk. Rising sea levels will also damage critical infrastructure, including water supply, energy, and transportation systems.
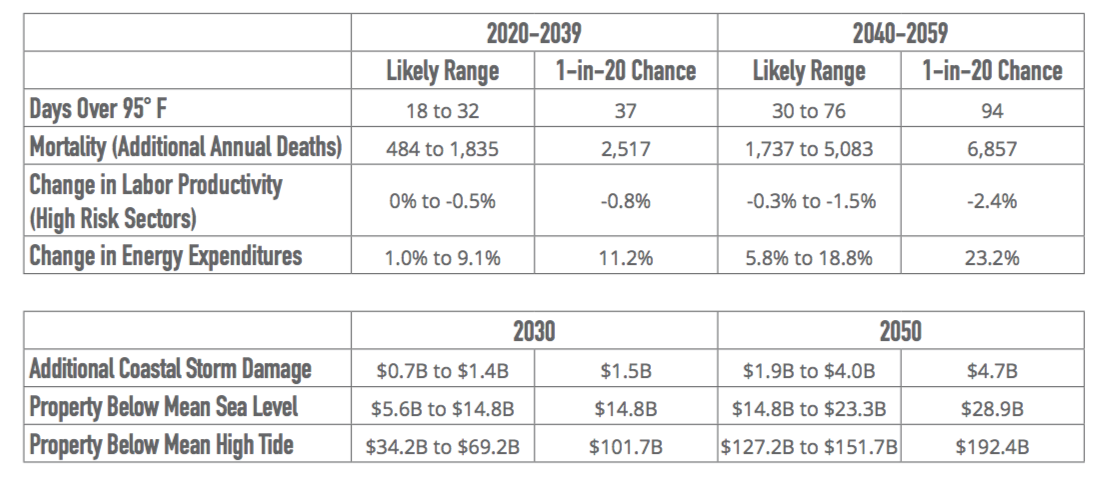
    • Louisiana and Florida will be hit hardest by property damages due to sea level rise. By 2030, $19.8 billion in existing coastal property in Louisiana will likely be below mean sea level. By 2050, that number increases to between $33.1 billion and $44.8 billion. In Florida, losses of existing property will likely range between $5.6 billion and $14.8 billion by 2030 to between $14.8 billion and $23.3 billion by 2050.
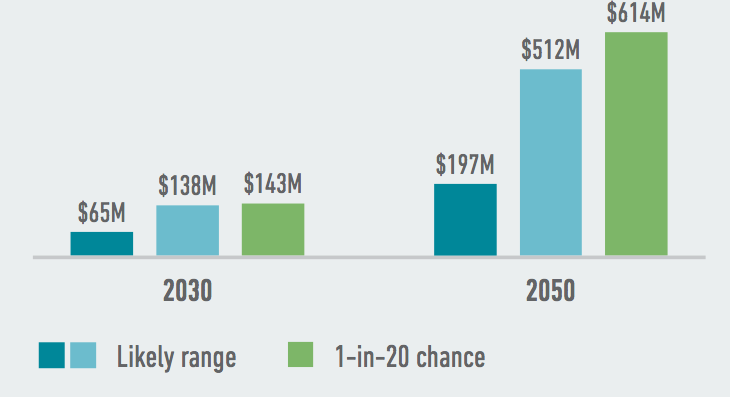
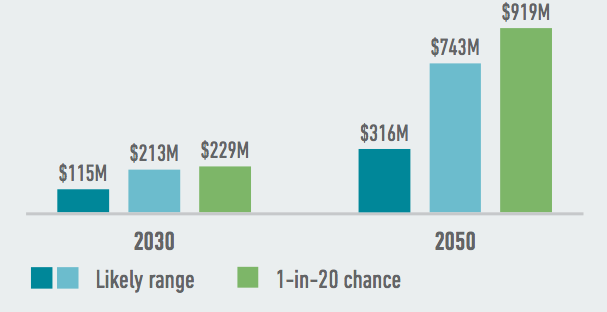
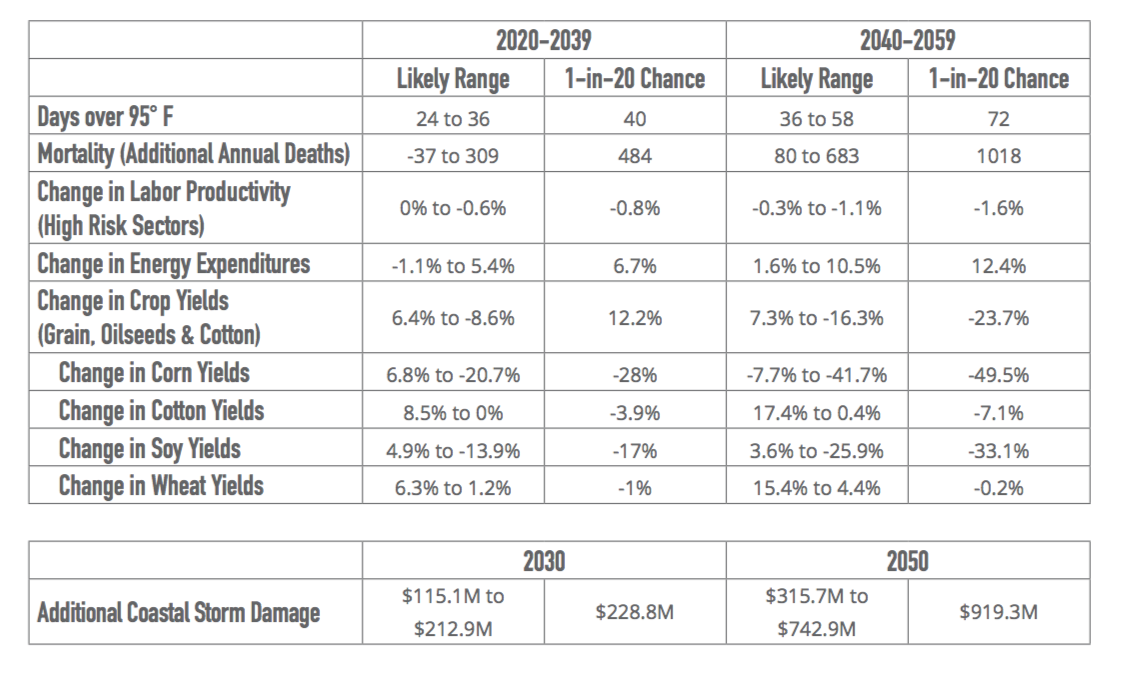
    • Hurricanes and other coastal storms will interact with rising sea levels, resulting in a likely growth in average annual storm losses due to higher storm surge. By 2050, average annual losses in the Southeast will likely increase by $3.6 to $6.8 billion. Potential changes in hurricane activity could lead to even greater losses.
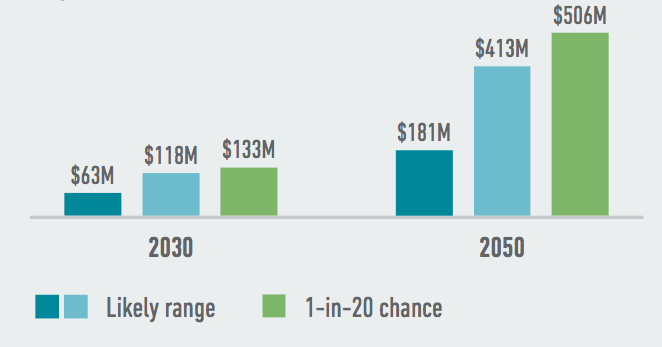
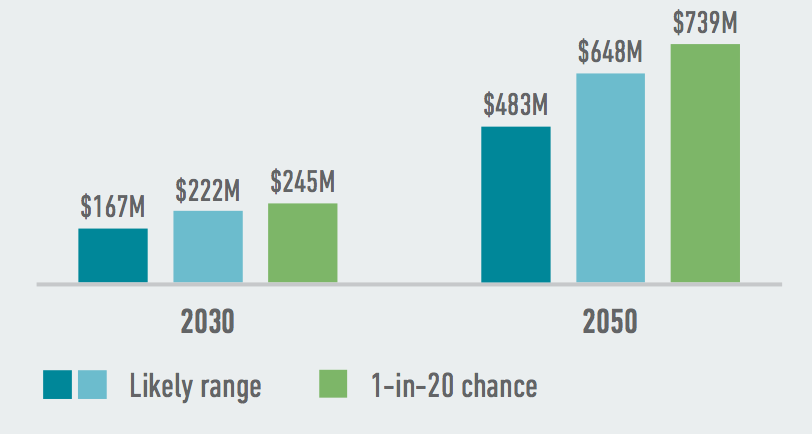
    • By 2030, average annual losses from hurricanes and other coastal storms will likely increase by $167 million to $222 million in Texas. By 2050, storm losses will likely increase by $483 million to $648 million.
    • Local sea level rise will vary along the coasts. At Grand Isle, Louisiana, mean sea level will likely rise 1.9 to 2.4 feet by 2050 and by 4.1 to 5.8 feet by 2100. Meanwhile, mean sea level at Charleston, South Carolina will likely rise by 0.9 to 1.4 feet by 2050 and by 2.1 to 3.8 feet by the end of the century.
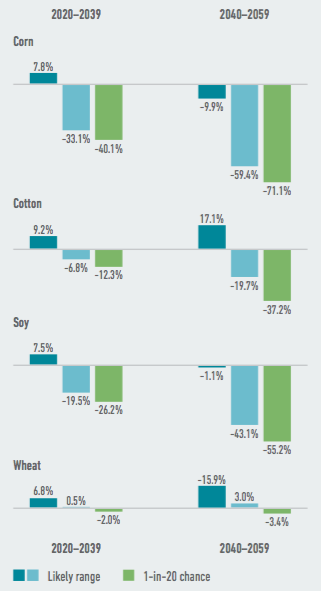
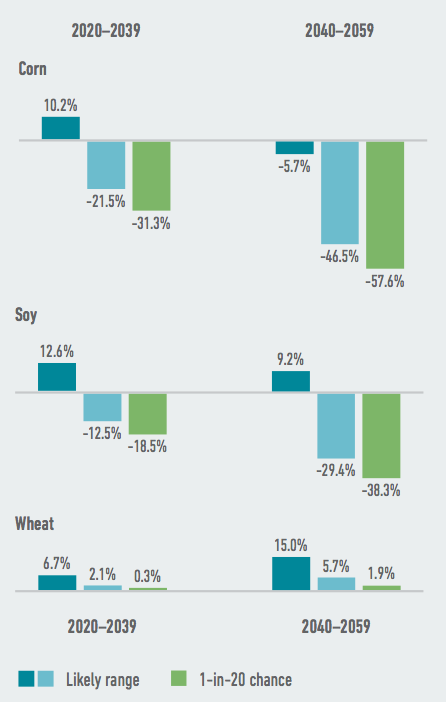
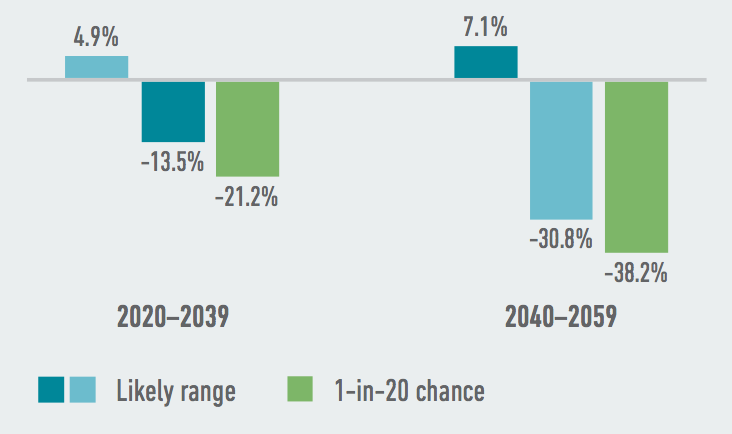
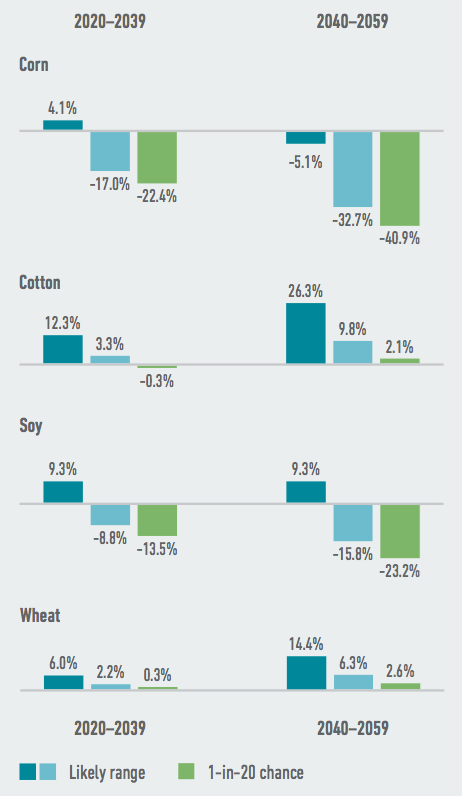
  • Changes in temperature and precipitation will likely lead to changes in crop yields, with several major commodity crops facing steep potential declines.
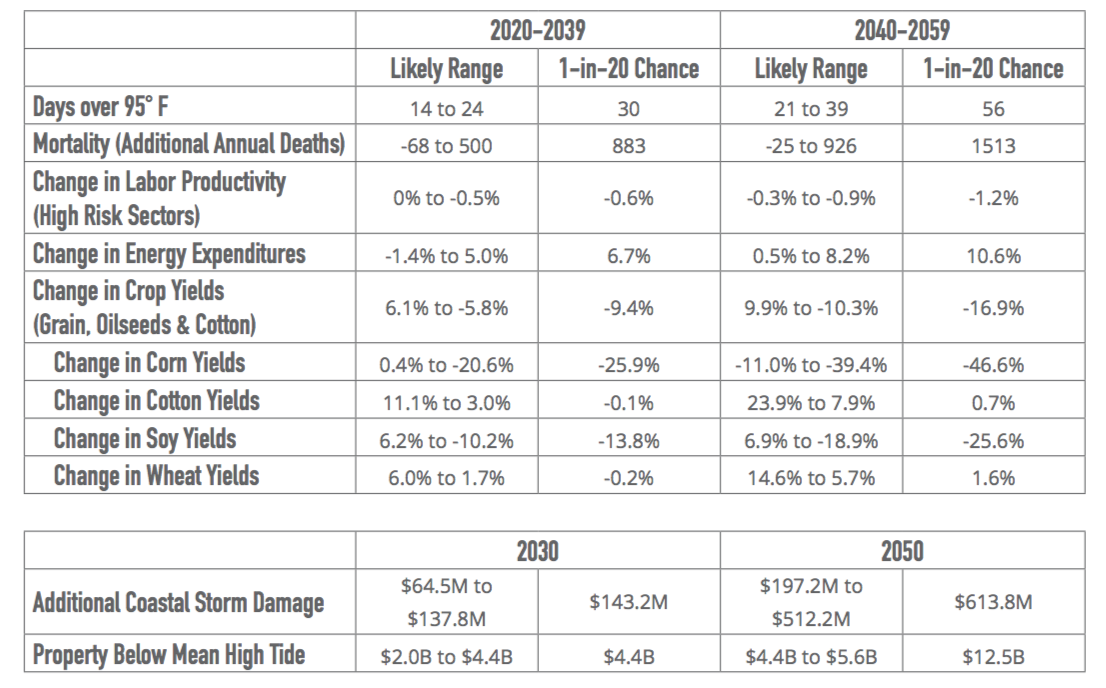
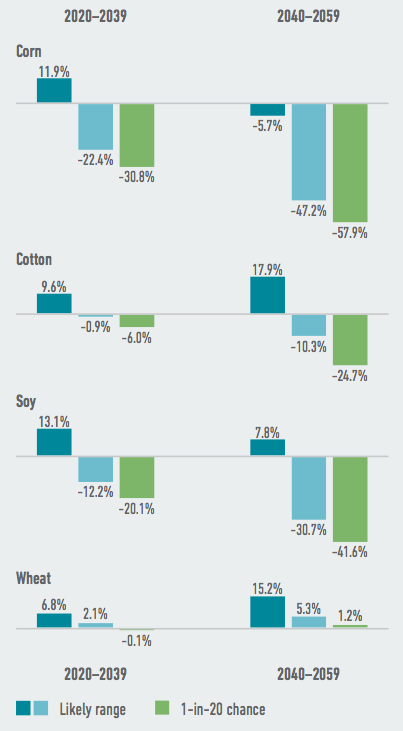
    • Over the next five to 25 years, without significant adaptation by farmers, the Southeast will likely see losses in corn yields of as much as 21% and in soybean yields of as much as 14% on average across the region as a whole. By the end of the century, these crops will take an even bigger hit: Corn yields will likely decrease by as much as 86%, with a 1-in-20 chance of more than 93% decline, and soybean yields will likely decrease by as much as 76%.
    • Kentucky will likely experience the third largest crop losses in the country. By mid-century, Kentucky will likely see average losses in its grain and oilseed crops of as much as 32% annually, absent adaptation. By the end of the century, Kentucky’s losses will likely increase to as much as 69% annually.
    • Over the next five to 25 years, Texas will likely see corn yield declines of as much as 22% annually, absent adaptation. These losses grow to as much as 39% annually by mid-century.
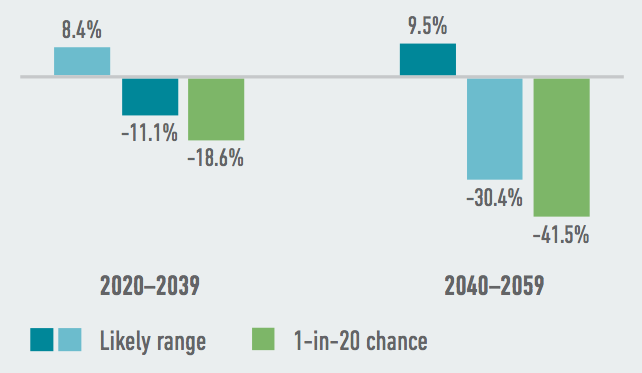
    • On the other hand, warmer temperatures may actually improve the growing conditions for some crops in several southeastern states. Wheat yields, for example, are likely to increase as a result of benefits from higher carbon dioxide in the atmosphere. Cotton yields will see mixed effects, with the likely range of impacts spanning yield gains to losses for many Southeastern states.
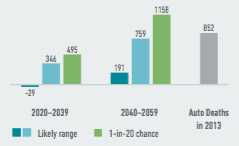
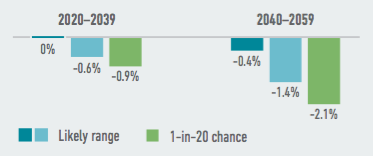
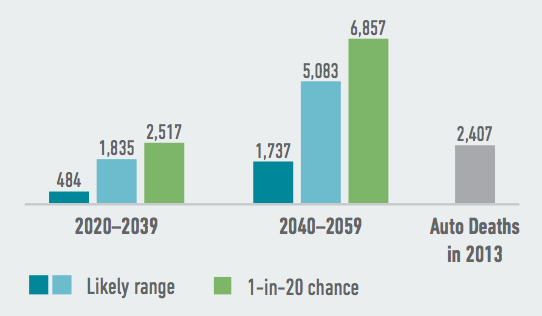
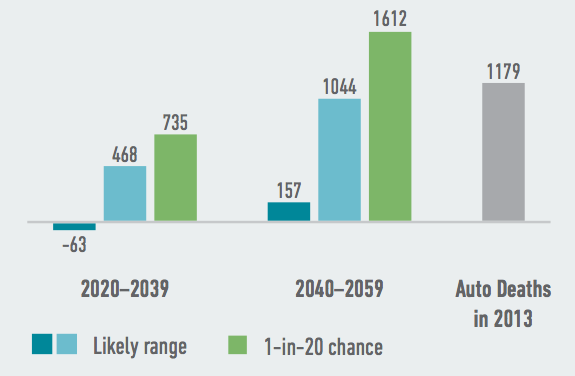
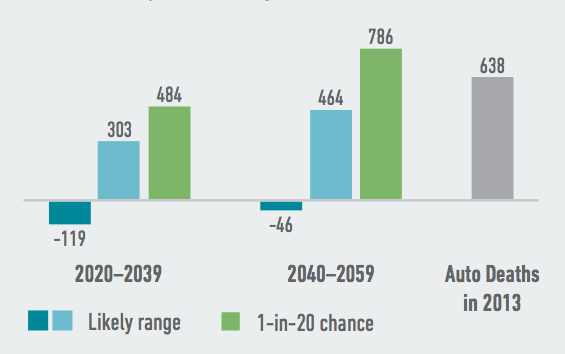
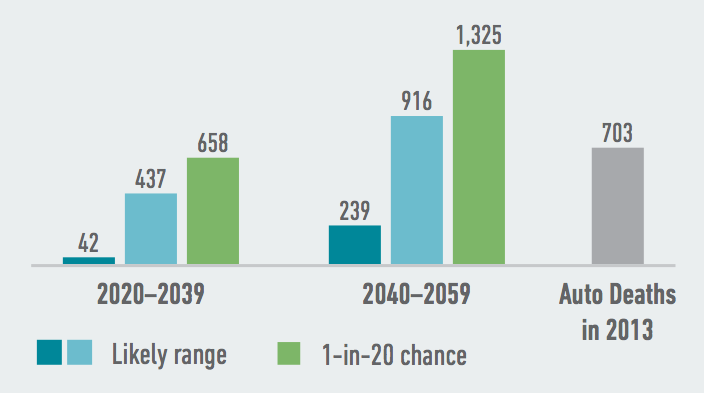
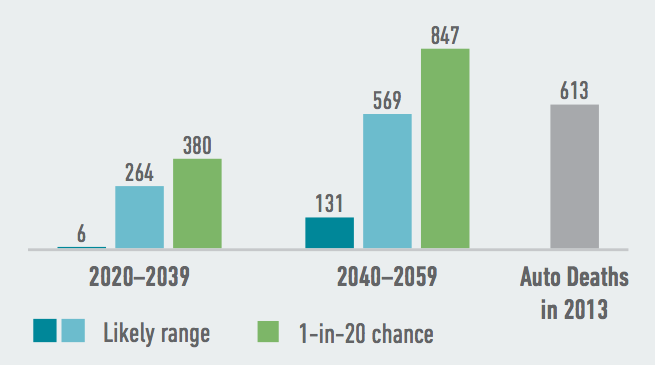
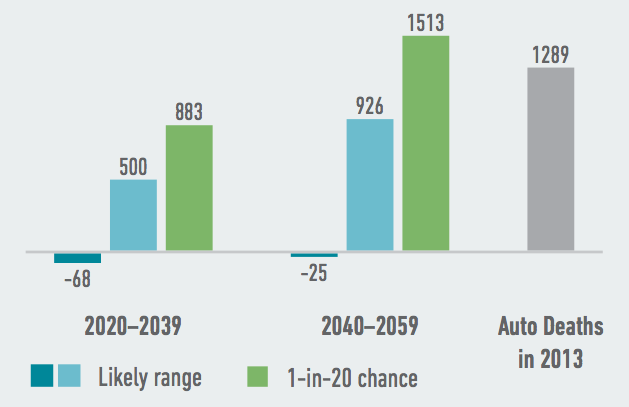
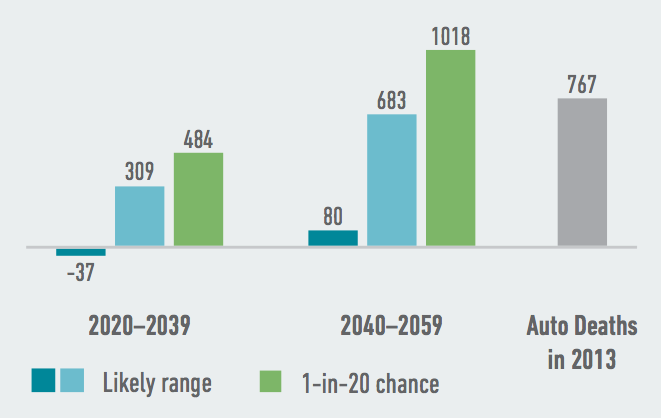
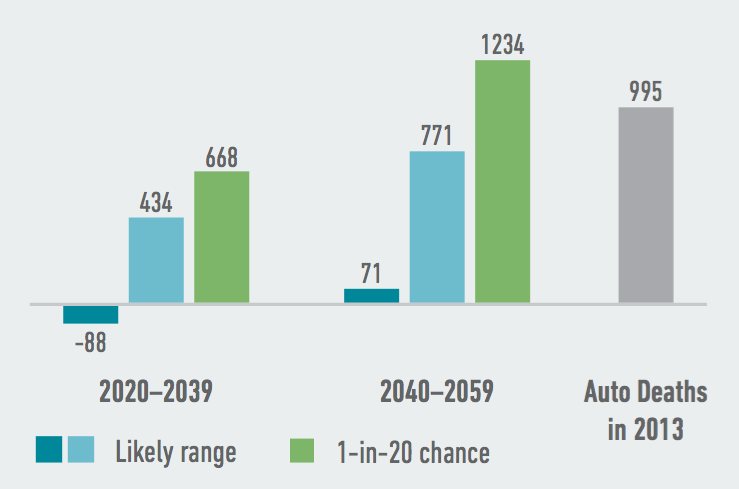
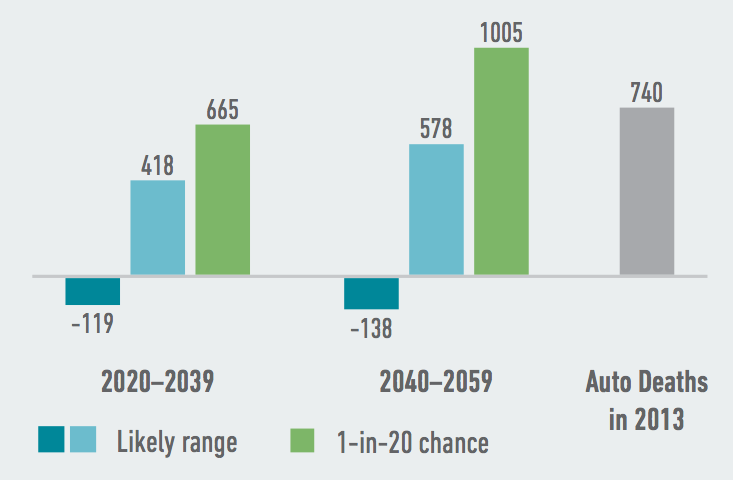
  • Rising temperatures will likely increase heat-related mortality and reduce labor productivity across the Southeastern U.S. and Texas.
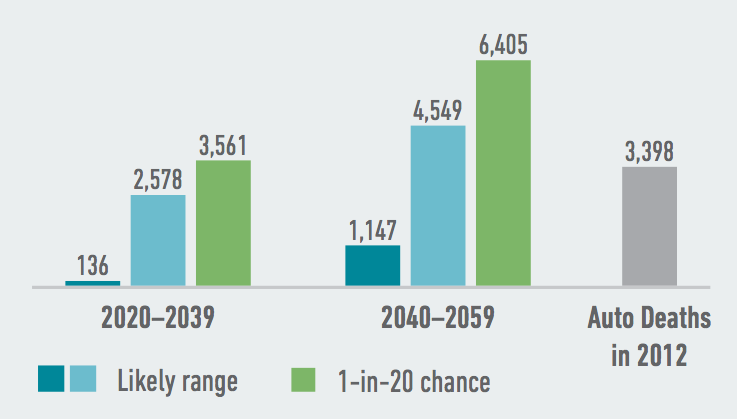
    • Over the next five to 25 years, Florida will likely see as many as 1,840 additional deaths per year and Texas, as many as 2,580 additional deaths per year due to extreme heat. By mid-century, these two states combined will likely see as many as 10,000 additional deaths per year. The elderly are most vulnerable to heat-related health risks.
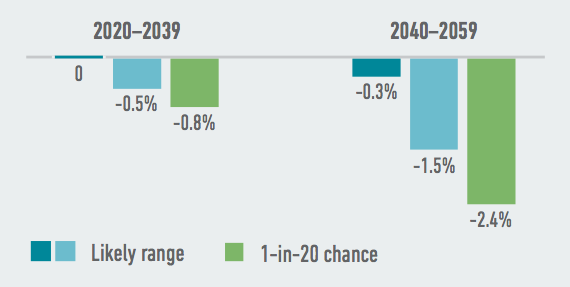
    • When the temperature rises past human comfort levels, labor productivity declines, specifically in “high-risk” industries involving outdoor work (which include industries such as manufacturing, agriculture and transportation).
    • By mid-century, Southeastern states will likely see labor productivity decline by up to 0.6% on average in these high-risk industries. In Mississippi, there is a 1-in-20 chance that by mid-century the decrease for labor productivity will exceed 2.5% in high-risk sectors.

These diverse impacts from climate change put the Southeastern and Texan economies at risk and could reverse the positive trends seen in the manufacturing sector in recent years. By fully understanding the climate risks these states face if we stay on our current emissions path, Southeastern and Texan businesses and policymakers have the opportunity to become models of climate risk mitigation and resilience.

Introduction

The mission of the Risky Business Project is to quantify the economic risks to the United States from unmitigated climate change. Our inaugural report, Risky Business: The Economic Risks of Climate Change in the United States, highlighted these risks across every region of the country, with a focus on three sectors: commodity agriculture, energy demand and coastal infrastructure. We also looked at overarching issues such as changes in labor productivity and heat-related mortality.

This follow-up report focuses on the Southeastern region of the U.S. and Texas. It offers a first step toward defining the range of potential economic consequences to specific sub-regions and industry sectors in each state if we continue on our current greenhouse gas emissions pathway, with no significant new national policy or global action to mitigate climate change.

Our research combines state-of-the-art climate science projections through the year 2100 with empirically-derived estimates of the impact of projected changes in temperature and precipitation on the Southeastern and Texan economy. We analyze not only those outcomes most likely to occur, but also lower-probability, highercost climate futures. These “tail risks” are most often expressed here as the 1-in-20 chance events.

When assessing risk related to climate change, it is particularly important to consider outlier events and not just the most likely scenarios. Indeed, the outlier onein-100-year event today will become the one-in-10-year event as the earth continues to warm. Put another way, over time the extremes will become the “new normal.”

As with classic risk analysis, our work does not take into account the wide range of potential adaptation strategies Southern industries and policymakers will surely pursue in the face of shifting climate impacts. These potential responses are frankly too varied and speculative to model with any certainty; they also may depend on policies and technologies not yet commercialized or even imagined. Rather, we present our estimate of the risks that states in the Southeast and Texas will face if they maintain their current economic and demographic structure, and if businesses and individuals continue to respond to changes in temperature and precipitation as they have in the past.

Defining Risk

The risk of a future event can be described as the probability (or likelihood) of that event combined with the severity of its consequences. The combination of likelihood and severity determines whether a risk is high or low. For instance, a highly likely event with minimal consequences would register as a moderate risk; a low-probability event, if it has potentially catastrophic impacts, could constitute a significant risk. These low-probability/high-impact risks are generally referred to as “tail risks.”

The Risky Business assessment evaluates a range of economic risks presented by climate change in the U.S., including both those outcomes considered most likely to occur and lower-probability climate futures that would be either considerably better or considerably worse than the likely range. This is a common risk assessment approach in other areas that have potentially catastrophic outcomes, including disaster management, public health, defense planning and terrorism prevention.

In presenting our results, we use the term “likely” to describe outcomes with at least a 67% (or two-inthree) chance of occurring. In discussing notable tail risks, we generally describe results as having a 1-in-20 chance (or 5%) of being worse than (or better than) a particular threshold. All risks described in this report represent average annual outcomes over one of three 20-year time periods: near-term (2020–2039), mid-century (2040–2059) and end of century or late-century (2080–2099).

Results: General Regional Trends

The Southeastern United States and Texas face diverse and significant risks from unabated climate change. These risks vary across the region, which is made up of the cluster of 11 Southeast states from our inaugural report and expanded to include Texas. The area spans coastal and inland regions and a range of different geographies and diverse economies. As a result, there is no single top-line number that represents the cost of climate change to the Southeastern economy as a whole. Instead, we turn to each of the 12 states in this region and look at the specific risks each faces from climate change due to rising temperatures.

Despite the variability within the region, we can identify some general trends in how these states will react to a changing climate. These include:

  • Increasing heat. This region of the U.S. will likely be hit harder by temperature rises than any other single part of the country. Overall, residents of the region will likely see between two and four times more days over 95°F in a typical year in the next five to 25 years than they have over the past 30 years. The Southeast already boasts the highest average temperatures in the country, but has far fewer extremely hot days than the Southwest and the Great Plains. If we continue on our current emissions path, the entire region will see increases in days over 95°F, with the most dramatic increases in the southern-most states. By mid-century, the average citizen in Mississippi is expected to experience more extremely hot days than the average Nevadan does today, with a 1-in-20 chance of more extremely hot days than any state other than Arizona. Climate change also threatens to increase humidity, leading to a combination of heat and humidity that creates outside conditions dangerous to humans, who must maintain a skin temperature below 100°F in order to effectively cool down and avoid fatal heat stroke.
  • Inundation from higher mean sea levels and high tide lines. As air temperatures rise, so do ocean temperatures, leading to ocean expansion and sea level rise. Higher temperatures can also melt glaciers and ice sheets, further contributing to rising oceans. This will raise mean sea levels while also moving high tide lines further inland, putting a significant amount of existing property in danger of permanent flooding. Sea level rise already threatens the financial value and viability of property and infrastructure along the Eastern Seaboard and Gulf Coast. If we stay on our current climate path, some homes and commercial properties with 30-year mortgages in Florida, Louisiana, Alabama and elsewhere could quite literally be underwater before they are paid off.
  • Changes in precipitation. In general, precipitation changes due to climate change are much harder to predict than heat impacts. However, our research shows that if we stay on our current path, average annual precipitation across the Southeast will likely increase during fall and spring over the course of the century, compared to the past three decades.
  • Declines in agricultural productivity. Changes in temperature and precipitation over the course of the century will create significant challenges for Southeastern and Texan farmers and ranchers. Many of these states’ most valuable agricultural products—in particular corn, soybeans and livestock operations—face significant risks from increasing heat, changing precipitation patterns, and shifting distribution of and prevalence of pests, weeds and diseases.
  • Increases in electricity demand and cost. Energy demand is highly sensitive to increased temperatures, which result in higher use of electricity for residential and commercial cooling during the summer and reductions in heating demand during the winter. At the same time, higher temperatures reduce the efficiency of energy generation, transmission and delivery systems. Even when combined with lower demand for heating, these factors together will likely increase overall energy costs for Southeastern states and Texas.
  • Heat-related increases in mortality and decreases in labor productivity. Rising temperatures also will affect human health, resulting in likely increases in heat-related mortality (and fewer cold-related deaths). They also will cause decreases in labor productivity in what economists refer to as “high-risk” industries in which many employees must work outdoors; these include the important regional industries of construction, transportation, agriculture and manufacturing.

The Southeast and Texas face significant and diverse climate risks. We detail the specific risks to each of the 11 Southeast states and Texas in Results by State (see Section V).

Climate Risk: Manufacturing in the Southeast and Texas

Although the U.S. manufacturing sector has declined in recent decades, manufacturing remains vital to the U.S. economy and still employs approximately 12 million Americans.5 In fact, while this sector suffered during the 1980s and the most recent recession, American manufacturing is now experiencing a resurgence, particularly in the Southeast and Texas. In 2013, manufacturing contributed $2.1 trillion to the U.S. economy—more than 12% of GDP—and accounted for 88% of all U.S. exports, up a remarkable 51% from declines during the last recession.6 The Southeast and Texas make up about 34% of the entire U.S. manufacturing output; that’s more than $700 billion.7 Texas alone contributes $233 billion of that output.

There is some evidence that firms are starting to see the U.S. as more of an opportunity than they have in a long time. During the past five years, there has been encouraging anecdotal evidence as major manufacturers have either chosen to bring operations back to the U.S. from offshore, or to expand here rather than overseas. For example, BMW will invest $1 billion over the next two years to expand its Spartanburg, South Carolina factory by about 800 jobs and to increase capacity by 50% in 2016.8 Meanwhile, Nissan is expanding its assembly plant in Smyrna, Tennessee, and expects to add almost 1000 jobs after investing $160 million in the project.9

Two important global trends have helped to move more manufacturing back from overseas to the U.S. First, the 2011 Japan tsunami and earthquake severely disrupted supply chains,10 especially in the auto industry, and alerted some manufacturers to the need to diversify their supply chains and make them more resilient to extreme weather events.11 Second, low energy costs resulting from the U.S. shale boom have courted energy-intensive manufacturers back to this country.12 This boom has also resulted in more oil and gas drilling operations, which sometimes count as manufacturers depending on their place in the value chain.

But American manufacturing is at risk from climate change, which could reverse the positive trends seen in recent years. Manufacturing plants tend to be place-based and capital intensive, and therefore not easily moved away from areas of high climate risk. They are also highly dependent on transportation infrastructure, such as roads, rivers, railways and ports, all of which are similarly at risk from rising temperatures, higher sea levels and increased storm surge. Manufacturing workers can be considered high risk for heat stroke in extremely hot and humid temperatures, leading to a loss in labor productivity that can affect these firms’ competitiveness. Plants and facilities are also often energy- and water-intensive, meaning that changes in the availability of these resources can cause serious harm to their competitiveness. Finally, manufacturers in the food processing space have a secondary set of risks related to the climate risk to their raw materials: crops and livestock.

Manufacturing in the Southeast and Texas

Manufacturing growth has been particularly strong in the Southeast and Texas, one of the regions of the U.S. likely to be hit hardest by the impacts of climate change. Anchored by traditional manufacturing industries such as auto, timber, textiles, and chemicals, Southern manufacturing has been a key driver of economic growth during the post-recession recovery. Manufacturing is a pillar of most of these states’ economies; in fact, manufacturing represents more than 10% of gross state product (GSP) for 10 of the 12 states in this report (excluding only Florida and Virginia).13 In terms of raw output, manufacturing contributed $528 billion to these states’ combined economies in 2013. Rising manufacturing output is stimulating jobs and investment growth in the region. According to Southern Business & Development magazine, the manufacturing sector announced 410 projects that met or exceeded 200 jobs and/or $30 million in investment in 2013.14 For example, DuPont recently built a $500 million plant to produce Kevlar anti-ballistic fiber near Charleston, South Carolina, after considering locations around the world.15

Recent manufacturing growth has generated investment and created jobs in cities of all sizes across the region. A Forbes16 report ranking top cities for manufacturing growth by metropolitan area size placed Nashville, Tennessee, and Virginia Beach, Virginia, among the top 10 in large metro regions, while both Mobile, Alabama, and Charleston, South Carolina, placed high among mid-sized metro regions. In Nashville, auto-related manufacturing is booming with the expansion of several smaller plants and a Nissan facility. Meanwhile, Virginia Beach’s manufacturing growth has included a diverse mix of durable goods, including fabricated metals and autos. Growth in Mobile and Charleston is largely due to a recent spike in aerospace manufacturing. In fact, South Carolina has experienced the highest growth in aerospace manufacturing in the country, with statewide employment in the sector growing more than 600% since 2010.

Risks to critical infrastructure

Reliable infrastructure is critical for continued manufacturing growth in this region. The Southeast and Texas in particular boast a central location that is a draw for manufacturers looking for easy access to materials and markets. The Southeast has a well-developed transportation infrastructure consisting of modern ports, railroads, airports, the Mississippi River and highways. In addition, the proximity to oil and natural gas resources along the Gulf Coast provides reliable energy sources.

But climate change threatens manufacturing plants and critical transportation and energy infrastructure along the Gulf and Atlantic coasts as well as major waterways such as the Mississippi River. In its 2012 report, Locating American Manufacturing, the Brookings Institution found that many of the metropolitan areas that are designated “strongly specialized” in manufacturing lie along America’s coastlines and major waterways.17 Manufacturing firms often rely on large intakes of water for production and cooling processes; they also tend to locate near ports and waterways to transport their goods across supply chains or to markets.

The Southeast and Texas will likely face a higher rise in sea level and far greater losses of property and infrastructure from flooding and coastal storms than the national average. For example, Louisiana, which is already losing large amounts of land to the sea for a variety of reasons, will likely see 1.1 to 1.4 feet of sea level rise at Grand Isle by 2030 if we stay on our current emissions path.18

Higher seas also lead to more destruction when storms hit, and the Southeast is the single most susceptible region in the nation to additional losses from storm damage. When storms batter the Gulf and Atlantic coasts, higher seas will exacerbate storm surges and expand the reach of storm-related flooding. The storm-related property losses attributed to climate change along the Florida shoreline are likely to increase by as much as $1.3 billion per year on average by 2030, and by as much as $4 billion annually by 2050, bringing Florida’s likely total annual storm damage to as much as $17.2 billion per year by mid-century. These numbers may well be too conservative, as they assume historical frequency and intensity of hurricane activity, both of which may increase with climate change and lead to higher losses.

But climate change doesn’t only threaten infrastructure and commerce in coastal areas. Variation in the amount of precipitation falling both in the southeastern U.S. and in the Midwest in particular has the potential to wreak havoc on waterway commerce along the Mississippi River.19 Currently, specific flooding and drought events cannot necessarily be attributed to climate change, but projected changes in precipitation indicate that such events will likely become more frequent in the future.

Heavy precipitation can lead to very high water levels along rivers and accelerate flow rates. This makes navigation increasingly difficult and also leads to floods, especially given the poor condition of many levees on the lower Mississippi. For example, severe flooding in 2011 delayed barge traffic, caused barges to run lighter loads, and forced some cargo to be re-routed to trucks and rail.20 As recently as March 2015, heavy rainfall caused the Mississippi to rise significantly, prompting restrictions for work along the levees and on river traffic and transportation of heavy loads. Subsequent delays are expensive and can have ripple effects throughout the economy, affecting supply chains and commodity prices.

On the other hand, decreased summer precipitation combined with longer dry spells could lower water along the region’s rivers and lakes. In 2012, severe drought in the upper Midwest left the Mississippi River levels at near-record lows, slowing river traffic and transport of goods along the nation’s busiest waterway. As a result, tugs pulled fewer barges, and barge operators reduced loads to avoid bottoming out.

Disruptions in barge traffic come with a significant price tag for both businesses and government. Every inch drop in water level corresponds to more than 250 fewer tons of barge capacity along the river.21 Ultimately, barge cargo for December 2012 totaled 1.1 million metric tons less than the previous year.22 Meanwhile, the Army Corps of Engineers continually dredged portions of the river to ensure they remained passable throughout this period. The resulting economic harm was significant and demonstrates the region’s vulnerability to drought.

Impacts on energy systems, labor productivity and food supply

Rising sea levels may have the most immediately visible effects; however, increasing atmospheric temperatures caused by climate change are themselves a major risk to the U.S. manufacturing sector. Extreme heat across the nation, but especially in the manufacturing-intensive areas of the Southeast and Midwest, will threaten labor productivity and energy systems: both contributors to manufacturing competitiveness.

Labor productivity of what economists call “high-risk” workers, including those in the manufacturing sector but also the related transportation sector, could be reduced by as much as 3% by the end of the century, particularly in the Southeast. This is comparable to the decline in absolute labor output during past U.S. recessions.23 Over the longer term, during some parts of the year, extreme heat could surpass the threshold at which the human body can no longer maintain a normal core temperature without air conditioning, which we measure using a Human Heat Stroke Index (HHSI). During these periods, those whose jobs require them to work outdoors, as well as those lacking access to air conditioning, will face severe health risks.

Rising temperatures also decrease the efficiency of our energy systems: Power plants need to be cooled down more often (and sometimes the water used to cool them must itself be cooled beforehand), and transmission lines move electrons more slowly in the heat. Meanwhile, our research shows that increased temperatures will likely raise electricity demand, and as a result, overall energy costs, because electricity demand for air conditioning tends to surge when the weather heats up. Although our research focuses on climate change impacts to residential and commercial energy demand and cost, we can expect similar effects in the industrial sector.

Our analysis did not account for climate-driven changes in water supply, which can further impact energy costs by decreasing production capacity. For example, decreases in water availability can cause water-cooled power plants to temporarily shut down or reduce production. Oil and gas production, which requires large volumes of water throughout the production process, faces increasing risks as operations compete with other users for water access in times of stress, facing limited availability and higher costs.

A number of the Southeast and Texas’ bedrock manufacturing industries depend on plentiful and affordable energy supplies, making them particularly sensitive to energy cost increases. Several of this region’s largest manufacturing sectors—including chemicals, paper, and wood manufacturing—rank among the most energy intensive industries. Even relatively small increases in energy prices can significantly increase manufacturing costs for these Southeastern companies. The chemical industry in particular is energy-intensive, relying on natural gas as a key input to its production processes, and also on electricity to power its operations. Lately this sector has been extremely competitive globally due to low U.S. natural gas prices, but this recent success underscores the energy sensitivity of the sector as a whole.24 The chemical industry is important to the U.S. economy: Shipments from this sector totaled nearly $795 billion in 2012, or nearly 14% of all manufacturing shipments (more than two-thirds pharmaceuticals).25 Texas manufactures more chemicals than any other state (21% of the nation’s total); Louisiana, North Carolina, California and Illinois round out the top five. Together, these five states represent half of all U.S. chemical shipments.26

Finally, food manufacturers will face additional risk through impacts on their raw materials: crops and livestock. This industry employs 14% of all U.S. manufacturing workers. As extreme heat spreads across the middle of the country by the end of the century, some states in the Southeast risk a likely loss up to 70% of average annual crop yields (corn, soy, cotton and wheat), absent agricultural adaptation. These decreased crop yields (particularly in major grain and oilseed producing regions such as the Midwest, which we discussed in our January 2015 report) have been shown to contribute to increasing food commodity prices,27 which can raise costs for small and large food manufacturers alike. For livestock species, increased body temperatures of 4°F to 5°F above optimum levels can disrupt performance, production and fertility, limiting an animal’s ability to produce meat, milk or eggs. Higher temperatures can also increase animal mortality.

Food systems are resilient at a national and global level, and agricultural producers have proven themselves extremely able to adapt to changing climate conditions. These shifts, however, still carry risks for the individual farming communities most vulnerable to projected climatic changes—and to the food processing supply chains that rely on those farming communities to supply their raw materials.

In the Southeast and Texas, manufacturing is among the fastest-growing economic sectors. But because it is energy-intensive, relies on large fixed capital assets and critical infrastructure, and employs workers who often must be outdoors for part of the day, it is also particularly sensitive to some of the economic risks from unchecked climate change. These risks are significant and vary across the region, with some of the most severe impacts felt in the most southern states. In the next section, we explore climate risks by state in order to highlight those variations and vulnerabilities.

Results By State

Alabama

Alabama’s economy is dependent on multiple sectors that are extremely sensitive to climate fluctuations, most notably manufacturing and agriculture. The Cotton State is the largest producer of cast-iron and steel pipe products in the U.S. It also contributes 12% of the nation’s broilers (young chickens), produces half of the U.S. peanut harvest, and ranks seventh in cotton production among all states.28 Alabama is also home to the third-largest timber acreage in the lower 48 states. All of these industries have supply chains that stretch across the U.S., and as a result, climate impacts affecting Alabama will be felt far beyond the state’s borders.

Heat

Alabama:. Average Summer Temperature. Source: American Climate Prospectus.

Average Summer Temperature. Source: American Climate Prospectus.

Many of Alabama’s climate-related economic troubles will be rooted in rising temperatures driven by heat-trapping greenhouse gas emissions. While climate change will likely increase both summer and winter average temperatures, the impact in Alabama will be most evident in the number of days of extreme heat each year. Since 1980, the typical Alabaman has experienced an average of 12 days per year of temperatures above 95°F. By 2020-2039, that number is likely to more than triple to as many as 41 such days and as many as 75 days per year by mid-century. There is a 1-in-20 chance that Alabama will experience more than 87 days of extreme heat by mid-century—almost three full months each year of temperatures above 95°F.

Figure 1. Extremely hot and humid temperatures will likely lead to more heat- related deaths in Alabama, with hundreds more annual deaths possible by as soon as 2020-2039. Source: American Climate Prospectus.

Extremely hot and humid temperatures will likely lead to more heat- related deaths in Alabama, with hundreds more annual deaths possible by as soon as 2020-2039. Source: American Climate Prospectus.

Heat-Related Mortality (Additional Annual Deaths)

Temperature increases have real impacts on Americans’ lives. In Alabama, extreme heat driven by climate change likely will claim up to 350 additional lives each year by 2020-2039 and up to 760 additional lives by 2040-2059, assuming the current population size.29 For comparison, there were 852 auto fatalities in Alabama in 2013.30

Rising temperatures will also affect Alabama’s wider economy. Our research shows that even seemingly small temperature increases can have profound effects on crop yields, labor productivity and energy costs.

Agriculture

Alabama has more than 43,000 farms covering almost 9 million acres of land. These farms produce a wide range of crops, from cotton to peanuts to sod. In fact, about half of all peanuts produced in the United States are harvested within a 100-mile range of Dothan, Alabama.

Alabama faces significant climate risks to its commodity crop output if we stay on our current greenhouse gas emissions pathway. Our research focused on two specific climate impacts—changes in heat and precipitation—and their interaction with four major commodity crops in the Southeast: corn, soybeans, cotton and wheat. Crops are very sensitive to changes in their growing environment, particularly temperature. Small increases in temperatures may benefit plants; however, most crops have a specific threshold beyond which yields decline dramatically. Overall, impacts from climate-related temperature and precipitation changes are highly crop- and location-specific.

Though increased heat has the potential to depress yields, our analysis also takes into account the potential yield benefits from increasing carbon dioxide in the atmosphere, which can stimulate crop growth and potentially reduce or even offset yield declines. Some crops, such as wheat, respond more favorably to this “carbon fertilization” effect than do others, such as corn.31 On the other hand, our research does not take into account predicted climate-driven changes in water availability or changes in the prevalence and distribution of pests, weeds, and diseases, which can further influence yield outcomes.

Soybeans were Alabama’s second most valuable crop in 2014 with $193 million of production.32 Absent significant agricultural adaptation, soybean yields will likely decrease by up to 14% by 2020-2039. Alabama’s fourth most valuable crop, corn, will likely experience even steeper production declines. Corn output will likely drop by as much as 22% by 2020-2039 and as much as 44% by 2040-2059.

On the other hand, Alabama wheat benefits more from the “carbon fertilization” effect than it is harmed by temperature increases. As a result, wheat yields are likely to increase over the course of the century as carbon dioxide concentrations continue to rise.

Heat affects more than just crop yields, however. As the second largest producer of broilers in the country after Georgia, Alabama faces risks to the one billion chickens it raises each year.33 Because poultry flocks can only tolerate narrow temperature ranges, high temperatures can disrupt performance, production, and fertility, limiting an animal’s ability to produce meat or eggs. Higher temperatures can also increase animal mortality. In addition, climate change can affect the price and availability of water, feed grains, and pasture, and change patterns of animal diseases. And because energy costs comprise more than 50% of growers’ cash expenses,34 higher energy costs due to climate change have the potential to put additional pressure on this sector.

Labor Productivity

Figure 2. Alabama is likely to face a significant hit to its labor productivity in sectors reliant on outdoor labor. Source: American Climate Prospectus.

Alabama is likely to face a significant hit to its labor productivity in sectors reliant on outdoor labor. Source: American Climate Prospectus.

Change In Labor Productivity

Higher temperatures, spurred by climate change, are likely to drive down labor productivity and overall quality of life in Alabama. Extreme heat stress can induce heat exhaustion or heat stroke and can significantly reduce a person’s ability to carry out daily tasks. By mid-century, heat-related labor productivity declines across all sectors in Alabama will likely cost the state economy up to $1.2 billion each year, with a 1-in-20 chance of costing more than $1.9 billion a year.

Alabama labor productivity has been trending upwards in recent decades,35 but climate change could jeopardize these gains. Workers in high-risk sectors such as agriculture, construction, utilities and manufacturing are among the most vulnerable to higher outdoor temperatures and, therefore, to declining productivity.

In 2011, nearly one in three Alabama employees (about 31%) worked in one of these high-risk sectors. Alabama is likely to experience up to a 0.6% decrease in high-risk labor productivity due to rising temperatures by 2020-2039, increasing to a 1.4% drop in the following 20 years. There is a 1-in-20 likelihood that the state’s high risk labor productivity will decrease by more than 2% by mid-century.

Energy

Figure 3. Rising temperatures will increase statewide demand for electricity for air conditioning. Extreme heat also reduces power system efficiency, which increases costs for both producers and consumers. Source: American Climate Prospectus.

Rising temperatures will increase statewide demand for electricity for air conditioning. Extreme heat also reduces power system efficiency, which increases costs for both producers and consumers. Source: American Climate Prospectus.

Change In Energy Costs

Energy use in Alabama is already well above the national average due to high demand from the state’s manufacturing base, which includes chemicals, primary metals, petroleum, coal, paper products, food products and transportation equipment.36 As temperatures rise, Alabama citizens and businesses are expected to require more air conditioning, which will lead to higher overall electricity demand. At the same time, power plants and transmission lines are known to become less efficient at very high temperatures. This combination of factors will likely require construction of additional power generation capacity to meet higher peak demand, which in turn will lead to higher electricity rates to cover the cost of new construction and transmission.

By 2020-2039, rising electricity demand related solely to climate change is likely to increase residential and commercial energy expenditures by up to 5% in Alabama. Those increases will likely grow to up to 10% by 2040- 2059. Using future changes in temperature mapped against today’s U.S. energy market, this translates to higher statewide energy expenditures of $742 million each year by mid-century.

Sea Level Rise

Another critical effect of rising heat is higher sea levels. As the atmosphere warms, the oceans warm and expand. Melting ice caps also contribute to higher sea levels. Higher seas lead to more destruction when storms hit, exacerbating the impact of storm surges and expanding the reach of storm-related flooding.

Alabama’s shoreline along the Gulf of Mexico stretches for 60 miles, with an additional 540 miles of tidal shoreline bordering coastal bays, rivers and bayous. This coastal area is an important aspect of the state’s culture and economy, contributing more than $2 billion in annual revenue.37 In response to increased beach erosion, coastal residents have already taken steps to reverse these trends and protect coastal land and infrastructure. For example, the city of Gulf Shores implemented a $6 million beach nourishment project in 2001 to rebuild beachfront land that was damaged in previous years.38 Climate-induced rising sea levels and increased storm surges could threaten such efforts.

Although Alabama only has a small stretch of coastal land, the storm-related coastal damage to businesses and residents along the coast could be significant. The storm-related losses attributed to climate change along the Alabama shoreline are likely to increase by up to $11 million per year on average by 2030, and up to $29 million annually by 2050. These numbers may well be too conservative, as they assume historical levels of hurricane activity, which may increase with climate change.

AL Quick. Alabama Data Quick Reference

Alabama Data Quick Reference


Arkansas

Despite having the smallest population of all the Southeastern states, Arkansas has produced a remarkable number of corporate powerhouses. The state is home to seven Fortune 500 companies, including Wal-Mart, Tyson Foods, Dillard’s and Murphy Oil.39 The presence of these companies in the region has spurred innovation and employment in food processing, retail and the energy sector. However, the Natural State’s main economic drivers are still farms, forests and mining; Arkansas’s dependence on these extractive industries means it is particularly susceptible to climate change risk.

Heat

Arkansas:. Average Summer Temperature. Source: American Climate Prospectus.

Average Summer Temperature. Source: American Climate Prospectus.

Many of Arkansas’ climate-related economic troubles will be rooted in rising temperatures. Our research shows that Arkansas will be among the states most severely harmed by temperature increases if we stay on our current greenhouse gas emissions pathway.

While climate change will likely increase both summer and winter average temperature, the impact in Arkansas will be most evident in the number of days of extreme heat each year. During the past 30 years, the typical Arkansan has experienced an average of 19 days per year of temperatures above 95°F. But by 2020-2039, that number is likely to reach up to 55 such days, and then reach up to 82 days per year by mid-century— more extreme heat than any state besides Arizona experiences today.

Temperature increases have real impacts on Americans’ lives. By 2020-2039, extreme heat driven by climate change will likely claim as many as 300 additional lives each year in Arkansas. Annual additional heat-related deaths due to climate change are likely to climb to as many as 550 by 2040-2059—exceeding the number of auto fatalities that Arkansas suffered in 2013.40

Agriculture

Figure 4. Several of Arkansas’ largest commodity crops face steep potential yield declines as a result of climate change. By mid- century, the state’s corn, cotton and soy crops are likely to be reduced by as much as one-fifth to one-half. Source: American Climate Prospectus.

Several of Arkansas’ largest commodity crops face steep potential yield declines as a result of climate change. By mid- century, the state’s corn, cotton and soy crops are likely to be reduced by as much as one-fifth to one-half. Source: American Climate Prospectus.

Agriculture is Arkansas’ largest industry, adding about $16 billion41 to the state’s economy each year. Soybeans, rice and corn are Arkansas’ main crop commodities and contributed about $3.5 billion to production value in 2014. Cotton and hay are also valuable crops for the state. Arkansas ranks first in acreage use for rice production nationally and third in acreage use for cotton production nationally.42

Arkansas faces significant climate risks to its commodity crop output if we stay on our current greenhouse gas emissions pathway. Our research focused on two specific climate impacts—changes in heat and precipitation—and their interaction with four major commodity crops in the Southeast: corn, soybeans, cotton and wheat. Crops are very sensitive to changes in their growing environment, particularly temperature. Small increases in temperatures may benefit plants; however, most crops have a specific threshold beyond which yields decline dramatically. Overall, impacts from climate-related temperature and precipitation changes are highly crop- and location-specific.

Though increased heat has the potential to depress yields, our analysis also takes into account the potential yield benefits from increasing carbon dioxide in the atmosphere, which can stimulate crop growth and potentially reduce or even offset yield declines. Some crops, such as wheat, respond more favorably to this “carbon fertilization” effect than do others, such as corn. On the other hand, our research does not take into account predicted climate-driven changes in water availability or changes in the prevalence and distribution of pests, weeds and diseases, which can further influence yield outcomes.

With an annual value of $846 million,43 corn is one of Arkansas’s most valuable agricultural commodities. Absent significant agricultural adaptation, state corn yields will likely decrease by up to 33% by 2020-2039 and by up to 59% in the following 20 years; these are sharper likely declines in corn yields than any other state.

Other commodity crops will likely also suffer yield losses. Arkansas is one of the nation’s largest soybean producers, with a 2012 crop covering nearly one-tenth of the state’s land area and worth nearly $1.8 billion.44 But that output will likely drop by as much as 20% by 2020-2039 and as much as 43% by 2040-2059. Meanwhile, the state’s cotton crop (the third largest in the nation) is likely to drop by as much as 20% by 2040-2059.

On the other hand, Arkansas wheat benefits more from the carbon fertilization effect than it is harmed by temperature increases. As a result, wheat yields are likely to increase over the course of the century as carbon dioxide concentrations continue to rise.

By mid-century, the overall likely impacts of climate change on grain, oilseed and cotton yields to the state economy span gains ($227 million per year) to losses ($959 million per year, with a 1-in-20 chance of more than $1.4 billion in losses) due to the potential for economic gains from increases in yields. As corn and soybeans are in the top three crops grown in the state, likely overall losses are larger than gains.

Heat affects more in the agricultural sector than just crop yields, however. As the third biggest producer of broilers in the country after Georgia and Alabama, Arkansas faces risks to the one billion chickens it raises each year.45 Because poultry flocks can tolerate only narrow temperature ranges, high temperatures can disrupt performance, production and fertility, limiting a bird’s ability to produce meat or eggs. Higher temperatures can also increase animal mortality. In addition, climate change can affect the price and availability of water, feed grains and pasture, and can change patterns of animal diseases. And because energy costs comprise more than 50% of growers’ cash expenses,46 higher energy costs due to climate change have the potential to put additional pressure on this sector.

Energy

Figure 5. Rising temperatures will increase statewide demand for electricity for air conditioning. Extreme heat also reduces power system efficiency, which increases costs for both producers and consumers. Source: American Climate Prospectus.

Rising temperatures will increase statewide demand for electricity for air conditioning. Extreme heat also reduces power system efficiency, which increases costs for both producers and consumers. Source: American Climate Prospectus.

Change In Energy Costs

As temperatures rise, Arkansas citizens and businesses are expected to require more air conditioning, which will lead to higher overall electricity demand. At the same time, power plants and transmission lines are known to become less efficient at very high temperatures. This combination of factors will likely require construction of additional power generation capacity to meet higher peak demand, which, in turn, will lead to higher electricity rates to cover the cost of new construction and transmission.

Arkansas consistently ranks among the top 10 states with the highest likely increases in electricity demand. By 2020-2039, rising electricity demand related solely to climate change is likely to increase residential and commercial energy expenditures by up to 7%. Those increases will likely grow to up to 10% by 2040-2059. Using future changes in temperature mapped against today’s U.S. energy market, this translates to higher statewide energy expenditures of $435 million each year by mid-century.

Labor Productivity

Figure 6. Extremely hot and humid temperatures will likely lead to more heat-related deaths in Arkansas, with hundreds more annual deaths possible by as soon as 2020-2039. Source: American Climate Prospectus.

Extremely hot and humid temperatures will likely lead to more heat-related deaths in Arkansas, with hundreds more annual deaths possible by as soon as 2020-2039. Source: American Climate Prospectus.

Heat-Related Mortality (Additional Annual Deaths)

Higher temperatures, spurred by climate change, are likely to drive down both productivity and quality of life in Arkansas. Extreme heat stress can induce heat exhaustion or heat stroke and can significantly reduce a person’s ability to carry out daily tasks. By midcentury, heat-related labor productivity declines across all sectors in Arkansas will likely cost the state economy up to $800 million each year, with a 1-in-20 chance that the cost to the economy could exceed $1.2 billion.

Workers in high-risk sectors such as agriculture, construction, utilities, and manufacturing are among the most vulnerable to higher outdoor temperatures and, therefore, to declining productivity. In 2011, about one in three Arkansas workers (34%) worked in one of these high-risk sectors.

Arkansas has had recent gains in labor productivity,47 but these are at risk as a result of climate change. The state is likely to have among the steepest high-risk labor productivity penalties from warmer temperatures, with up to a 0.9% penalty by 2020-2039, and up to a 1.5% penalty in the following 20 years.

AR Quick. Arkansas Data Quick Reference

Arkansas Data Quick Reference

Florida

As the third most populous state in the nation, with almost 20 million residents, the Sunshine State is the largest in the Southeast. It also boasts the fourth-highest Gross State Product48 in the country, following only California, New York and Texas. The state’s main economic drivers include services, real estate, finance and insurance. Florida is home to 16 Fortune 500 companies, including Office Depot, Publix Super Markets and World Fuel Services. Tourism has become a key economic driver for the state, contributing more than $75 billion to Florida’s economy in 2013.49 Climate change has become a significant threat to the state, especially to its coastal property and infrastructure, which are crucial to Florida’s world-renowned tourism industry and the state’s overall economy.

Sea Level Rise

With more than 8,400 miles of shoreline,50 Florida already faces serious risks from flooding and coastal storms, and climate change is likely to substantially increase these risks. Higher sea levels are a result of rising temperatures: As the atmosphere warms due to the accumulation of heat-trapping greenhouse gases, the oceans also warm and expand. Melting ice caps also contribute to higher sea levels.

Figure 7. More than any other state in the U.S., Florida faces the risk of significant losses of private property as climate change continues to drive sea level rise. Higher seas push both high tide lines and storm surges further inland, expanding the danger zone for property owners. Source: American Climate Prospectus.

More than any other state in the U.S., Florida faces the risk of significant losses of private property as climate change continues to drive sea level rise. Higher seas push both high tide lines and storm surges further inland, expanding the danger zone for property owners. Source: American Climate Prospectus.

Florida Real Estate: Property At Risk

Much of Florida’s critical infrastructure—including roads, railways, ports, airports, and oil and gas facilities—sits at low elevations, and large portions of Miami are built on porous limestone that allows seawater to inundate inland areas even in the presence of physical barriers. At Miami, mean sea level will likely rise 0.8 to 1.3 feet by 2050 and 2.0 to 3.6 feet by 2100.

Florida faces more risk than any other state that private, insurable property could be inundated by high tide, storm surge and sea level rise. By 2030, up to $69 billion in coastal property will likely be at risk of inundation at high tide that is not at risk today. By 2050, the value of property below local high tide levels will increase to up to about $152 billion. Even at mean sea level, losses will be substantial: By 2030, up to about $15 billion in coastal property will likely be flooded statewide. By 2050, the value of property below sea level will increase to as much as $23 billion.

Higher seas also lead to more destruction when storms hit, and Florida is the single most susceptible state in the nation to additional losses from storm damage. When storms batter Florida’s coast, higher seas will exacerbate storm surges and expand the reach of storm-related flooding. The storm-related losses attributed to climate change along the Florida shoreline are likely to increase by as much as $1.3 billion per year on average by 2030, and by as much as $4 billion annually by 2050, bringing Florida’s likely total annual storm damage to as much as $17.2 billion per year by midcentury. These numbers may well be too conservative, as they assume historical levels of hurricane activity, which may increase with climate change.

Heat

Florida:. Average Summer Temperature. Source: American Climate Prospectus.

Average Summer Temperature. Source: American Climate Prospectus.

In addition to sea level rise, Florida is also likely to suffer severe economic impacts that result directly from rising temperatures. During the past 30 years, the typical Floridian has experienced an average of seven days per year with temperatures above 95°F. But by 2020-2039, that number is likely to reach up to 32 such days, and then reach up to 76 days per year by mid-century— more extremely hot days than any state besides Arizona experiences today.

Figure 8. Extremely hot and humid temperatures will likely lead to more heat-related deaths in Florida, with thousands of additional annual deaths likely by mid-century, if not sooner. Source: American Climate Prospectus.

Extremely hot and humid temperatures will likely lead to more heat-related deaths in Florida, with thousands of additional annual deaths likely by mid-century, if not sooner. Source: American Climate Prospectus.

Unlike Arizona, however, Florida is also likely to become vulnerable to a potentially deadly combination of heat and humidity. When experienced together, high levels of heat and humidity impair the human body’s natural ability to cool itself through perspiration. By the end of the century, Florida is likely to experience up to 24 days per year of “extremely dangerous” heat and humidity, with a 1-in-20 likelihood of reaching 35 of these days annually. Such conditions are comparable to the Chicago heat wave of 1995, which killed more than 700 people in six days.

Florida is particularly vulnerable to increases in summer temperatures because of its large share of elderly residents. About 18% of Florida’s population is above the age of 64, making it the state with the highest percentage of elderly residents—and therefore the highest likely increases in heat-related mortality—in the country. By 2020-2039, extreme heat driven by climate change will likely claim as many as 1,840 additional lives each year in Florida. And by mid-century, Florida is likely to suffer more heat-related deaths due to climate change than any other state, with as many as 5,080 additional annual deaths by 2040-2059, of which 90% are expected to affect people over age 64. That’s more than double the number of annual auto fatalities in Florida in 2013.51

Florida's Recreation Economy

A fourth consecutive record-breaking year for tourism in Florida has emphasized the sector’s importance as a driver of local jobs, investment and revenues. Last year, tourism-related jobs increased by 4% to 1.14 million industry-related jobs, and nearly 98 million visitors made their way to the Sunshine State, jumping by 3.5% from the previous year.52 These gains translated into a nearly 8% increase in spending on tourism—reaching about $82 billion, about one-tenth of the state’s total.53 In addition to white sand beaches, Florida boasts amusement parks, wildlife habitats, vibrant urban destinations and the Everglades National Park. Weather and climate are expected to critically affect Florida’s coastal property and infrastructure. Miami Beach, one of Florida’s most vulnerable cities to climate change and one of its most profitable tourism destinations, has developed a $300 million storm water project to protect against rising sea levels. However, the project is funded through taxes and fees collected by the city, and this pool of money grows only when developers build in the region, which is considered one of America’s most vulnerable floodplains. Despite the risk, many real estate developers have continued to build on the Florida coastline. By using the revenue from these expensive properties to defend against rising seas and storm surges, the city is hoping to “out-build” climate change to protect its $27 billion of real estate. But if the city builds and the storm water projects don’t withstand or mitigate the impacts that the changing climate has on Miami Beach, there is a possibility that all of the current real estate and investments in future projects will be swept away.54 Given the value of Florida’s beachfront properties and the importance of its real estate and tourism sectors, the state’s particular vulnerability to rising seas and coastal storms emphasize the high risks these sectors face from unabated climate change.

Labor Productivity

Figure 9. Florida is likely to face a significant hit to its labor productivity in sectors reliant on outdoor labor. Source: American Climate Prospectus.

Florida is likely to face a significant hit to its labor productivity in sectors reliant on outdoor labor. Source: American Climate Prospectus.

Change In Labor Productivity

Higher temperatures, spurred by climate change, are likely to drive down labor productivity and overall quality of life in Florida. Extreme heat stress can induce heat exhaustion or heat stroke and can significantly reduce a person’s ability to carry out daily tasks. By midcentury, heat-related labor productivity declines across all sectors in Florida will likely cost the state economy up to $3.9 billion each year, with a 1-in-20 chance of costing more than $7 billion a year.

Workers in high-risk sectors such as agriculture, construction, utilities and manufacturing are among the most vulnerable to higher outdoor temperatures and, therefore, declining productivity. In 2011, about one in four Florida employees (about 23%) worked in one of these high-risk sectors.

Florida has had recent gains in labor productivity,55 but these are at risk as a result of climate change. The state is likely to have among the steepest labor productivity penalties from warmer temperatures in the country, with likely up to a 1.5% drop by 2040-2059 and a 1-in-20 chance of a 2.4% drop.

Energy

As temperatures rise, Florida citizens and businesses are expected to require more air conditioning, which will lead to higher overall electricity demand. At the same time, power plants and transmission lines are known to become less efficient at very high temperatures. This combination of factors will likely require construction of additional power generation capacity to meet higher peak demand—which in turn will lead to higher electricity rates to cover the cost of new construction and transmission.

Florida consistently ranks among the top 10 states with the highest likely increases in electricity demand. By 2020-2039, rising electricity demand related solely to climate change is likely to increase residential and commercial energy expenditures by up to 9%. Those increases will likely grow to up to 19% by 2040-2059. Using future changes in temperature mapped against today’s U.S. energy market, this translates to higher statewide energy expenditures of $4.3 billion each year by mid-century, with a 1-in-20 chance of reaching more than $5.3 billion.

FL Quick. Florida Data Quick Reference

Florida Data Quick Reference

Georgia

With a population of nearly 10 million, the Peach State is the eighth most populous state in the nation and is home base for 20 Fortune 500 companies, including Coca-Cola, UPS, Delta Air Lines and Home Depot. More than one-fifth of Georgians work in the trade, transportation and utilities industries, and about 15% work in the services sector.56 Compared to the other states in this report, Georgia has the fourth most robust Gross State Product57 (after Texas, Florida, and North Carolina), making it a significant contributor to the national economy. Climate risks, such as extreme heat, will likely critically impact Georgia’s economy, with the potential for significant ripple effects on the national economy.

Heat

Georgia. Average Summer Temperature. Source: American Climate Prospectus.

Average Summer Temperature. Source: American Climate Prospectus.

Many of the Peach State’s climate-related economic troubles will be rooted in rising temperatures driven by heat-trapping greenhouse gas emissions. Our research shows that Georgia will be among the states most severely harmed by temperature increases.

During the past 30 years, the typical Georgian has experienced an average of 11 days per year of temperatures above 95°F. But by 2020-2039, that number is likely to reach up to 33 such days and then reach up to 58 days per year by mid-century—more extreme heat than any states besides Arizona and Nevada experience today.

Temperature increases have real impacts on Americans’ lives. By 2020-2039, extreme heat driven by climate change will likely claim as many as 470 additional lives each year in Georgia. Annual additional heat-related deaths are likely to climb to up to 1040 by 2040-2059— nearly as many auto fatalities as Georgia suffered in 2013.

Labor Productivity

Figure 10. Extremely hot and humid temperatures will likely lead to more heat-related deaths in Georgia, with hundreds more annual deaths possible by as soon as 2020-2039. Source: American Climate Prospectus.

Extremely hot and humid temperatures will likely lead to more heat-related deaths in Georgia, with hundreds more annual deaths possible by as soon as 2020-2039. Source: American Climate Prospectus.

Higher temperatures, spurred by climate change, are likely to drive down labor productivity and overall quality of life in Georgia. Extreme heat stress can induce heat exhaustion or heat stroke and can significantly reduce a person’s ability to carry out daily tasks. By mid-century, heat-related labor productivity declines across all sectors in Georgia will likely cost the state economy up to $2 billion each year, with a 1-in-20 chance of costing more than $3.1 billion a year.

Workers in high-risk sectors such as agriculture, construction, utilities and manufacturing are among the most vulnerable to higher outdoor temperatures and, therefore, declining productivity. In 2011, almost one in three Georgia employees worked in one of these high-risk sectors. Georgia has had recent gains in labor productivity, but these are at risk as a result of climate change. The state will likely see up to a 0.5% penalty in high-risk labor productivity by 2020-2039, and up to a 1.2% penalty in the following 20 years.

Energy

Figure 11. Rising temperatures will increase statewide demand for electricity for air conditioning. Extreme heat also reduces power system efficiency, which increases costs for both producers and consumers. Source: American Climate Prospectus.

Rising temperatures will increase statewide demand for electricity for air conditioning. Extreme heat also reduces power system efficiency, which increases costs for both producers and consumers. Source: American Climate Prospectus.

Change In Energy Costs

As temperatures rise, Georgia citizens and businesses are expected to require more air conditioning, which will lead to higher overall electricity demand. At the same time, power plants and transmission lines are known to become less efficient at very high temperatures. This combination of factors will likely require construction of additional power generation capacity to meet higher peak demand, which in turn will lead to higher electricity rates to cover the cost of new construction and transmission.

Georgia households already use more electricity for air conditioning than the average American household, with 10% of home energy use dedicated to this purpose.58 By 2020-2039, rising electricity demand related solely to climate change is likely to increase residential and commercial energy expenditures by up to 5%. Those increases will likely grow to up to 11% by 2040- 2059. Using future changes in temperature mapped against today’s U.S. energy market, this translates to higher statewide energy expenditures of $1.7 billion each year by mid-century.

Agriculture

Cotton, peanuts and corn are Georgia’s most valuable crop commodities, contributing to more than $1.6 billion in value production for 2014. In fact, Georgia is ranked first in acreage usage in peanut production nationwide and second in acreage use for cotton production.59

Georgia faces significant climate risks to its commodity crop output if we stay on our current greenhouse gas emissions pathway. Our research focused on two specific climate impacts—changes in heat and precipitation—and their interaction with four major commodity crops in the Southeast: corn, soybeans, cotton and wheat. Crops are very sensitive to changes in their growing environment, particularly temperature. Small increases in temperatures may benefit plants; however, most crops have a specific threshold beyond which yields decline dramatically. Overall, impacts from climate-related temperature and precipitation changes are highly crop- and location-specific.

Though increased heat has the potential to depress yields, our analysis also takes into account the potential yield benefits from increasing carbon dioxide in the atmosphere, which can stimulate crop growth and potentially reduce or even offset yield declines. Some crops, such as wheat, respond more favorably to this “carbon fertilization” effect than do others, such as corn. On the other hand, our research does not take into account predicted climate-driven changes in water availability or changes in the prevalence and distribution of pests, weeds and diseases, which can further influence yield outcomes.

With an annual value of $237 million, corn is Georgia’s third most valuable crop.60 Absent significant agricultural adaptation, corn yields will likely decrease by as much as 22% by 2020-2039 and 46% in the following 20 years. The state’s soybean crop is likely to drop by as much as 16% by 2020-2039 and 34% in the following 20 years.

On the other hand, cotton and wheat yields may benefit from the carbon fertilization effect, resulting in potential yield gains. Georgia is one of the nation’s largest cotton producers, with more than 2.5 million bales harvested in 2012. Absent adaptation, cotton yields face mixed potential outcomes, with likely impacts ranging from a 2% drop to a 9% gain by 2020-2039 and a 9% drop to an 18% gain by 2040-2059. Meanwhile, wheat will likely benefit from higher carbon dioxide levels and is more resistant to temperature increases.

Heat affects more in the agricultural sector than just crop yields, however. As the biggest producer of broilers in the country and home to Gainesville, the “poultry capital of the world,” Georgia faces risks to the 1.3 billion chickens it raises each year.61 Because poultry flocks can only tolerate narrow temperature ranges, higher temperatures can disrupt performance, production, and fertility, limiting a bird’s ability to produce meat or eggs. Higher temperatures can also increase animal mortality. In addition, climate change can affect the price and availability of water, feed grains and pasture, and change patterns of animal diseases. And because energy costs comprise more than 50% of growers’ cash expenses,62 higher energy costs due to climate change have the potential to put additional pressure on this sector.

Sea Level Rise

Figure 12. Georgia faces the risk of significant losses of private property as higher seas push storm surges farther inland, causing losses reaching in the hundreds of millions of dollars by as early as 2030.
*Coastal storm damage represents the expected additional damage from coastal storms due to storm surge from higher sea levels, assuming that historical storm activity continues. Source: American Climate Prospectus.

Georgia faces the risk of significant losses of private property as higher seas push storm surges farther inland, causing losses reaching in the hundreds of millions of dollars by as early as 2030.<br /> *Coastal storm damage represents the expected additional damage from coastal storms due to storm surge from higher sea levels, assuming that historical storm activity continues. Source: American Climate Prospectus.

The Georgia coastline is 100 miles long and highly vulnerable to a changing climate. It is home to five major river basins, the city of Savannah, Fort Stewart, the ports of Savannah and Brunswick, and active forestry, manufacturing, and tourist industries. It also hosts the largest saltwater marsh estuary on the eastern seaboard, which protects the coast from storm damage and acts as a nursery for several commercial Atlantic fisheries.

As the atmosphere warms, the oceans warm and expand, causing sea levels to rise. Melting ice caps also contribute to higher sea levels. At Fort Pulaski, near the port of Savannah, mean sea level will likely rise 0.9 to 1.4 feet by 2050 and 2.2 to 3.8 feet by 2100.

Higher seas lead to more destruction when storms hit, exacerbating the impact of storm surges and expanding the reach of storm-related flooding. The storm-related losses attributed to climate change along the Georgia shoreline are likely to increase by as much as $118 million per year on average by 2030, and as much as $413 million annually by 2050, bringing the state’s likely total annual storm damage to as much as $1.1 billion per year by mid-century. And these numbers assume historical levels of hurricane activity, which may well increase with climate change.

GA Quick. Georgia Data Quick Reference

Georgia Data Quick Reference

Kentucky

World-famous for the Kentucky Derby, the Bluegrass State also has a strong manufacturing sector and a robust agricultural economy that benefits from highly fertile soils. The manufacturing sector is considered a bellwether of the state’s economy and accounts for one of every seven jobs in the state.63 Kentucky’s automotive manufacturing sector alone adds about $4 billion annually to the state domestic product and ranks first nationwide (on a per-capita basis) in the production of light vehicles.64 In addition to manufacturing, Kentucky has a strong agricultural sector, as almost 55% of total acreage in the state is covered by farmland.65 Of the state’s 4.4 million people, about 100,000 are employed in the equine industry, which contributes an estimated $4 billion annually to the state’s economy. Climate impacts, such as extreme heat, will likely put various sectors of Kentucky’s economy at risk if we continue on our current emissions pathway.

Heat

Kentucky. Average Summer Temperature. Source: American Climate Prospectus.

Average Summer Temperature. Source: American Climate Prospectus.

Figure 13. Extremely hot and humid temperatures will likely lead to more heat-related deaths in Kentucky, with hundreds more annual deaths possible each year as soon as 2020-2039. Source: American Climate Prospectus.

Extremely hot and humid temperatures will likely lead to more heat-related deaths in Kentucky, with hundreds more annual deaths possible each year as soon as 2020-2039. Source: American Climate Prospectus.

Heat-Related Mortality (Additional Annual Deaths)

Many of Kentucky’s climate-related economic troubles will be rooted in rising temperatures. Climate change will likely increase summer and winter average temperatures, but the impact in Kentucky will be most evident in the number of days of extreme heat each year. During the past 30 years, the typical Kentuckian has experienced an average of 4 days per year of temperatures above 95°F. But by 2020-2039, that number is likely to reach up to 23 such days and then reach up to 44 days per year by mid-century—more extreme heat than Texas experiences today.

Temperature increases have real impacts on Americans’ lives. By 2020-2039, extreme heat driven by climate change will likely claim as many as 300 additional lives each year in Kentucky. Annual additional heat-related deaths due to climate change are likely to climb to as many as 460 by 2040-2059, with a 1-in-20 risk of more than 790 additional deaths. By comparison, Kentucky suffered 638 auto fatalities in 2013.66

Rising temperatures will also indirectly impact Kentucky’s economy and its residents. Even seemingly small temperature increases can have profound effects on crop yields, labor productivity, and energy costs.

Agriculture

Figure 14. Several of Kentucky’s largest commodity crops face steep potential yield declines as a result of climate change. By mid-century, the state’s corn and soy crops are likely to be reduced by as much as one-third to more than one-half. Source: American Climate Prospectus.

Several of Kentucky’s largest commodity crops face steep potential yield declines as a result of climate change. By mid-century, the state’s corn and soy crops are likely to be reduced by as much as one-third to more than one-half. Source: American Climate Prospectus.

Change In Crop Yields

Known for its lush meadows and fertile soils, Kentucky has a thriving agricultural industry, with more than $5 billion of agricultural products sold in 2012.67 The same calcium-rich soils that make Kentucky a major horse breeding state, along with abundant rain and moderate temperatures, provide excellent conditions for both livestock and crop production. With more than 76,000 farms covering 13 million acres of land, the state produces a variety of crops and a large amount of grain in addition for forage land used for hay. Soybeans, corn and hay are Kentucky’s most valuable commodity crops, with the state ranking 10th nationwide in forage land used for hay.68

Kentucky faces significant climate risks to its commodity crop output if we stay on our current greenhouse gas emissions pathway. Our research focused on two specific climate impacts—changes in heat and precipitation—and their interaction with four major commodity crops in the Southeast: corn, soybeans, cotton and wheat. Crops are very sensitive to changes in their growing environment, particularly temperature. Small increases in temperatures may benefit plants; however, most crops have a specific threshold beyond which yields decline dramatically. Overall, impacts from climate-related temperature and precipitation changes are highly crop- and location-specific.

Though increased heat has the potential to depress yields, our analysis also takes into account the potential yield benefits from increasing carbon dioxide in the atmosphere, which can stimulate crop growth and potentially reduce or even offset yield declines. Some crops, such as wheat, respond more favorably to this “carbon fertilization” effect than others, such as corn. On the other hand, our research does not take into account predicted climate-driven changes in water availability or changes in the prevalence and distribution of pests, weeds and diseases, which can further influence yield outcomes.

Several of the state’s agricultural staples, including corn and soybeans, face severe risks from climate change, faring third in the country for projected overall yield losses. With a combined annual value of $1.7 billion,69 corn and soybeans are Kentucky’s two most valuable agricultural commodities. Absent significant agricultural adaptation, state corn yields will likely decrease by up to 22% by 2020-2039 and by up to 47% in the following 20 years. Soybeans, the state’s most valuable crop, will likely see crop yield declines of up to 13% by 2020-2039 and by up to 29% by 2040-2059.

On the other hand, Kentucky wheat benefits more from the carbon fertilization effect than it is harmed by temperature increases. As a result, wheat yields are likely to increase over the course of the century as carbon dioxide concentrations continue to rise.

Heat affects more in the agricultural sector than just crop yields, however. About two-thirds of Kentucky’s agricultural economy is livestock, and the state ranks eighth nationally for broilers and 14th in beef cattle.70 Both poultry and cattle can tolerate only narrow temperature ranges. Higher temperatures can disrupt performance, production and fertility, limiting an animal’s ability to produce meat or eggs. Higher temperatures can also increase animal mortality. In addition, climate change can affect the price and availability of water, feed grains and pasture, and change patterns of animal diseases. And because energy costs comprise more than 50% of growers’ cash expenses,71 higher energy costs due to climate change have the potential to put additional pressure on this sector.

Energy

Figure 15. Rising temperatures will increase statewide demand for electricity for air conditioning. Extreme heat also reduces power system efficiency, which increases costs for both producers and consumers. Source: American Climate Prospectus.

Rising temperatures will increase statewide demand for electricity for air conditioning. Extreme heat also reduces power system efficiency, which increases costs for both producers and consumers. Source: American Climate Prospectus.

As temperatures rise, Kentucky citizens and businesses are expected to require more air conditioning, which will lead to higher overall electricity demand. At the same time, power plants and transmission lines are known to become less efficient at very high temperatures. This combination of factors will likely require construction of additional power generation capacity to meet higher peak demand, which, in turn, will lead to higher electricity rates to cover the cost of new construction and transmission.

By 2020-2039, rising electricity demand related solely to climate change is likely to increase residential and commercial energy expenditures by up to 5%. Those increases will likely grow to up to 9% by 2040-2059. Using future changes in temperature mapped against today’s U.S. energy market, this translates to higher statewide energy expenditures of $454 million each year by mid-century. As one of the top 10 states with the highest energy use per dollar of GSP, Kentucky may feel the impacts of energy costs significantly, with energy-intensive sectors such as aluminum production taking the biggest hit.

Labor Productivity

Higher temperatures, spurred by climate change, are likely to drive down labor productivity and overall quality of life in Kentucky. Extreme heat stress can induce heat exhaustion or heat stroke and can significantly reduce a person’s ability to carry out daily tasks. By mid-century, heat-related labor productivity declines across all sectors in Kentucky will likely cost the state economy up to $770 million each year, with a 1-in-20 chance of costing more than $1.1 billion a year.

Workers in high-risk sectors such as agriculture, construction, utilities and manufacturing are among the most vulnerable to higher outdoor temperatures and, therefore, declining productivity. In 2011, about one in three Kentucky employees (33%) worked in one of these high-risk sectors.

Kentucky has had recent gains in labor productivity,72 but these are at risk as a result of climate change. The state is likely to have among the steepest high-risk labor productivity penalties from warmer temperatures, with up to a 0.5% penalty by 2020-2039, and up to a 1.1% penalty in the following 20 years.

KY Quick. Kentucky Data Quick Reference

Kentucky Data Quick Reference

Louisiana

Long a force in the oil industry, Louisiana is an increasingly important player in the natural gas sector as well. The Pelican State produces more than one-fourth of the nation’s natural gas supplies73 and is home to Henry Hub, an important intersection of natural gas pipelines that allows for the fuel to be transported throughout the country. Petroleum refineries, tourism and agriculture are other pillars of the Louisiana economy. Nationwide, the state ranks second in sugarcane and sweet potato production, third in rice production and fifth in cotton production.74 In the past, Louisiana has been hardest hit by some of the country’s most devastating coastal storms, particularly because its major city, New Orleans, sits below sea level. Climate change is expected to worsen the impact of extreme events for the region, with the potential to threaten Louisiana’s chief industries and to disrupt the national economy.

Sea Level Rise

Louisiana. Average Summer Temperature. Source: American Climate Prospectus.

Average Summer Temperature. Source: American Climate Prospectus.

Louisiana faces the highest rate of sea level rise in the U.S.75 At Grand Isle, for instance, mean sea level will likely rise 1.9 to 2.4 feet by 2050 and 4.1 to 5.8 feet by 2100 if we continue on our current emissions path. Rising seas are a particular issue for this state, where much of the critical infrastructure—including roads, railways, ports, airports, and oil and gas facilities—sits at low elevations or even below sea level. Higher sea levels are caused by rising temperatures: As the atmosphere warms due to heat-trapping greenhouse gases, the oceans also warm and expand. Melting ice caps also contribute to higher sea levels.

Louisiana’s abundance of low-lying coastal infrastructure and its very high rate of coastal erosion and wetland loss make the state uniquely vulnerable to sea level rise.76 By 2030, between $26 billion and $35.5 billion worth of Louisiana coastal property will likely be at risk of inundation during high tide. In the 1-in-20 probability range, expected damage expands only slightly to between $25.9 billion and $36.9 billion. The very high risks that Louisiana faces in the short term are because a certain amount of sea level rise is already “baked in” due to past greenhouse gas emissions. Significant damage to coastal property is very probable unless the state takes drastic action to mitigate these risks.

Figure 16. Louisiana faces the risk of significant losses of private property as climate change continues to drive sea level rise. Higher seas push both high tide lines and storm surges further inland, expanding the danger zone for property owners. Source: American Climate Prospectus.

Louisiana faces the risk of significant losses of private property as climate change continues to drive sea level rise. Higher seas push both high tide lines and storm surges further inland, expanding the danger zone for property owners. Source: American Climate Prospectus.

Louisiana Real Estate: Property At Risk

Mean sea level impacts are similarly dire: up to about $20 billion in Louisiana coastal property will likely be below mean sea level, with a 1-in-20 chance that $22.5 billion will be at risk. By 2050, the value of property below mean sea level will likely increase to as much as $44.8 billion, with a 1-in-20 chance of $51.2 billion in property at risk.

Higher seas also lead to more destruction when storms hit, expanding the reach and impact of storm surges and related flooding. The storm-related losses attributed to climate change along the Louisiana shoreline are likely to increase by up to $275 million per year on average by 2030, and by up to $650 million annually by 2050, bringing the state’s likely total annual storm damage to as much as $2.8 billion per year by mid-century. These numbers may well be too conservative, as they assume historical levels of hurricane activity, which may increase with climate change.

Heat

Figure 17. Extremely hot and humid temperatures will likely lead to more heat-related deaths in Louisiana, with hundreds of additional annual deaths likely by mid-century, if not sooner. Source: American Climate Prospectus.

Extremely hot and humid temperatures will likely lead to more heat-related deaths in Louisiana, with hundreds of additional annual deaths likely by mid-century, if not sooner. Source: American Climate Prospectus.

Heat-Related Mortality (Additional Annual Deaths)

In addition to sea level rise, Louisiana is also likely to suffer severe economic impacts from rising temperatures. During the past 30 years, the typical Louisianan has experienced an average of 12 days per year with temperatures above 95°F. By 2020-2039, that number is likely to reach up to 52 extremely hot days, and then reach up to 82 days per year by mid-century.

As it experiences more extreme heat, Louisiana is also likely to become vulnerable to a potentially deadly combination of heat and humidity. When experienced together, high levels of heat and humidity impair the human body’s natural ability to cool itself through perspiration. By the end of the century, Louisiana is likely to experience up to 30 days per year of “extremely dangerous” heat and humidity, with a 1-in-20 chance of experiencing more than 52 such days. Such conditions are comparable to the Chicago heat wave of 1995, which killed more than 700 people in a single week.77

Temperature increases have real impacts on Americans’ lives. By 2020-2039, extreme heat driven by climate change will likely claim as many as 440 additional lives each year in Louisiana. Annual additional heat-related deaths are likely to climb to as many as 920 by 2040- 2059. By comparison, annual auto fatalities in Louisiana were 703 in 2013.78

Labor Productivity

Higher temperatures spurred by climate change are likely to drive down labor productivity and overall quality of life in Louisiana. Extreme heat stress can induce heat exhaustion or heat stroke and can significantly reduce a person’s ability to carry out daily tasks. By mid-century, heat-related labor productivity declines across all sectors in Louisiana will likely cost the state economy up to $1.8 billion each year, with a 1-in-20 chance of costing more than $2.8 billion a year.

Workers in high-risk sectors such as agriculture, construction, utilities, and manufacturing are among the most vulnerable to higher outdoor temperatures and, therefore, to declining productivity. In 2011, nearly 40% of the Louisiana labor force worked in these high-risk sectors.

Louisiana is one of the states likely to have the steepest high-risk labor productivity penalties from warmer temperatures in the nation, with up to a 0.8% penalty by 2020- 2039, and up to a 1.5% penalty in the following 20 years.

Energy

Figure 18. Rising temperatures will increase statewide demand for electricity for air conditioning. Extreme heat also reduces power system efficiency, which increases costs for both producers and consumers. Source: American Climate Prospectus.

Rising temperatures will increase statewide demand for electricity for air conditioning. Extreme heat also reduces power system efficiency, which increases costs for both producers and consumers. Source: American Climate Prospectus.

As temperatures rise, Louisiana citizens and businesses are expected to need more air conditioning, which will lead to higher overall electricity demand. At the same time, power plants and transmission lines generally become less efficient and effective in the extreme heat. This combination of factors will likely require construction of additional power generation capacity to meet higher peak demand; this in turn will lead to higher electricity rates to cover the cost of new construction and transmission.

Louisiana consistently ranks among the top 10 states with the highest likely increases in electricity demand due to climate change, assuming we stay on our current emission pathway. By 2020-2039, rising electricity demand related solely to climate change is likely to increase residential and commercial energy expenditures by up to 9%. Those increases will likely grow to up to 14% by 2040-2059. Using future changes in temperature mapped against today’s U.S. energy market, this translates to higher statewide energy expenditures of $707 million each year by mid-century.

Agriculture

Figure 19. Louisiana’s most valuable commodity crops face steep potential yield declines as a result of climate change. Source: American Climate Prospectus.

Louisiana’s most valuable commodity crops face steep potential yield declines as a result of climate change. Source: American Climate Prospectus.

Change in Crop Yields

Louisiana’s abundant water supplies, fertile soils and subtropical climate create a diverse agricultural economy. Soybeans, rice, corn, hay and cotton are some of the state’s most valuable commodity crops, contributing about $1.9 billion to production value in 2014. Sugarcane and rice are also influential economic drivers for Louisiana. In fact, the state ranks second in acreage usage for sugarcane production nationwide and third in acreage usage for rice production nationwide.79

Louisiana faces significant climate risks to its commodity crop output if we stay on our current greenhouse gas emissions pathway. Our research focused on two specific climate impacts–changes in heat and precipitation– and their interaction with four major commodity crops in the Southeast: corn, soybeans, cotton and wheat. Crops are very sensitive to changes in their growing environment, particularly temperature. Small increases in temperatures may benefit plants; however, most crops have a specific threshold beyond which yields decline dramatically. Overall, impacts from climate-related temperature and precipitation changes are highly crop- and location-specific.

Though increased heat has the potential to depress yields, our analysis also takes into account the potential yield benefits from increasing carbon dioxide in the atmosphere, which can stimulate crop growth and potentially reduce or even offset yield declines. Some crops, such as wheat, respond more favorably to this “carbon fertilization” effect than others, such as corn. On the other hand, our research does not take into account predicted climate-driven changes in water availability or changes in the prevalence and distribution of pests, weeds and diseases, which can further influence yield outcomes.

With over a million acres grown in the state and an annual value of $881 million,80 soybeans are the most valuable crop in Louisiana. By 2020-2039, Louisiana’s soybean yields are likely to decrease by up to 22%, absent significant agricultural adaptation, with likely yield losses increasing to up to 39% by 2040-2059.

Corn—Louisiana’s third most valuable crop, with an annual value of $296 million81—faces even greater likely yield declines. Absent significant adaptation, the state’s corn crop is likely to decrease by as much as one-fourth (26%) by 2020-2039, and by as much as half (51%) by 2040-2059. Meanwhile, the state’s signature cotton crop is likely to drop by as much as 23% by 2040-2059.

On the other hand, Louisiana wheat benefits more from the carbon fertilization effect than it is harmed by temperature increases. As a result, wheat yields are likely to increase over the course of the century as carbon dioxide concentrations continue to rise.

These yield declines can result in high economic costs. By mid-century, the overall likely impacts of climate change on grain, oilseed, and cotton yields to the state economy span gains ($44 million per year) to losses ($552 million per year, with a 1-in-20 chance of more than $668 million in losses) due to the potential for economic gains from increases in yields. However, as corn and soybeans are in the top three crops grown in the state, overall likely losses are larger than gains.

LA Quick. Louisiana Data Quick Reference

Louisiana Data Quick Reference

Hurricane Katrina: A Decade of Lessons Learned

Ten years ago, Hurricane Katrina made landfall in Louisiana. The hurricane left much of New Orleans under water, with flooding as high as 12 feet in some areas. Residents were trapped in their homes,bridges were wiped out, public utilities and transportation infrastructure were underwater and houses were completely destroyed. Overall, Katrina is estimated to have caused more than $108 billion in property damage across the state, impacting every sector of Louisiana’s economy and disrupting the lives and livelihoods of hundreds of thousands of residents.82

For some Louisiana-based companies and businesses, damage to critical energy and transportation infrastructure disrupted operations for months after the storm. Electricity companies in Louisiana experienced unprecedented damage to energy infrastructure, causing power outages for roughly 800,000 customers. Entergy, the area’s primary energy provider, experienced widespread damage to transmission and distribution systems, including flooded substations and power plants.83 A state report notes that even a year after the storm and tens of millions of dollars in reconstruction spending, critical spans of Interstate 10, Lake Pontchartrain Toll Causeway, and U.S. Route 90 remained impassable. Several key bridges were destroyed, causing severe disruptions to the highway system and rail shipping. Many of the ports in the central Gulf Coast also sustained serious damage, limiting the transport of certain products to markets.84

Ten years after the storm, Louisiana is now a leader in climate preparedness and resilience. In the decade since the hurricane, both government and business actors have taken measures to address climate risks. New Orleans has built a $14.5 billion levee and pumping system to protect the city, while state and federal efforts have focused on coastal protection initiatives. In 2014, Greater New Orleans, Inc. launched the Coalition for Coastal Resilience and Economy, a group of businesses and business leaders that includes representatives from a wide range of sectors including banking, energy, real estate, navigation and manufacturing.85 The coalition advocates for sustainable restoration of Louisiana’s disappearing coastal wetlands, deltas, rivers and coastline, which provide critical protection from storms. Continued partnerships and advocacy for the protection of these valuable coastal regions will not only allow Louisiana to reduce the risks it faces from coastal damage, but will also put the state in a unique position to lead other regions in coastal restoration and protection.

Mississippi

Mississippi is grounded in a rural economy that developed around its large cotton industry in the mid-1800s. Today the state’s population is only around three million, but Mississippi has continued to grow its agricultural industry, including investing heavily in food processing and other related manufacturing.86 The Magnolia State is also famous for the Yazoo and Mississippi rivers that run along its western border. With some of the highest expected temperature increases in the country, Mississippi faces diverse risks to its economy if we stay on our current emissions pathway.

Heat

Mississippi. Average Summer Temperature. Source: American Climate Prospectus.

Average Summer Temperature. Source: American Climate Prospectus.

Many of the Magnolia State’s climate-related economic troubles will be rooted in rising temperatures driven by heat-trapping greenhouse gas emissions. In fact, our research shows that Mississippi will be among the states most severely harmed by temperature increases.

During the past 30 years, the typical Mississippian has experienced an average of 13 days per year of temperatures above 95°F. But by 2020-2039, that number is likely to reach up to 56 such days, and then reach up to 85 days per year by mid-century—more extreme heat than any state besides Arizona experiences today.

Temperature increases have real impacts on Americans’ lives. By 2020-2039, extreme heat driven by climate change will likely claim as many as 260 additional lives each year in Mississippi. Annual additional heat related deaths are likely to climb to 570 by 2040-2059— exceeding the number of auto fatalities that Mississippi suffered in 2013.87

Labor Productivity

Figure 20. Extremely hot and humid temperatures will likely lead to more heat-related deaths in Mississippi, with hundreds more annual deaths possible by as soon as 2020-2039. Source: American Climate Prospectus.

Extremely hot and humid temperatures will likely lead to more heat-related deaths in Mississippi, with hundreds more annual deaths possible by as soon as 2020-2039. Source: American Climate Prospectus.

Heat-Related Mortality (Additional Annual Deaths)

Higher temperatures, spurred by climate change, are likely to drive down labor productivity and overall quality of life in Mississippi. Extreme heat stress can induce heat exhaustion or heat stroke and can significantly reduce a person’s ability to carry out daily tasks. By mid-century, heat-related labor productivity declines across all sectors in Mississippi will likely cost the state economy up to $784 million each year, with a 1-in-20 chance of costing more than $1.3 billion a year.

Workers in high-risk sectors such as agriculture, construction, utilities, and manufacturing are among the most vulnerable to higher outdoor temperatures and thus declining productivity. In 2011, one in three Mississippi employees worked in one of these high-risk sectors.

Mississippi has had recent gains in labor productivity,88 but these are at risk as a result of climate change. The state is amongst the top five states in the country likely to have the steepest high-risk labor productivity penalties from warmer temperatures, with up to a 0.8% penalty by 2020- 2039, and up to a 1.6% penalty in the following 20 years.

Energy

Figure 21. Rising temperatures will increase statewide demand for electricity for air conditioning. Extreme heat also reduces power system efficiency, which increases costs for both producers and consumers. Source: American Climate Prospectus.

Rising temperatures will increase statewide demand for electricity for air conditioning. Extreme heat also reduces power system efficiency, which increases costs for both producers and consumers. Source: American Climate Prospectus.

Change In Energy Costs

As temperatures rise, Mississippi citizens and businesses are expected to require more air conditioning, which will lead to higher overall electricity demand. At the same time, power plants and transmission lines are known to become less efficient at very high temperatures. This combination of factors will likely require construction of additional power generation capacity to meet higher peak demand, which in turn will lead to higher electricity rates to cover the cost of new construction and transmission.

By 2020-2039, rising electricity demand related solely to climate change is likely to increase residential and commercial energy expenditures by up to 6%. Those increases will likely grow to up to 13% by 2040-2059. Using future changes in temperature mapped against today’s U.S. energy market, this translates to higher statewide energy expenditures of $481 million each year by mid-century.

Agriculture

Figure 22. Mississippi’s most valuable largest commodity crops face steep potential yield declines as a result of climate change. Source: American Climate Prospectus.

Mississippi’s most valuable largest commodity crops face steep potential yield declines as a result of climate change. Source: American Climate Prospectus.

Change in Crop Yields

Soybeans, corn, cotton and rice are Mississippi’s most valuable crop commodities, having contributed about $2.2 billion to production value in 2014. In fact, Mississippi ranks fifth in acreage use for cotton production nationwide.89

Mississippi faces significant climate risks to its commodity crop output if we stay on our current greenhouse gas emissions pathway. Our research focused on two specific climate impacts—changes in heat and precipitation—and their interaction with four major commodity crops in the Southeast: corn, soybeans, cotton and wheat. Crops are very sensitive to changes in their growing environment, particularly temperature. Small increases in temperatures may benefit plants; however, most crops have a specific threshold beyond which yields decline dramatically. Overall, impacts from climate-related temperature and precipitation changes are highly crop- and location-specific.

Though increased heat has the potential to depress yields, our analysis also takes into account the potential yield benefits from increasing carbon dioxide in the atmosphere, which can stimulate crop growth and potentially reduce or even offset yield declines. Some crops, such as wheat, respond more favorably to this “carbon fertilization” effect than others, such as corn. On the other hand, our research does not take into account predicted climate-driven changes in water availability or changes in the prevalence and distribution of pests, weeds and diseases, which can further influence yield outcomes.

With an annual value of $1.3 billion,90 soybeans are Mississippi’s most valuable crop. Absent significant agricultural adaptation, soybean yields will likely decrease by as much as 17% by 2020-2039 and as much as 42% in the following 20 years.

Other commodity crops will also suffer yield losses. Mississippi is one of the nation’s largest cotton producers, with nearly one million bales harvested in 2012.91 But, absent adaptation, that output will likely drop by as much as 7% by 2020-2039 and as much as 20% by 2040-2059. The state’s corn crop is likely to drop by as much as 27% by 2020-2039 and as much as 56% in the following 20 years.

On the other hand, Mississippi wheat benefits more from the carbon fertilization effect than it is harmed by temperatures increases. As a result, wheat yields are likely to increase over the course of the century as carbon dioxide concentrations continue to rise.

These yield declines can result in high economic costs. By mid-century, the overall likely impacts of climate change on grain, oilseed and cotton yields to the state economy span gains ($109 million per year) to losses ($800 million per year, with a 1-in-20 chance of more than $1.0 billion in losses) due to the potential for economic gains from increases in yields. As corn, cotton and soybeans are the top three crops grown in the state, overall likely losses are larger than gains.

Sea Level Rise

Another important effect of rising heat is higher sea levels. As the atmosphere warms, the oceans warm and expand. Melting ice caps also contribute to higher sea levels. Higher seas lead to more destruction when storms hit, exacerbating the impact of storm surges and expanding the reach of storm-related flooding.

The storm-related losses attributed to climate change along the Mississippi shoreline are likely to increase by up to $54 million per year on average by 2030, and up to nearly $132 million annually by 2050, bringing the state’s likely total annual storm damage to as much as $912 million per year by mid-century. And these numbers assume historical levels of hurricane activity, which may well increase with climate change.

MS Quick. Mississippi Data Quick Reference

Mississippi Data Quick Reference

North Carolina

Ranking ninth nationally in population, North Carolina boasts close to 10 million residents. The Tar Heel State is famous for having hosted the Wright brothers’ first successful flight in 1903, and today continues to show prowess in aviation and aerospace development, having increased employment in aircraft engineering by 68% since 2012.92 In addition to aviation services, the state’s economy is largely driven by the manufacturing and agricultural sectors; North Carolina ranks fifth nationally for its manufacturing economic output. In fact, manufacturing provides almost a fifth of North Carolina’s gross state product and provides more than 10% of non-farm jobs in the state.93 Meanwhile, the state’s robust agricultural sector accounts for 16% of the workforce and 17% of the state’s income. The state ranks first nationally in the production of tobacco and sweet potatoes and farms more than 80 different commodities, which contribute to a total of $78 billion to the state’s economy.94 Tobacco, cotton, soybeans and corn are all major cash crops in North Carolina. Apart from manufacturing and agriculture, North Carolina also has a booming corporate culture. It is home to six Fortune 500 companies, including Duke Energy and Bank of America. The threats North Carolina faces due to climate change will be felt across the nation’s transportation, manufacturing and agricultural industries.

Heat

North Carolina. Average Summer Temperature. Source: American Climate Prospectus.

Average Summer Temperature. Source: American Climate Prospectus.

Many of North Carolina’s climate-related economic troubles will be rooted in rising temperatures driven by heat-trapping greenhouse gas emissions. While climate change will likely increase summer and winter average temperatures, the impact in North Carolina will be most evident in the number of days of extreme heat each year. Over the past three decades, the typical North Carolinian has experienced an average of seven days per year of temperatures above 95°F. That number is likely to more than triple to as many as 24 such days by 2020-2039, and as many as 39 days per year by mid-century. There is a 1-in-20 chance that North Carolina will experience more than 56 days of extreme heat by mid-century—almost two full months of temperatures above 95°F.

Figure 23. Extremely hot and humid temperatures will likely lead to more heat-related deaths in North Carolina, with hundreds more annual deaths possible by as soon as 2020-2039. Source: American Climate Prospectus.

Extremely hot and humid temperatures will likely lead to more heat-related deaths in North Carolina, with hundreds more annual deaths possible by as soon as 2020-2039. Source: American Climate Prospectus.

Heat-Related Mortality (Additional Annual Deaths)

Temperature increases have real impacts on Americans’ lives. In North Carolina, extreme heat driven by climate change will likely claim up to 500 additional lives each year by 2020-2039 and up to 930 additional lives by 2040-2059, with a 1-in-20 chance of claiming more than 1510 lives. By comparison, there were 1289 auto fatalities in North Carolina in 2013.95

Rising temperatures will also indirectly impact North Carolina’s larger economy. In particular, even seemingly small temperature increases can have profound effects on crop yields, labor productivity, coastal infrastructure, and energy costs.

Sea Level Rise

Figure 24. North Carolina faces the risk of significant losses of private property as coastal storms continue to hit the state’s shores, with losses reaching in the hundreds of millions of dollars by as early as 2030.
*Coastal storm damage represents the expected additional damage from coastal storms due to storm surge from higher sea levels, assuming that historical storm activity continues. Source: American Climate Prospectus.

North Carolina faces the risk of significant losses of private property as coastal storms continue to hit the state’s shores, with losses reaching in the hundreds of millions of dollars by as early as 2030.<br /> *Coastal storm damage represents the expected additional damage from coastal storms due to storm surge from higher sea levels, assuming that historical storm activity continues. Source: American Climate Prospectus.

Another important effect of rising heat is higher sea levels. As the atmosphere warms, the oceans warm and expand. Melting ice caps also contribute to higher sea levels. North Carolina is among the top 10 states with the highest anticipated damage from coastal storms. If we continue on our current emissions path, mean sea level at Wilmington will likely rise 0.8 to 1.4 feet by 2050 and 1.9 to 3.6 feet by 2100. Higher seas lead to more destruction when storms hit, exacerbating the impact of storm surges and expanding the reach of storm-related flooding. The storm-related losses attributed to climate change along the North Carolina shoreline are likely to increase by up to $138 million per year on average by 2030, and up to $512 million annually by 2050, bringing the state’s likely total annual storm damage to more than $1.3 billion per year by mid-century. And these numbers assume historical levels of hurricane activity, which may well increase with climate change.

Even on a day without storms, parts of North Carolina will likely be inundated with water in the coming decades due to rising sea levels. By 2030, up to $4.4 billion in coastal property is likely to be flooded at high tide. By 2050, the value of property below the mean high water mark will likely increase to up to $5.6 billion, with a 1-in-20 chance of more than $12.5 billion.

Agriculture

Agriculture is a key component of North Carolina’s economy. With more than 52,000 farms covering more than eight million acres of land, the state produces a wide variety of crops and ranks eighth nationally for the total value of agricultural products sold. Soybeans, corn and wheat are all top crop items, and though tobacco and cotton production have declined, both remain predominant farm commodities.96

North Carolina faces significant climate risks to its commodity crop output if we stay on our current greenhouse gas emissions pathway. Our research focused on two specific climate impacts—changes in heat and precipitation—and their interaction with four major commodity crops in the Southeast: corn, soybeans, cotton and wheat. Crops are very sensitive to changes in their growing environment, particularly temperature. Small increases in temperatures may benefit plants; however, most crops have a specific threshold beyond which yields decline dramatically. Overall, impacts from climate-related temperature and precipitation changes are highly crop- and location-specific.

Though increased heat has the potential to depress yields, our analysis also takes into account the potential yield benefits from increasing carbon dioxide in the atmosphere, which can stimulate crop growth and potentially reduce or even offset yield declines. Some crops, such as wheat, respond more favorably to this “carbon fertilization” effect than others, such as corn. On the other hand, our research does not take into account predicted climate-driven changes in water availability or changes in the prevalence and distribution of pests, weeds and diseases, which can further influence yield outcomes.

With an annual value of $417 million,97 corn is ranked North Carolina’s third most valuable crop. Absent significant agricultural adaptation, changes in temperature and precipitation will cause a likely decrease in corn yields of up to 21% by 2020-2039. In the following 20 years, losses will likely reach up to 39%, with a 1-in-20 chance of more than a 47% decline.

Soybeans, North Carolina’s most valuable crop after tobacco, will likely face varied yields in the near term but decline sharply in later years. Absent adaptation, soybean yields will likely drop by as much as 10% by 2020-2039 and as much as 19% by 2040-2059.

On the other hand, North Carolina wheat and cotton benefit more from the carbon fertilization effect than they are harmed by temperatures increases. As a result, wheat and cotton yields are likely to increase over the course of the century as carbon dioxide concentrations continue to rise.

Labor Productivity

Higher temperatures, spurred by climate change, are likely to drive down both productivity and quality of life in North Carolina. Extreme heat stress can induce heat exhaustion or heat stroke and can significantly reduce a person’s ability to carry out daily tasks. By mid-century, heat-related labor productivity will likely decline across all sectors in North Carolina and will likely cost the economy up to $1.5 billion statewide each year, with a 1-in-20 likelihood of costing more than $2.2 billion.

Workers in high-risk sectors such as agriculture, construction, utilities and manufacturing are among the most vulnerable to higher outdoor temperatures and therefore declining productivity. In 2011, about 30% of North Carolina employees worked in one of these high-risk sectors.

North Carolina labor productivity has been trending upwards in recent decades,98 but climate change could jeopardize these gains. North Carolina is likely to experience up to a 0.5% decrease in labor productivity due to rising temperatures by 2020-2039 and up to a 0.9% drop in the following 20 years.

Energy

As temperatures rise, North Carolina citizens and businesses are expected to require more air conditioning, which will lead to higher overall electricity demand. At the same time, power plants and transmission lines are known to become less efficient at very high temperatures. This combination of factors will likely require construction of additional power generation capacity to meet higher peak demand, which, in turn, will lead to higher electricity rates to cover the cost of new construction and transmission.

By 2020-2039, rising electricity demand related solely to climate change is likely to increase residential and commercial energy expenditures by up to 5% in North Carolina. Those increases will likely grow to as much as 8% by 2040-2059. Using future changes in temperature mapped against today’s U.S. energy market, this translates to higher statewide energy expenditures of $997 million each year by mid-century.

NC Quick. North Carolina Data Quick Reference

North Carolina Data Quick Reference

Powering a World of Big Data

In North Carolina, large technology companies are making investments that generate jobs and growth while reducing the risk of dangerous climate change. These companies, which include Apple, Facebook and Google, are committed to purchasing renewable energy to power huge data centers, including many recently constructed in the state. Renewable energy produces fewer greenhouse gas emissions that contribute to climate change than conventional fossil fuels.

Apple, for example, has pledged to power its cloud storage system with 100 percent renewable energy. Apple’s Maiden, North Carolina, data center is estimated to need as much power as about 14,000 homes and is powered by two vast neighboring solar energy farms, with plans for a third.

This activity, incentivized by state policies, has driven an expansion in the renewable energy generation. A report by the North Carolina Sustainable Energy Association said investments totaling $900.7 million were made in clean energy and energy efficiency in 2014, up from $47.7 million in 2007.99 The report suggests that energy costs in the state are lower than they would have been had the state continued to use conventional sources of energy.

South Carolina

South Carolina, with a population of more than 4.8 million, is well known for its premier resort destinations of Hilton Head and Myrtle Beach. The state’s tourism industry has recently begun to gain momentum and contributes more than $15 billion dollars to its economy.100 In addition to tourism, the Palmetto State also relies on manufacturing and agriculture to drive its economic output. Soybeans, cotton, corn, peanuts and tobacco bring in $600 million for the state, with South Carolina ranked as the fifth largest producer of tobacco in the nation.101 South Carolina is also home to Domtar, a Fortune 500 paper manufacturing company. While the state is currently experiencing increased economic growth, climate change presents risks to its coastal infrastructure, agricultural yield, and energy demand.

Heat

South Carolina. Average Summer Temperature. Source: American Climate Prospectus.

Average Summer Temperature. Source: American Climate Prospectus.

Many of South Carolina’s climate-related economic troubles will be rooted in rising temperatures driven by heat-trapping greenhouse gas emissions. While climate change will likely increase both summer and winter average temperature, the impact in South Carolina will be most evident in the number of days of extreme heat each year. Over the past three decades, the typical South Carolinian has experienced an average of 14 days per year of temperatures above 95°F. That number is likely to more than double to as many as 36 such days by 2020-2039, and as many as 58 days per year by mid-century.

Temperature increases have real impacts on Americans’ lives. In South Carolina, extreme heat driven by climate change will likely claim as many as 310 additional lives each year by 2020-2039 and as many as 680 additional lives by 2040-2059. By comparison, there were 767 auto fatalities in South Carolina in 2013.102

Rising temperatures will also indirectly impact South Carolina’s economy and its residents. Even seemingly small temperature increases can have profound effects on crop yields, labor productivity, coastal infrastructure, and energy costs.

Sea Level Rise

Figure 25. South Carolina faces the risk of significant losses of private property as higher seas push storm surges farther inland, causing likely losses in the hundreds of millions of dollars by as soon as 2030.
*Coastal storm damage represents the expected additional damage from coastal storms due to storm surge from higher sea levels, assuming that historical storm activity continues. Source: American Climate Prospectus.

South Carolina faces the risk of significant losses of private property as higher seas push storm surges farther inland, causing likely losses in the hundreds of millions of dollars by as soon as 2030.<br /> *Coastal storm damage represents the expected additional damage from coastal storms due to storm surge from higher sea levels, assuming that historical storm activity continues. Source: American Climate Prospectus.

Coastal Storm Damage (Additional)

Another important effect of rising heat is higher sea levels. As the atmosphere warms, the oceans warm and expand. Melting ice caps also contribute to higher sea levels. South Carolina is among the states with the highest anticipated damage from coastal storms, following only Florida, New York, New Jersey, Louisiana and Texas.

If we continue on our current emissions path, mean sea level at Charleston will likely rise 0.9 to 1.4 feet by 2050 and 2.1 to 3.8 feet by 2100. Higher seas lead to more destruction when storms hit, exacerbating the impact of storm surges and expanding the reach of storm-related flooding. The storm-related losses attributed to climate change along the South Carolina coast are likely to increase by up to $213 million per year on average by 2030, and to up to nearly $743 million annually by 2050, bringing the state’s likely total annual storm damage to more than $1.6 billion per year by mid-century. And these numbers assume historical levels of hurricane activity, which may well increase with climate change.

Coastal storm damage poses a significant threat to South Carolina’s tourism industry. South Carolina’s beaches alone generate about $3.5 billion annually and support 81,000 jobs. Other outdoor recreation activities such as fishing, hunting and wildlife viewing contribute an additional $2.2 billion annually to South Carolina’s economy and support nearly 59,000 jobs.103

Even on a day without storms, parts of South Carolina will likely be inundated with water in the coming decades due to rising sea levels. By 2050, the value of property below the mean high water mark will likely increase to up to $5.7 billion.

Agriculture

Agriculture is a key component of South Carolina’s economy. Soybeans, cotton, corn and peanuts are South Carolina’s top crop commodities, and contributed about $566 million to production value in 2014. In fact, South Carolina ranks 10th nationwide in acreage use for cotton production.104

South Carolina faces significant climate risks to its commodity crop output if we stay on our current greenhouse gas emissions pathway. Our research focused on two specific climate impacts—changes in heat and precipitation—and their interaction with four major commodity crops in the Southeast: corn, soybeans, cotton and wheat. Crops are very sensitive to changes in their growing environment, particularly temperature. Small increases in temperatures may benefit plants; however, most crops have a specific threshold beyond which yields decline dramatically. Overall, impacts from climate-related temperature and precipitation changes are highly crop- and location-specific.

Though increased heat has the potential to depress yields, our analysis also takes into account the potential yield benefits from increasing carbon dioxide in the atmosphere, which can stimulate crop growth and potentially reduce or even offset yield declines. Some crops, such as wheat, respond more favorably to this “carbon fertilization” effect than others, such as corn. On the other hand, our research does not take into account predicted climate-driven changes in water availability or changes in the prevalence and distribution of pests, weeds and diseases, which can further influence yield outcomes.

Soybeans are South Carolina’s single most valuable crop, worth over $160 million in 2012.105 But temperature and precipitation changes threaten future the state’s soybean crop. Absent adaptation, soybean yields will likely drop by as much as 14% by 2020-2039 and as much as 26% by 2040-2059. The South Carolina corn industry will likely experience even steeper production declines. Corn output will likely drop by as much as 21% by 2020-2039 and as much as 42% by 2040-2059.

On the other hand, South Carolina wheat and cotton benefit more from the carbon fertilization effect than they are harmed by temperature increases. As a result, wheat and cotton yields are likely to increase over the course of the century as carbon dioxide concentrations continue to rise.

Labor Productivity

Figure 26. Extremely hot and humid temperatures will likely lead to more heat-related deaths in South Carolina, with hundreds more annual deaths possible by as soon as 2020-2039. Source: American Climate Prospectus.

Extremely hot and humid temperatures will likely lead to more heat-related deaths in South Carolina, with hundreds more annual deaths possible by as soon as 2020-2039. Source: American Climate Prospectus.

Heat-Related Mortality (Additional Annual Deaths)

Higher temperatures, spurred by climate change, are likely to drive down both productivity and quality of life in South Carolina. Extreme heat stress can induce heat exhaustion or heat stroke and can significantly reduce a person’s ability to carry out daily tasks. By mid-century, heat-related labor productivity will likely decline across all sectors in South Carolina and will likely cost the economy up to $802 million statewide each year, with a 1-in-20 likelihood of costing more than $1.2 billion.

Workers in high-risk sectors such as agriculture, construction, utilities and manufacturing are among the most vulnerable to higher outdoor temperatures and therefore to declining productivity. In 2011, nearly one in three South Carolina employees (about 30%) worked in one of these high-risk sectors.

South Carolina labor productivity has been trending upwards in recent decades,106 but climate change could jeopardize these gains. South Carolina is likely to experience up to a 0.6% decrease in labor productivity due to rising temperatures by 2020-2039, and up to a 1.1% drop in the following 20 years.

Energy

As temperatures rise, South Carolina citizens and businesses are expected to require more air conditioning, which will lead to higher overall electricity demand. At the same time, power plants and transmission lines are known to become less efficient at very high temperatures. This combination of factors will likely require construction of additional power generation capacity to meet higher peak demand, which in turn will lead to higher electricity rates to cover the cost of new construction and transmission.

By 2020-2039, rising electricity demand related solely to climate change is likely to increase residential and commercial energy expenditures by up to 5% in South Carolina. Those increases will likely grow to up to 11% by 2040-2059. Using future changes in temperature mapped against today’s U.S. energy market, this translates to higher statewide energy expenditures of $637 million each year by mid-century.

SC Quick. South Carolina Data Quick Reference

South Carolina Data Quick Reference

The Rising Tides of South Carolina

Residents of Charleston, South Carolina, are already well acquainted with the impacts of rising waters and intense storms. During especially high tides or heavy downpours, streets in low-lying areas of downtown Charleston can become impassable from floodwaters. Following Hurricane Isaac in 2012, residents of Charleston famously paddled down historic Market Street on kayaks and inflatable mattresses.107

Extreme weather events often grab the headlines, but more minor, localized coastal flooding caused by high tide are becoming more widespread among coastal regions. This type of flooding, referred to as nuisance flooding, causes roadway closures, overwhelms storm water drainage capacity, and deteriorates infrastructure that was not built to withstand frequent inundation. In Charleston, nuisance flooding has increased to about 23 days per year in recent years, up from fewer than five days per year before 1963.108

Already, businesses in South Carolina are working to address this risk. The South Carolina Small Business Chamber of Commerce, in partnership with the American Sustainable Business council, launched a Sea Level Rise Education Project in 2013. The project aimed to educate business owners and tourists about the economic consequences of climate change. During the first phase of the project, approximately 50 businesses used blue tape to mark the projected sea level rises by 2100. South Carolina tourists and customers were encouraged to look for the tape and then write to their elected officials for action on climate change.109

Tennessee

With approximately 6.5 million residents, Tennessee is perhaps best known as the home of Nashville: the state capital and heart of country music. Tennessee’s entertainment industry supports more than 50,000 jobs and generates more than $10 billion in economic output for the region.110 In addition to its film and music industries, Tennessee’s economy is driven also by manufacturing, transportation and utilities sectors. Home to 10 Fortune 500 companies, including FedEx and HCA Holdings, the Volunteer State also has a successful automotive manufacturing industry, energy sector and healthcare sector. However, risks associated with climate change are expected to significantly impact labor productivity and energy consumption, threatening the state’s economy.

Heat

Tennessee. Average Summer Temperature. Source: American Climate Prospectus.

Average Summer Temperature. Source: American Climate Prospectus.

Many of Tennessee’s climate-related economic troubles will be rooted in rising temperatures driven by heat-trapping greenhouse gas emissions. While climate change will likely increase both summer and winter average temperatures, the impact in Tennessee will be most evident in the number of days of extreme heat each year. Since 1980, the typical Tennessean has experienced an average of seven days per year of temperatures above 95°F. By 2020-2039, that number is likely to more than quadruple to as many as 29 such days, and as many as 54 days per year by mid-century.

Temperature increases have real impacts on Americans’ lives. In Tennessee, extreme heat driven by climate change will likely claim up to 430 additional lives each year by 2020-2039 and up to 770 lives by 2040-2059. By comparison, there were 995 auto fatalities in Tennessee in 2013.111

Rising temperatures will also indirectly impact Tennessee’s economy and its residents. Even seemingly small temperature increases can have profound effects on crop yields, labor productivity, and energy costs.

Agriculture

Figure 28. Several of Tennessee’s largest commodity crops face steep potential yield declines as a result of climate change. By mid- century, the state’s corn and soy crops are likely to be reduced by as much as one-third to one-half. Source: American Climate Prospectus.

Several of Tennessee’s largest commodity crops face steep potential yield declines as a result of climate change. By mid- century, the state’s corn and soy crops are likely to be reduced by as much as one-third to one-half. Source: American Climate Prospectus.

Change In Crop Yields

Currently, Tennessee has more than 79,000 farms, which cover more than 40% of the state’s land area.112 These farms produce a wide range of commodities, from cattle to soybeans to timber. In fact, Tennessee leads the nation in the production of hardwood flooring and is one of the country’s top timber exporters.113

Tennessee faces significant climate risks to its commodity crop output if we stay on our current greenhouse gas emissions pathway. Our research focused on two specific climate impacts—changes in heat and precipitation—and their interaction with four major commodity crops in the Southeast: corn, soybeans, cotton and wheat. Crops are very sensitive to changes in their growing environment, particularly temperature. Small increases in temperatures may benefit plants; however, most crops have a specific threshold beyond which yields decline dramatically. Overall, impacts from climate-related temperature and precipitation changes are highly crop- and location-specific.

Though increased heat has the potential to depress yields, our analysis also takes into account the potential yield benefits from increasing carbon dioxide in the atmosphere, which can stimulate crop growth and potentially reduce or even offset yield declines. Some crops, such as wheat, respond more favorably to this “carbon fertilization” effect than others, such as corn. On the other hand, our research does not take into account predicted climate-driven changes in water availability or changes in the prevalence and distribution of pests, weeds and diseases, which can further influence yield outcomes.

Planted heavily in west Tennessee, soybeans are the state’s most valuable crop, with $785 million of production in 2014.114 Absent significant agricultural adaptation, soybean yields will likely decrease by as much as 12% by 2020-2039 and by as much as 31% by 2040- 2059. Tennessee’s second most valuable crop, corn, will likely experience even steeper production declines. Corn output will likely drop by as much as 22% by 2020- 2039 and by as much as 47% by mid-century.

On the other hand, some crops in Tennessee (such as wheat and cotton) are likely to see yield increases as carbon dioxide concentrations continue to rise.

Labor Productivity

Figure 27. Extremely hot and humid temperatures will likely lead to more heat-related deaths in Tennessee, with hundreds more deaths each year possible by as soon as 2020-2039. Source: American Climate Prospectus.

Extremely hot and humid temperatures will likely lead to more heat-related deaths in Tennessee, with hundreds more deaths each year possible by as soon as 2020-2039. Source: American Climate Prospectus.

Higher temperatures, spurred by climate change, are likely to drive down both productivity and quality of life in Tennessee. Extreme heat stress can induce heat exhaustion or heat stroke and can significantly reduce a person’s ability to carry out daily tasks. By mid-century, heat-related labor productivity declines across all sectors in Tennessee will likely cost the economy up to $1.3 billion statewide each year, with a 1-in-20 likelihood of more than $2.0 billion.

Tennessee labor productivity has been trending upwards in recent decades,115 but climate change could jeopardize these gains. Workers in high-risk sectors such as agriculture, construction, utilities and manufacturing are among the most vulnerable to higher outdoor temperatures and therefore to declining productivity.

In 2011, nearly one in three Tennessee employees (about 31%) worked in one of these high-risk sectors. As a result, Tennessee is likely to experience up to a 0.6% decrease in high-risk labor productivity due to rising temperatures by 2020-2039, and up to a 1.2% drop in the following 20 years.

Energy

As temperatures rise, Tennessee citizens and businesses are expected to require more air conditioning, which will lead to higher overall electricity demand. At the same time, power plants and transmission lines are known to become less efficient at very high temperatures. This combination of factors will likely require construction of additional power generation capacity to meet higher peak demand, which, in turn, will lead to higher electricity rates to cover the cost of new con- struction and transmission.

Residents of Tennessee currently benefit from a cost of electricity that is below the national average. But by 2020-2039, rising electricity demand related solely to climate change is likely to increase residential and commercial energy expenditures by up to 5% in Tennessee. Those increases will likely grow to up to 10% by 2040- 2059. Using future changes in temperature mapped against today’s U.S. energy market, this translates to higher statewide energy expenditures of $777 million each year by mid-century. For a state that uses more energy per dollar of gross state product than more than half the states, these cost increases have the potential to ripple throughout the economy.

TN Quick. Tennessee Data Quick Reference

Tennessee Data Quick Reference

Local Climate Impacts in a Global Economy

Following several years of declining U.S. production and sales, the auto industry in the Southeast and Texas has experienced a recent rebound. While auto manufacturers are still expanding overseas, several companies have chosen to build new production plants in the U.S. as well. Most recently, Toyota opened a plant in Mississippi in 2011, and Volkswagen and Nissan opened new plants in Tennessee in 2011 and 2012.

However, even domestic manufacturing plants source the majority of their auto parts and equipment from international vendors. As a result, domestic plants are not insulated from the ever-increasing risks posed by climate change around the world. The typical motor vehicle contains more than 15,000 parts, and a shortage of even one critical component can severely halt production.116 For example, the 2011 floods in Thailand awakened many auto manufacturers to the threat of natural disasters abroad. The July floods claimed more than 300 lives and suspended operations at more than 14,000 companies in Thailand. According to an analysis by Swiss Re, economic losses caused by natural disasters totaled up to $370 billion in 2011, marking the costliest year on record. The events that Thailand incurred were the second-highest economic global losses in that year, following damages from the tsunami in Japan.

Disruptions to Thai manufacturing caused ripples through the supply chains of companies around the world. U.S.-based companies including Ford Motor Co. and Michelin Tires were forced to suspend operations at their Thai plants.117 Analysts estimated Japanese- based car companies were hit even harder, with production losses exceeding 6,000 units per day as manufacturing plants across Thailand were shuttered by the flood.118 The disaster forced many international manufacturers to consider whether long-term supply chain security was worth sacrificing in pursuit of short-term efficiency and lower costs.119

Texas

Texas has a population of almost 27 million, making it the second most populous state in the nation after California. The Lone Star State is headquarters to 52 Fortune 500 companies, most of which are in the energy or transportation sectors. Texas has more than 300,000 miles of highway and close to 10,500 miles of freight railroads, more than any other state in the nation.120 It is number one in railroad operations and has a significant trading hub around the port of Houston. In addition to transportation, the Texan economy is driven by oil and natural gas, agriculture and livestock, and the engineering sector. Texas produces one-fifth of the country’s oil and almost one-third of the nation’s natural gas.121 The state’s heavy reliance on its natural resources renders it particularly vulnerable to the impacts of climate change.

Heat

Texas. Average Summer Temperature. Source: American Climate Prospectus.

Average Summer Temperature. Source: American Climate Prospectus.

Many of the Lone Star State’s climate-related economic troubles will be rooted in rising temperatures driven by heat-trapping greenhouse gas emissions. Texas will be among the states most severely harmed by temperature increases.

While climate change likely will increase both summer and winter average temperatures, the impact in Texas will be most evident in the number of days of extreme heat each year. During the past 30 years, the typical Texan has experienced an average of 43 days per year of temperatures above 95°F. But by mid-century, that number is likely to reach up to 80 such days, and to reach up to 106 days per year by 2040-2059—more extreme heat than any state besides Arizona experiences today.

Temperature increases have real impacts on Americans’ lives. By 2020-2039, extreme heat driven by climate change will likely claim more than 2,570 additional lives each year in Texas—the highest total number of heat-related deaths for any state. Annual additional heat-related deaths are likely to climb to more than 4,500 by 2040-2059. By comparison, annual auto fatalities in Texas were roughly 3,400 in 2013.122

Rising temperatures will also affect Texas’ wider economy. Our research shows that even seemingly small temperature increases can have profound effects on energy costs, crop yields, labor productivity and coastal infrastructure.

Labor Productivity

Figure 29. Extremely hot and humid temperatures will lead to more heat-related deaths in Texas, with additional deaths in the thousands likely by mid-century, if not sooner. Source: American Climate Prospectus.

Extremely hot and humid temperatures will lead to more heat-related deaths in Texas, with additional deaths in the thousands likely by mid-century, if not sooner. Source: American Climate Prospectus.

Heat-Related Mortality (Additional Annual Deaths)

Higher temperatures, spurred by climate change, are likely to drive down both productivity and quality of life in Texas. Extreme heat stress can induce heat exhaustion or heat stroke and can significantly reduce a person’s ability to carry out daily tasks. By mid-century, heat-related labor productivity will decline across all sectors in Texas, and will likely cost the economy up to $12.5 billion statewide each year, with a 1-in-20 likelihood of costing more than $19.6 billion annually.

Workers in high-risk sectors such as agriculture, construction, utilities and manufacturing are among the most vulnerable to higher outdoor temperatures and therefore to declining productivity. In 2011, more than one in three Texas employees (about 38%) worked in one of these high-risk sectors.

Texas has had recent gains in labor productivity, but these are at risk as a result of climate change. The state is likely to have the steepest labor productivity penalty from warmer temperatures of any state, with up to a 1.1% drop by 2020-2039 and up to a 1.7% drop in the following 20 years.

Energy

Figure 30. Rising temperatures will increase statewide demand for electricity for air conditioning. Extreme heat also reduces power system efficiency, which increases costs for both producers and consumers. Source: American Climate Prospectus.

Rising temperatures will increase statewide demand for electricity for air conditioning. Extreme heat also reduces power system efficiency, which increases costs for both producers and consumers. Source: American Climate Prospectus.

Change In Energy Costs

As temperatures rise, Texas citizens and businesses are expected to require more air conditioning, which will lead to higher overall electricity demand. At the same time, power plants and transmission lines are known to become less efficient at very high temperatures. This combination of factors will likely require construction of additional power generation capacity to meet higher peak demand, which, in turn, will lead to higher electricity rates to cover the cost of new construction and transmission.

Texas consistently ranks among the top 10 states with the highest likely increases in electricity demand. By 2020-2039, rising electricity demand related solely to climate change is likely to increase residential and commercial energy expenditures by up to 7%. Those increases will likely grow to up to 12% by 2040-2059. Using future changes in temperature mapped against today’s U.S. energy market, this translates to higher statewide energy expenditures of $3.7 billion each year by mid-century, with a 1-in-20 chance of increases of just under $5.3 billion.

Agriculture

Cotton, corn and hay make up the three most valuable crop commodities for Texas. In 2014, these three crops contributed to about $4.4 billion to production value. In fact, Texas ranks first nationwide in forage land used for hay and in acreage used for cotton production and ranks fifth nationwide in acreage used for wheat production.123

Texas faces significant climate risks to its commodity crop output if we stay on our current greenhouse gas emissions pathway. Our research focused on
two specific climate impacts—changes in heat and precipitation—and their interaction with four major commodity crops in the Southeast: corn, soybeans, cotton and wheat. Crops are very sensitive to changes in their growing environment, particularly temperature. Small increases in temperatures may benefit plants; however, most crops have a specific threshold beyond which yields decline dramatically. Overall, impacts from climate-related temperature and precipitation changes are highly crop- and location-specific.

Though increased heat has the potential to depress yields, our analysis also takes into account the potential yield benefits from increasing carbon dioxide in the atmosphere, which can stimulate crop growth and potentially reduce or even offset yield declines. Some crops, such as wheat, respond more favorably to this “carbon fertilization” effect than others, such as corn. On the other hand, our research does not take into account predicted climate-driven changes in water availability or changes in the prevalence and distribution of pests, weeds and diseases, which can further influence yield outcomes.

With an annual value of $1.2 billion, corn is ranked Texas’ second most valuable crop.124 Absent significant agricultural adaptation, corn yields will likely decrease by as much as 22% by 2020-2039 and by as much as 39% in the following 20 years.

Other commodity crops will also suffer yield losses. Texas is the nation’s largest cotton producer, producing more than 5 million metric tons in 2012—more than 2.5 times more than the next largest producer, Mississippi. But that output will likely drop by as much as 6% by 2020-2039 and as much as 14% by 2040-2059. The state’s soybean crop is likely to drop by as much as 17% by 2020-2039.

On the other hand, Texas wheat benefits more from the carbon fertilization effect than it is harmed by temperature increases. As a result, wheat yields are likely to increase over the course of the century as carbon dioxide concentrations continue to rise.

Sea Level Rise

Figure 31. Texas already spends a significant amount of money recovering from coastal storm damage. Climate change will act like compound interest on those expenses, adding to the already high costs.
Coastal storm damage represents the expected additional damage from coastal storms due to storm surge from higher sea levels, assuming that historical storm activity continues. Source: American Climate Prospectus.

Texas already spends a significant amount of money recovering from coastal storm damage. Climate change will act like compound interest on those expenses, adding to the already high costs.<br /> Coastal storm damage represents the expected additional damage from coastal storms due to storm surge from higher sea levels, assuming that historical storm activity continues. Source: American Climate Prospectus.

Coastal Storm Damage (Additional)

Another important effect of rising heat is higher sea levels. As the atmosphere warms, the oceans warm and expand. Melting ice caps also contribute to higher sea levels. The largest sea level rise in the U.S. is expected to occur in the western Gulf of Mexico, as rising waters combine with sinking land due to groundwater withdrawal, erosion and sediment compaction.

If we continue on our current emissions path, mean sea level at Galveston will likely rise 1.5 to 2.0 feet by 2050 and 3.2 to 4.9 feet by 2100. Higher seas lead to more destruction when storms hit, exacerbating the impact of storm surges and expanding the reach of storm-related flooding. The storm-related losses attributed to climate change along the Texas shoreline are likely to increase by up to $222 million per year on average by 2030, and up to nearly $650 million annually by 2050, bringing the state’s likely total annual storm damage to more than $3.9 billion per year by mid-century. And these numbers assume historical levels of hurricane activity, which may well increase with climate change.

Even on a calm day, parts of Texas will likely be inundated with water in the coming decades due to rising sea levels: $20.9 billion in Texas coastal property is likely to be flooded at high tide by 2030. By 2050, the value of property below the mean high water mark will increase to nearly $30 billion.

TX Quick. Texas Data Quick Reference

Texas Data Quick Reference

Heat on the Range: Cattle and Climate

Increasing heat has a direct influence on livestock operations, and livestock is Texas’ most valuable agricultural product: Cattle and calves generated $10.5 billion in output in 2012, accounting for nearly half of the state’s agricultural earnings.125 Many livestock species have a limited ability to cope with temperature stresses, and prolonged exposure to extreme heat can affect performance, production and fertility, limiting an animal’s ability to produce meat and milk. Higher temperatures can also increase animal mortality. Climate-controlled infrastructure for livestock can mitigate these effects, but at a cost—the resulting increases in energy use will raise operating costs, and the upfront investments may not be financially viable for small farms.

Extreme temperatures can also increase the severity of droughts.126 Following years of drought, Texas farmers experienced the driest year on record in 2011. The drought dried up once-verdant pastures and caused widespread water shortages. Many of the state’s largest ranches were forced to ship cattle to more fertile northern land to protect their herds. Valuable breeding cows that had been cultivated in Texas since the late 1800s were sent to newly leased land in Wyoming and Nebraska. Many smaller farms were unable to afford to relocate their herds and were forced to sell or slaughter calves and cows.

Climate change can also affect the price, quality and availability of water, feed grains and pasture. For example, water shortages caused by the 2011 drought killed critical feed crops and pastures and as a result the price of hay skyrocketed. Any negative impact on crop productivity, especially for corn and other feedstock grown in Texas and other parts of the U.S., could increase input costs (specifically feed costs) for livestock producers, putting additional pressure on that sector.

Virginia

Virginia is home to some of the country’s most prominent military bases, including Naval Station Norfolk, the world’s largest naval complex. Data centers, the aerospace industry, food processing and the energy sector are the main drivers of the state’s economy. There are approximately 650 data establishments in the Old Dominion that employ more than 10,500 people, and the state is home to the Metropolitan Area Exchange East, which is a crossroads for 70% of the world’s Internet traffic.127 In addition to its prominence with web and technology exchanges, Virginia is also home to more than 65% of all aerospace firms, having a direct economic output of $7.4 billion.128 Given its strategic military and computing importance, Virginia is vulnerable to climate change threats such as sea level rise and increased heat, which jeopardize the state’s U.S. web processing, transportation industry and role in protecting national security.

Heat

Virginia. Average Summer Temperature. Source: American Climate Prospectus.

Average Summer Temperature. Source: American Climate Prospectus.

Many of Virginia’s climate-related economic troubles will be rooted in rising temperatures driven by heat-trapping greenhouse gas emissions. While climate change will likely increase both summer and winter average temperatures, the impact in Virginia will be most evident in the number of days of extreme heat each year. Over the past three decades, the typical Virginian has experienced an average of about six days per year of temperatures above 95°F. That number is likely to more than triple to as many as 20 such days by 2020- 2039 and as many as 33 days per year by mid-century.

Temperature increases have significant impacts on Americans’ lives. In Virginia, extreme heat driven by climate change will likely claim as many as 420 additional lives each year by 2020-2039, and as many as 580 additional lives by 2040-2059. By comparison, there were 740 auto fatalities in Virginia in 2013.129

Rising temperatures will also indirectly impact Virginia’s economy and its residents. Even seemingly small temperature increases can have profound effects on crop yields, labor productivity, coastal infrastructure and energy costs.

Sea Level Rise

Figure 32. Virginia faces the risk of significant losses of private property as climate change continues to drive sea level rise. Higher seas push both high tide lines and storm surges further inland, expanding the danger zone for property owners. Source: American Climate Prospectus.

Virginia faces the risk of significant losses of private property as climate change continues to drive sea level rise. Higher seas push both high tide lines and storm surges further inland, expanding the danger zone for property owners. Source: American Climate Prospectus.

Virginia Real Estate: Property At Risk

Another critical effect of rising heat is higher sea levels. As the atmosphere warms, the oceans warm and expand. Melting ice caps also contribute to higher sea levels. Higher seas lead to more destruction when storms hit, exacerbating the impact of storm surges and expanding the reach of storm-related flooding. Twenty-seven of the United States’ military bases are located in Virginia.

If we continue on our current emissions path, mean sea level at Norfolk will likely rise 1.1 to 1.7 feet by 2050 and 2.5 to 4.4 feet by 2100. Higher seas often lead to a greater likelihood of infrastructure damages, exacerbating the impact of storm surges and expanding the reach of storm-related flooding. The storm-related losses attributed to climate change along the Virginia shoreline are likely to increase by up to $135 million by 2030 and up to $522 million by 2050. And these numbers assume historical levels of hurricane activity, which may well increase with climate change.

Even on a day without storms, parts of Virginia will likely be inundated with water in the coming decades due to rising sea levels. As much as $139 million in property will likely be below local mean sea level by 2030, increasing to as much as $306 million by 2050. The impacts of these various risks to military infrastructure could lead to dangerous economic consequences.

Agriculture

Figure 34. Several of Virginia’s largest commodity crops face steep potential yield declines as a result of climate change. By mid- century, the state’s corn crop is likely to be reduced by as much as one-third. Source: American Climate Prospectus.

Several of Virginia’s largest commodity crops face steep potential yield declines as a result of climate change. By mid- century, the state’s corn crop is likely to be reduced by as much as one-third. Source: American Climate Prospectus.

Virginia’s most valuable crop commodities are hay, soybeans, corn and tobacco. Combined, these four crops contributed about $922 million in production value in 2014.

Virginia faces significant climate risks to its commodity crop output if we stay on our current greenhouse gas emissions pathway. Our research focused on two specific climate impacts—changes in heat and precipitation–and their interaction with four major commodity crops in the Southeast: corn, soybeans, cotton and wheat. Crops are very sensitive to changes in their growing environment, particularly temperature. Small increases in temperatures may benefit plants; however, most crops have a specific threshold beyond which yields decline dramatically. Overall, impacts from climate-related temperature and precipitation changes are highly crop- and location-specific.

Though increased heat has the potential to depress yields, our analysis also takes into account the potential yield benefits from increasing carbon dioxide in the atmosphere, which can stimulate crop growth and potentially reduce or even offset yield declines. Some crops, such as wheat, respond more favorably to this “carbon fertilization” effect than others, such as corn. On the other hand, our research does not take into account predicted climate-driven changes in water availability or changes in the prevalence and distribution of pests, weeds and diseases, which can further influence yield outcomes.

With a combined annual value of $457 million, corn and soybeans are Virginia’s two most valuable agricultural commodities after hay.130 Absent significant agricultural adaptation, corn yields will likely decrease by up to 17% by 2020-2039 and up to 33% in the following 20 years. Meanwhile, soybean yields will likely drop by up to 9% by 2020-2039 and up to 16% by 2040-2059.

On the other hand, Virginia wheat and cotton benefit more from the “carbon fertilization” effect than they are harmed by temperature increases. As a result, wheat and cotton yields are likely to increase over the course of the century as carbon dioxide concentrations continue to rise.

Labor Productivity

Figure 33. Extremely hot and humid temperatures will likely lead to more heat-related deaths in Virginia, with additional hundreds more annual deaths possible by as soon as 2020-2039. Source: American Climate Prospectus.

Extremely hot and humid temperatures will likely lead to more heat-related deaths in Virginia, with additional hundreds more annual deaths possible by as soon as 2020-2039. Source: American Climate Prospectus.

Heat-Related Mortality (Additional Annual Deaths)

Higher temperatures, spurred by climate change, are likely to drive down both productivity and quality of life in Virginia. Extreme heat stress can induce heat exhaustion or heat stroke and can significantly reduce a person’s ability to carry out daily tasks. By mid-century, heat-related labor productivity declines across all sectors in Virginia will likely cost the economy up to $1.1 billion statewide each year, with a 1-in-20 likelihood of costing more than $1.7 billion.

Workers in high-risk sectors such as agriculture, construction, utilities, and manufacturing are among the most vulnerable to higher outdoor temperatures and therefore declining productivity. In 2011, one in five employees worked in one of these high-risk sectors. Virginia is likely to experience up to a 0.4% decrease in labor productivity due to rising temperatures by 2020-2039 and up to a 0.8% drop in the next 20 years.

Energy

Virginia Boat. The USS Wisconsin: Naval Station Norfolk, Virginia, U.S.A.

The USS Wisconsin: Naval Station Norfolk, Virginia, U.S.A.

As temperatures rise, Virginians and their businesses are expected to require more air conditioning, which will lead to higher overall electricity demand and consumption. At the same time, power plants and transmission lines are known to become less efficient at very high temperatures. This combination of factors will likely require construction of additional power generation capacity to meet higher peak demand, which, in turn, will lead to higher electricity rates to cover the cost of new construction and transmission.

By 2020-2039, rising electricity demand related solely to climate change is likely to increase residential and commercial energy expenditures by up to 5% in Virginia. Those increases will likely grow to up to 8% by 2040- 2059. Using future changes in temperature mapped against today’s U.S. energy market, this translates to higher statewide energy expenditures of $815 million each year by mid-century.

VA Quick. Virginia Data Quick Reference

Virginia Data Quick Reference

Conclusion: Mitigating Risks

The Southeast and Texas face multiple significant risks from climate change if the U.S. continues producing greenhouse gas emissions at our current rate. The range and extent of these climate risks makes it clear that staying on our current greenhouse gas emissions pathway will increase vulnerabilities across and throughout every state.

Our research also shows that if we act today to move onto a different path, we can still avoid many of the worst impacts of climate change, particularly those related to extreme heat. We are fully capable of managing and adapting to climate impacts, just as we manage risk in many other areas of our economy and national security—but these responses can only be successful if we begin changing our business and public policy decisions today.

Every year that goes by without a comprehensive public and private sector response to climate change is a year that locks in future climate events that will have a far more devastating effect on our local, regional and national economies. Moreover, both government and the private sector are making investment decisions today—whether in property, infrastructure, or regional and national supply chains—that will be directly affected by climate change in decades to come.

If the government and private sector act now to reduce emissions, the U.S. can considerably reduce the odds of costly climate outcomes. Business and policy leaders in these Southeastern states can play a critical role in mod- eling strong climate resilience and emissions reductions, and in pushing the U.S. into a global leadership position on climate change.

The Risky Business Project does not dictate a preferred set of solutions to climate change; while we fully believe the U.S. can respond to these risks through climate preparedness and mitigation, we do not argue for a specific set of or combination of these policies. Rather, we document the risks and leave it to decision-makers in the business and policy communities to determine their own tolerance for, and specific reactions to, those risks. But the Risk Committee does believe, based on this project’s independent research and the significance of the climate risks it demonstrates, that it is time for all Southeastern business leaders and investors to get involved and rise to the challenge of addressing climate change. The fact is that, just as the investments and economic choices we made over the past several decades have increased our current vulnerability to climate change, so will the choices we make today determine what our nation looks like over the next 25 years, at mid-century, and by 2100.

In short, we have a choice whether we accept the climate risks laid out above or whether we follow another path. This is not a problem for another day. The investments we make today—this week, this month, this year—will determine our economic future.

Three general areas of action can help minimize the risks that Southeastern businesses currently face from climate change:

Change everyday business practices to become more resilient.

Some of the climate impacts we analyzed are already being felt across the nation; indeed, some are already an unalterable part of our economic future. Rational business actors must adapt. In the Southeastern region, the manufacturing and agricultural sectors are on the front lines of climate adaptation. As Risk Committee member Greg Page said, “Farmers are innovators and consummate optimizers. … They persistently demonstrate the ability to adapt to changes in the environment and successfully adopt new technologies.”131 On the manufacturing side, businesses have long had to adjust to changing global conditions and prices that can affect their overall competitiveness.

But this adaptation may come at a price: Some farmers in the most-affected Southeastern states and Texas, for instance, may suffer economic losses in shifting to new crops (with the cost of required new equipment and expertise), if they can afford to shift at all.

Manufacturing firms may not be able to shift entire operations away from the most-affected areas of the region without suffering significant losses. Meanwhile, states across the region are being forced to adapt to climate realities, such as rising energy costs and mortality rates, without adequate financial support from the federal government.

Incorporate climate risk assessment into capital expenditures and balance sheets.

Another area where today’s business investments have a direct relationship to tomorrow’s climate impacts is in long-term capital expenditures, which will live well into the middle of the century and beyond. Today, ratings agencies are evaluating infrastructure projects with a multi-decade life span. Utilities are investing in new power plants and pipelines, and are signing long-term power purchase agreements that rely on those investments. Additionally, real estate investors are making multiple bets on residential and commercial properties.

These investments must be evaluated in terms of the actual climate risk that specific regions face as we approach the middle of this century. In 2010, recognizing this reality, the Securities and Exchange Commission (SEC) issued Interpretive Guidance on climate disclosure, giving companies some idea of how to consider their material risks from climate change. Unfortunately, as of 2013, more than 40% of companies listed on the Standard & Poor’s 500 Index were still not voluntarily disclosing climate risks.132

Institute policies to mitigate and adapt to climate change.

Ultimately, climate change is not just an issue for specific sectors and regions: It is a global issue that demands an effective policy response from the United States. According to the latest Intergovernmental Panel on Climate Change report, the world may have as little as 15 years to “keep planetary warming to a tolerable level,” through an aggressive push to bring down carbon emissions.133

At the Risky Business Project, we focused primarily on modeling our current economic path and the atten- dant climate risks. Because this is the path we are now following as a nation, we need to better understand the potential risks it poses and decide how to respond to those risks—especially those already embedded in our economy because of decisions we made decades ago.

But the path we are on today does not have to be the path we choose to follow tomorrow. Our analysis also looks at alternate pathways that include investments in policy and other efforts to mitigate climate change through lowering greenhouse gas emissions. These alternate pathways could significantly change the climate impacts we discuss above. For example, modest global emission reductions can avoid up to 80% of projected economic costs resulting from increased heat-related mortality and energy demand.

Our goal in this report is not to dictate those policy pathways. However, we do strongly urge the Southeastern U.S. and Texas business community to play an active role in supporting this region’s policymakers and elected officials as they take steps toward climate mitigation and preparedness, so that this region can model the kind of behavior we need to see nationally on these issues. The Southeast and Texas are already taking steps in this direction, with states across the region investing in renewable energy, industrial efficiency, and alternative vehicles and fuels.134 These activities are critical in showing regional public- and private-sector leadership in addressing short-term climate actions and long-term climate risk. Ultimately, the single most effective way for businesses to decrease the risks we have identified in this project is for business leaders to push for strong and consistent public sector action to address those risks.

With this project, we have attempted to provide a common language for how to think about climate risk that is built upon a common language of risk that is already part of every serious business and investment decision we make today. If we have a common, serious, non-partisan language describing the impacts our nation may face from climate change, we can use it as the springboard for a serious, non-partisan discussion of the potential actions we can take to reduce our regional, national and ultimately global climate risks.

View footnotes

  1. These 11 states make up the Southeast region as defined in our inaugural report, “Risky Business: The Economic Risks of Climate Change in the United States,” using National Climate Assessment’s organization of regions around shared geologic characteristics and climate impacts. See U.S. Global Change Research Program, “Regions & Topics,” available at http://www.globalchange.gov/explore (last accessed July 2015).
  2. The “current greenhouse gas emissions pathway” we use throughout the report refers to RCP 8.5, one of the four Representative Concentration Pathways developed by the Integrated Assessment Modeling Consortium. The pathway represents a continuation of recent global emissions growth rates, with atmospheric concentrations of carbon dioxide reaching 940 ppm by 2100.
  3. Kate Gordon, “Risky Business: The Economic Risks of Climate Change in the United States” (New York: The Risky Business Project, 2014). http://riskybusiness.habitatseven.work/uploads/files/RiskyBusiness_Report_WEB_09_08_14.pdf
  4. The Risky Business Project describes the combined levels of high heat and humidity using what “American Climate Prospectus” (Rhodium Group, 2014) calls the Human Heat Stroke Index (HHSI), which is derived from a scientific measure known as wet bulb temperature. Under high Human Heat Stroke Index conditions, core body temperature may rise to the point of heat stroke or death. The ACP classifies HHSI into four categories of ascending severity—I: Uncomfortable; II: Dangerous; III: Extremely dangerous; IV: Extraordinarily dangerous.
  5. Bureau of Labor Statistics, Manufacturing: NAICS 31-33 (U.S. Department of Labor, 2015) http://www.bls.gov/iag/tgs/iag31-33.htm#workforce
  6. International Trade Administration, U.S. Export Fact Sheet (U.S. Department of Commerce, 2014). http://trade.gov/press/press-releases/2014/export-factsheet-october2014-100314.pdf
  7. National Association of Manufacturers, “Manufacturing’s Share of Gross State Product” (2014). http://www.nam.org/Data-and-Reports/State-Manufacturing-Data/2014-State-Manufacturing-Data/Manufacturing-s-Share-of-Gross-State-Product—2014/
  8. Jack Ewing, “BMW to Expand South Carolina Factory,” The New York Times, March 28, 2014. http://www.nytimes.com/2014/03/29/business/bmw-to-invest-1-billion-to-expand-its-south-carolina-factory.html?_r=0
  9. Nancy Amons, “Nissan to expand in Smyrna, bring 1,000 new jobs,” WSMV-TV, March 31, 2015. http://www.wsmv.com/story/28543988/nissan-to-expand-in-smyrna-bring-1000-new-jobs
  10. Linda Conrad, “Japan One Year Later: The Long View On Tech Supply Chains,” Forbes, March 13, 2012. http://www.forbes.com/sites/ciocentral/2012/03/13/japan-one-year-later-the-long-view-on-tech-supply-chain/
  11. Kelly Marchese, Siva Paramasivam and Michael Held, “Bouncing Back: Supply Chain Risk Management Lessons from Post-tsunami Japan,” IndustryWeek, March 9, 2012. http://www.industryweek.com/global-economy/bouncing-back-supply-chain-risk-management-lessons-post-tsunami-japan
  12. Kevin Bullis, “Shale Gas Will Fuel a U.S. Manufacturing Boom,” MIT Technology Review, January 9, 2013. http://www.technologyreview.com/news/509291/shale-gas-will-fuel-a-us-manufacturing-boom/
  13. National Association of Manufacturers, “Manufacturing’s Share of Gross State Product.” http://www.nam.org/Data-and-Reports/State-Manufacturing-Data/2014-State-Manufacturing-Data/Manufacturing-s-Share-of-Gross-State-Product—2014/
  14. Mike Randle, “Petrochemicals and the Southern Manufacturing Renaissance. ”Southern Business and Development, 2015. http://www.sb-d.com/Features/Petrochemicals/tabid/659/Default.aspx
  15. “White House hears local insourcing message,” The Post and Courier, January 16, 2012. http://www.postandcourier.com/apps/pbcs.dll/article?AID=/20120116/ARCHIVES/301169931&template=printart
  16. Joel Kotkin and Michael Shires, “America’s New Industrial Boomtowns,” Forbes, June 19, 2014. http://www.forbes.com/sites/joelkotkin/2014/06/19/americas-new-industrial-boomtowns/
  17. Susan Helper, Timothy Krueger and Howard Wial, “Locating American Manufacturing: Trends in the Geography of Production.” (Washington: Brookings Institution, 2012). http://www.brookings.edu/research/reports/2012/05/09-locating-american-manufacturing-wial
  18. That translates to between $26 billion and $35.5 billion in Louisiana coastal property that will likely be at risk of inundation during high tide. Our analysis only focuses on impacts to residential property, but these numbers are an indicator of the extent of coastal damage and a clear warning of the risks to all coastal infrastructure.
  19. Kate Gordon, “Risky Business: The Economic Risks of Climate Change in the United States” (New York: The Risky Business Project, 2014). http://riskybusiness.habitatseven.work/uploads/files/RiskyBusiness_Report_WEB_09_08_14.pdf
  20. Christine Hauser, “Flooding Takes Economic Toll, and It’s Hardly Done,” The New York Times, May 17, 2011. http://www.nytimes.com/2011/05/18/us/18river.html?_r=0
  21. U.S. Department of Energy, U.S. Energy Sector Vulnerabilities to Climate Change and Extreme Weather, July 2013. http://energy.gov/sites/prod/files/2013/07/f2/20130710-Energy-Sector-Vulnerabilities-Report.pdf
  22. Johnna Rizzo,“How Drought on Mississippi River Impacts You,” National Geographic News, February 1, 2013. http://news.nationalgeographic.com/news/2012/12/121207-nation-mississippi-river-drought-environment-economy
  23. U.S. Bureau of Labor Statistics, The Recession of 2007- 2009. (U.S. Department of Labor, February 2012). http://www.bls.gov/spotlight/2012/recession/pdf/recession_bls_spotlight.pdf
  24. It is important to note that different manufacturers have very different sensitivity to energy prices. For instance, the fertilizer industry’s energy costs as a share of product value range from 50-60%; car and airplane manufacturing’s costs are less than 0.5% of product value.
  25. Ryan Noonan, Made in America: Chemicals. (U.S. Department of Commerce, Economics and Statistics Administration, 2013) http://www.esa.doc.gov/sites/default/files/chemical-manufacturing-industry-profile.pdf
  26. Ryan Noonan, Made in America: Chemicals. (U.S. Department of Commerce, Economics and Statistics Administration, 2013) http://www.esa.doc.gov/sites/default/files/chemical-manufacturing-industry-profile.pdf
  27. Ronald Trostle, Global Agricultural Supply and Demand: Factors Contributing to the Recent Increase in Food Commodity Prices.” (U.S. Department of Agriculture, July 2008). http://www.ers.usda.gov/media/218027/wrs0801_1_.pdf
  28. U.S. Department of Agriculture, 2014 State Agriculture Overview: Alabama. (2015). http://www.nass.usda.gov/Quick_Stats/Ag_Overview/stateOverview.php?state=ALABAMA
  29. Annual death figures in the report were calculated using state- or region-specific heat-related mortality rates multiplied by that region’s 2012 population.
  30. Insurance Institute for Highway Safety, “Highway Loss Data Institute: Fatality Facts” (2014). http://www.iihs.org/iihs/topics/t/general-statistics/fatalityfacts/state-by-state-overview
  31. The magnitude of this effect is still an area of active study, so we advise caution in interpreting results. The effect of removing carbon fertilization has different effects for different crops, but in all cases, it causes projected losses to be larger.
  32. U.S. Department of Agriculture, 2014 State Agriculture Overview: Alabama
  33. National Agricultural Statistics Service, Poultry— Production and Value 2014 Summary. (U.S. Department of Agriculture, 2015) http://www.usda.gov/nass/PUBS/TODAYRPT/plva0415.pdf
  34. Y. Liang and others, “Energy Use Analysis of Open- Curtain vs. Totally Enclosed Broiler Houses in Northwest Arkansas,” Applied Engineering in Agriculture 25(4): 577-584. http://lib.dr.iastate.edu/cgi/viewcontent.cgi?article=1172&context=abe_eng_pubs
  35. Paul W. Bauer and Yoonsoo Lee,“Estimating GSP and Labor Productivity by State” (Cleveland: Federal Reserve Bank of Cleveland, 2006). http://citeseerx.ist.psu.edu/viewdoc/download;jsessionid=D8FEF29569DCD255B9AC1FBCDB287491?doi=10.1.1.188.9915&rep=rep1&type=pdf
  36. U.S. Energy Information Administration, Alabama State Energy Profile. (U.S. Department of Energy, 2015) http://www.eia.gov/state/print.cfm?sid=AL
  37. Scott L. Douglass, “Alabama’s Coastline.” In Encyclopedia of Alabama. (Birmingham: Alabama Humanities Foundation, 2014) http://www.encyclopediaofalabama.org/article/h-2049
  38. Scott L. Douglass, “Alabama’s Coastline.” In Encyclopedia of Alabama. (Birmingham: Alabama Humanities Foundation, 2014) http://www.encyclopediaofalabama.org/article/h-2049
  39. “7 Arkansas Companies on Fortune 500 List,” Arkansas Business News, June 5, 2015. http://www.arkansasbusiness.com/article/105377/7-arkansas-companies-on-fortune-500-list
  40. Insurance Institute for Highway Safety, “Highway Loss Data Institute: Fatality Facts” (2014). http://www.iihs.org/iihs/topics/t/general-statistics/fatalityfacts/state-by-state-overview
  41. Arkansas Farm Bureau, “Arkansas Farming Facts,”(2015). http://www.arfb.com/for-consumers/arkansas-ag-facts/
  42. U.S. Department of Agriculture, 2014 State Agricultural Overview: Arkansas. (2015) http://www.nass.usda.gov/Quick_Stats/Ag_Overview/stateOverview.php?state=ARKANSAS
  43. U.S. Department of Agriculture, 2014 State Agricultural Overview: Arkansas. (2015) http://www.nass.usda.gov/Quick_Stats/Ag_Overview/stateOverview.php?state=ARKANSAS
  44. U.S. Department of Agriculture, 2014 State Agricultural Overview: Arkansas. (2015) http://www.nass.usda.gov/Quick_Stats/Ag_Overview/stateOverview.php?state=ARKANSAS
  45. National Agricultural Statistics Service, Poultry—Production and Value 2014 Summary. (U.S. Department of Agriculture, 2015) http://www.usda.gov/nass/PUBS/TODAYRPT/plva0415.pdf
  46. Y. Liang and others, “Energy Use Analysis of Open- Curtain vs. Totally Enclosed Broiler Houses in Northwest Arkansas,” Applied Engineering in Agriculture 25(4): 577-584. http://lib.dr.iastate.edu/cgi/viewcontent.cgi?article=1172&context=abe_eng_pubs
  47. Paul W. Bauer and Yoonsoo Lee, “Estimating GSP and Labor Productivity by State” (Cleveland: Federal Reserve Bank of Cleveland, 2006). http://citeseerx.ist.psu.edu/viewdoc/download;jsessionid=D8FEF29569DCD255B9AC1FBCDB287491?doi=10.1.1.188.9915&rep=rep1&type=pdf
  48. The Henry J. Kaiser Family Foundation, “Total Gross State Product,” (2013). http://kff.org/other/state-indicator/total-gross-state-product/
  49. Visit Florida, “2013-2014 Annual Report,” (2014) http://visitflorida.org/media/7939/yearinreview2014.pdf
  50. Bureau of the Census, Statistical Abstract of the United States 2012. (U.S. Department of Commerce, 2012), p. 225, table 364.
  51. Insurance Institute for Highway Safety, “Highway Loss Data Institute: Fatality Facts” (2014). http://www.iihs.org/iihs/topics/t/general-statistics/fatalityfacts/state-by-state-overview
  52. Paul W. Bauer and Yoonsoo Lee, “Estimating GSP and Labor Productivity by State” (Cleveland: Federal Reserve Bank of Cleveland, 2006). http://citeseerx.ist.psu.edu/viewdoc/download;jsessionid=D8FEF29569DCD255B9AC1FBCDB287491?doi=10.1.1.188.9915&rep=rep1&type=pdf
  53. Dave Dunwoody, “Florida Tourism Up 4% And Panhandle Looks Strong,” WUWF, February 17, 2015. http://wuwf.org/post/florida-tourism-4-and-panhandle-looks-strong
  54. VISIT FLORIDA Research, (VisitFlorida.com, 2015). http://www.visitfloridamediablog.com/home/florida-facts/research/
  55. Danielle Paquette, “Miami’s climate catch-22: Building waterfront condos to pay for protection against the rising sea,” The Washington Post, December 22, 2014. http://www.washingtonpost.com/news/storyline/wp/2014/12/22/miamis-climate-catch-22-building-luxury-condos-to-pay-for-protection-against-the-rising-sea/
  56. Bureau of Labor Statistics, “Economy at a Glance.” (U.S. Department of Labor, 2015). http://www.bls.gov/eag/eag.ga.htm
  57. The Henry J. Kaiser Family Foundation, “Total Gross State Product,” (2013). http://kff.org/other/state-indicator/total-gross-state-product/
  58. U.S. Energy Information Administration, Georgia State Energy Profile. (U.S. Department of Energy, 2015). http://www.eia.gov/state/print.cfm?sid=GA
  59. U.S. Department of Agriculture, 2014 State Agricultural Overview: Georgia. (2015) http://www.nass.usda.gov/Quick_Stats/Ag_Overview/stateOverview.php?state=GEORGIA
  60. U.S. Department of Agriculture, 2014 State Agricultural Overview: Georgia. (2015) http://www.nass.usda.gov/Quick_Stats/Ag_Overview/stateOverview.php?state=GEORGIA
  61. National Agricultural Statistics Service, Poultry—Production and Value 2014 Summary. (U.S. Department of Agriculture, 2015) http://www.usda.gov/nass/PUBS/TODAYRPT/plva0415.pdf
  62. Y. Liang and others, “Energy Use Analysis of Open-Curtain vs. Totally Enclosed Broiler Houses in Northwest Arkansas,” Applied Engineering in Agriculture 25(4): 577-584. http://lib.dr.iastate.edu/cgi/viewcontent.cgi?article=1172&context=abe_eng_pubs
  63. Business Climate, “Kentucky Economic Development,” (2015). http://businessclimate.com/kentucky-economic-development/manufacturing
  64. Kentucky Automotive Industry Association, “KAIA Fact Sheet,” (2014). http://kyautoindustry.com/wp-content/uploads/2014/07/KAIA_Fact_Sheet.pdf
  65. Kentucky Farm Bureau, “Kentucky Agriculture Facts,” (2013). https://www.kyfb.com/media/files/fed/home-page/2013/CommodityBooklet.pdf
  66. Insurance Institute for Highway Safety, “Highway Loss Data Institute: Fatality Facts” (2014). http://www.iihs.org/iihs/topics/t/general-statistics/fatalityfacts/state-by-state-overview
  67. U.S. Department of Agriculture, 2014 State Agricultural Overview: Kentucky. http://www.nass.usda.gov/Quick_Stats/Ag_Overview/stateOverview.php?state=KENTUCKY
  68. U.S. Department of Agriculture, 2014 State Agricultural Overview: Kentucky. http://www.nass.usda.gov/Quick_Stats/Ag_Overview/stateOverview.php?state=KENTUCKY
  69. U.S. Department of Agriculture, 2014 State Agricultural Overview: Kentucky. http://www.nass.usda.gov/Quick_Stats/Ag_Overview/stateOverview.php?state=KENTUCKY
  70. National Agricultural Statistics Service, Poultry—Production and Value 2014 Summary. (U.S. Department of Agriculture, 2015) http://www.usda.gov/nass/PUBS/TODAYRPT/plva0415.pdf
  71. Y. Liang and others, “Energy Use Analysis of Open-Curtain vs. Totally Enclosed Broiler Houses in Northwest Arkansas,” Applied Engineering in Agriculture 25(4): 577-584. http://lib.dr.iastate.edu/cgi/viewcontent.cgi?article=1172&context=abe_eng_pubs
  72. Paul W. Bauer and Yoonsoo Lee, “Estimating GSP and Labor Productivity by State” (Cleveland: Federal Reserve Bank of Cleveland, 2006). http://citeseerx.ist.psu.edu/viewdoc/download;jsessionid=D8FEF29569DCD255B9AC1FBCDB287491?doi=10.1.1.188.9915&rep=rep1&type=pdf
  73. State of Louisiana Division of Administration, “About Louisiana: History and Culture.” http://doa.louisiana.gov/about_economy.htm
  74. State of Louisiana Division of Administration, “About Louisiana: History and Culture.” http://doa.louisiana.gov/about_economy.htm
  75. National Oceanic and Atmospheric Administration, Sea Level Trends. (U.S. Department of Commerce, 2013) http://tidesandcurrents.noaa.gov/sltrends/sltrends.html
  76. United States Geological Survey, Louisiana Coastal Wetlands: A Resource at Risk. (U.S. Department of the Interior, 2013) http://pubs.usgs.gov/fs/la-wetlands/
  77. Eric Klinenberg, “Dying Alone.” (University of Chicago Press, 2002).
  78. Insurance Institute for Highway Safety, “Highway Loss Data Institute: Fatality Facts” (2014). http://www.iihs.org/iihs/topics/t/general-statistics/fatalityfacts/state-by-state-overview
  79. U.S. Department of Agriculture, 2014 State Agricultural Overview: Louisiana. http://www.nass.usda.gov/Quick_Stats/Ag_Overview/stateOverview.php?state=LOUISIANA
  80. U.S. Department of Agriculture, 2014 State Agricultural Overview: Louisiana. http://www.nass.usda.gov/Quick_Stats/Ag_Overview/stateOverview.php?state=LOUISIANA
  81. U.S. Department of Agriculture, 2014 State Agricultural Overview: Louisiana. http://www.nass.usda.gov/Quick_Stats/Ag_Overview/stateOverview.php?state=LOUISIANA
  82. Eric S. Blake and Ethan J. Gibney, “The Deadliest,Costliest, and Most Intense United States Tropical Cyclones from 1851 to 2010,” (Miami: National Hurricane Center, National Weather Service, 2011). http://www.nhc.noaa.gov/pdf/nws-nhc-6.pdf
  83. Government Accountability Office, “Climate Change: Energy Infrastructure Risks and Adaptation Efforts,” GAO- 14-74, Report to Congressional Requesters, January 2014. http://www.gao.gov/assets/670/660558.pdf
  84. Lance R. Grenzeback and Andrew T. Lukmann, “Case Study of the Transportation Sector’s Response to and Recovery from Hurricanes Katrina and Rita,” (Cambridge Systematics, Inc., 2007). http://onlinepubs.trb.org/online-pubs/sr/sr290GrenzenbackLukmann.pdf
  85. Caitlin Berni, “GNO, Inc. Announces Coalition for Coastal Resilience and Economy,” (Greater New Orleans, Inc. 2014) http://gnoinc.org/news/publications/press-release/gno-inc-announces-coalition-for-coastal-resilience-and-economy/
  86. “Mississippi Economy,” (Netstate, 2015) http://www.netstate.com/economy/ms_economy.htm
  87. Insurance Institute for Highway Safety, “Highway Loss Data Institute: Fatality Facts” (2014). http://www.iihs.org/iihs/topics/t/general-statistics/fatalityfacts/state-by-state-overview
  88. Paul W. Bauer and Yoonsoo Lee, “Estimating GSP and Labor Productivity by State” (Cleveland: Federal Reserve Bank of Cleveland, 2006). http://citeseerx.ist.psu.edu/viewdoc/download;jsessionid=D8FEF29569DCD255B9AC1FBCDB287491?doi=10.1.1.188.9915&rep=rep1&type=pdf
  89. U.S. Department of Agriculture, 2014 State Agricultural Overview: Mississippi. http://www.nass.usda.gov/Quick_Stats/Ag_Overview/stateOverview.php?state=MISSISSIPPI
  90. U.S. Department of Agriculture, 2014 State Agricultural Overview: Mississippi. http://www.nass.usda.gov/Quick_Stats/Ag_Overview/stateOverview.php?state=MISSISSIPPI
  91. U.S. Department of Agriculture, 2014 State Agricultural Overview: Mississippi. http://www.nass.usda.gov/Quick_Stats/Ag_Overview/stateOverview.php?state=MISSISSIPPI
  92. North Carolina Department of Commerce, “Thrive in North Carolina: Aerospace and Aviation,” (2012) http://marketing.thrivenc.com/acton/attachment/4901/f-001d/1/-/-/-/-/file.pdf
  93. North Carolina Chamber, “Manufacturing,” (2015) http://ncchamber.net/issue-advocacy/manufacturing/; see also U.S. Energy Information Administration, North Carolina State Energy Profile. (U.S. Department of Energy, 2015) http://www.eia.gov/state/data.cfm?sid=NC
  94. North Carolina Department of Agriculture and Consumer Services, “North Carolina Agriculture Overview,” (2015) http://www.ncagr.gov/stats/general/overview.htm
  95. Insurance Institute for Highway Safety, “Highway Loss Data Institute: Fatality Facts” (2014). http://www.iihs.org/iihs/topics/t/general-statistics/fatalityfacts/state-by-state-overview
  96. U.S. Department of Agriculture, 2014 State Agricultural Overview: North Carolina. http://www.nass.usda.gov/Quick_Stats/Ag_Overview/stateOverview.php?state=NORTH%20CAROLINA
  97. U.S. Department of Agriculture, 2014 State Agricultural Overview: North Carolina. http://www.nass.usda.gov/Quick_Stats/Ag_Overview/stateOverview.php?state=NORTH%20CAROLINA
  98. Paul W. Bauer and Yoonsoo Lee, “Estimating GSP and Labor Productivity by State” (Cleveland: Federal Reserve Bank of Cleveland, 2006). http://citeseerx.ist.psu.edu/viewdoc/download;jsessionid=D8FEF29569DCD255B9AC1FBCDB287491?doi=10.1.1.188.9915&rep=rep1&type=pdf
  99. “Economic and Rate Impact Analysis of Clean Energy Development in North Carolina—2015 Update,” (RTI International, 2015) http://c.ymcdn.com/sites/www.energync.org/resource/resmgr/Resources_Page/RTI_2015.pdf
  100. Susan Miskelly, “South Carolina Tourism Information,” Travel Tips, USA Today, 2015. http://traveltips.usatoday.com/south-carolina-tourism-information-16887.html
  101. U.S. Department of Agriculture, 2014 State Agricultural Overview: South Carolina. http://www.nass.usda.gov/Quick_Stats/Ag_Overview/stateOverview.php?state=SOUTHCAROLINA
  102. Insurance Institute for Highway Safety, “Highway Loss Data Institute: Fatality Facts” (2014). http://www.iihs.org/iihs/topics/t/general-statistics/fatalityfacts/state-by-state-overview
  103. South Carolina Department of Natural Resources, “Climate Change Impacts to Natural Resources in South Carolina,” (2013) http://www.dnr.sc.gov/pubs/CCINatResReport.pdf
  104. U.S. Department of Agriculture, 2014 State Agricultural Overview: South Carolina.
  105. U.S. Department of Agriculture, 2014 State Agricultural Overview: South Carolina.
  106. Paul W. Bauer and Yoonsoo Lee, “Estimating GSP and Labor Productivity by State” (Cleveland: Federal Reserve Bank of Cleveland, 2006). http://citeseerx.ist.psu.edu/viewdoc/download;jsessionid=D8FEF29569DCD255B9AC1FBCDB287491?doi=10.1.1.188.9915&rep=rep1&type=pdf
  107. Matthew Carey, “The History Behind Flooding in Charleston, South Carolina,” (NOAA Office for Coastal Management, 2014) https://geozoneblog.wordpress.com/2014/06/24/the-history-behind-flooding-in-charleston-south-carolina/
  108. “NOAA: ‘Nuisance’ flooding an increasing problem as coastal sea levels rise,” (U.S. Department of Commerce, 2014) http://www.noaanews.noaa.gov/stories2014/20140728_nuisanceflooding.html
  109. South Carolina Businesses Acting on Rising Seas, “SCBARS: The Project,” (South Carolina Small Business Chamber of Commerce, 2013) http://www.scbars.org/theproject/project/
  110. Tennessee Department of Economic and Community Development, “Resources,” (TNECD, 2015) http://www.tn.gov/ecd/multimedia_center/pdf/TNECD_Entertainment.pdf
  111. Insurance Institute for Highway Safety, “Highway Loss Data Institute: Fatality Facts” (2014). http://www.iihs.org/iihs/topics/t/general-statistics/fatalityfacts/state-by-state-overview
  112. Tennessee Farm Bureau Federation, “Ag Facts in the U.S.,” (TNFB, 2015) http://www.tnfarmfresh.com/index.asp?view=AgFacts
  113. Tennessee Farm Bureau Federation, “Ag Facts in the U.S.,” (TNFB, 2015) http://www.tnfarmfresh.com/index.asp?view=AgFacts
  114. U.S. Department of Agriculture, 2014 State Agricultural Overview: Tennessee. http://www.nass.usda.gov/Quick_Stats/Ag_Overview/stateOverview.php?state=TENNESSEE
  115. Paul W. Bauer and Yoonsoo Lee, “Estimating GSP and Labor Productivity by State” (Cleveland: Federal Reserve Bank of Cleveland, 2006). http://citeseerx.ist.psu.edu/viewdoc/download;jsessionid=D8FEF29569DCD255B9AC1FBCDB287491?doi=10.1.1.188.9915&rep=rep1&type=pdf
  116. Bill Canis, “The Motor Vehicle Supply Chain: Effects of the Japanese Earthquake and Tsunami,” Congressional Research Service 7-5700, 2011. https://www.fas.org/sgp/crs/misc/R41831.pdf
  117. James Hookway, “Thai Flooding Hits Big Manufacturers,” The Wall Street Journal, October 27, 2011. http://www.wsj.com/articles/SB10001424052970204505304576655173294932528
  118. Jun Yang, “Worst Thai Floods in 50 Years Hit Apple, Toyota Supply Chain,” Bloomberg Business, October 21, 2011. http://www.bloomberg.com/news/articles/2011-10-20/worst-thai-floods-in-50-years-hit-apple-toyota-supply-chains
  119. Hookway, “Thai Flooding.”
  120. Office of the Governor, Economic Development & Tourism, Overview of the Texas Economy, 2015. http://gov.texas.gov/files/ecodev/texas-economic-overview.pdf
  121. “Texas Economy” (Netstate, 2015) http://www.netstate.com/economy/tx_economy.htm
  122. Insurance Institute for Highway Safety, “Highway Loss Data Institute: Fatality Facts” (2014). http://www.iihs.org/iihs/topics/t/general-statistics/fatalityfacts/state-by-state-overview
  123. U.S. Department of Agriculture, 2014 State Agricultural Overview: Texas. http://www.nass.usda.gov/Quick_Stats/Ag_Overview/stateOverview.php?state=TEXAS
  124. Texas Department of Agriculture, “Texas Ag Stats” (2015) https://www.texasagriculture.gov/About/TexasAgStats.aspx
  125. Economic Research Service, State Fact Sheets. (United States Department of Agriculture, 2015) http://www.ers.usda.gov/data-products/state-fact-sheets/state-data.aspx?StateFIPS=48&StateName=Texas
  126. K. Trenberth and others, “Global warming and changes in drought”, Nature Climate Change, 4, 17-22, available at http://www.nature.com/nclimate/journal/v4/n1/full/nclimate2067.html; see also R. Seager and M. Hoerling, “Atmosphere and Ocean Origins of North American Droughts,” Journal of Climate, 27 (2014): 4581–4606. 
  127. Virginia Economic Development Partnership, “Data Centers,” (2015) http://www.yesvirginia.org/KeyIndustries/DataCenter
  128.  Virginia Economic Development Partnership, “Aerospace,” (2015) http://www.yesvirginia.org/KeyIndustries/Aerospace
  129. Insurance Institute for Highway Safety, “Highway Loss Data Institute: Fatality Facts” (2014). http://www.iihs.org/iihs/topics/t/general-statistics/fatalityfacts/state-by-state-overview
  130. U.S. Department of Agriculture, 2014 State Agricultural Overview: Virginia. http://www.nass.usda.gov/Quick_Stats/Ag_Overview/stateOverview.php?state=VIRGINIA
  131. Kate Gordon, “Risky Business: The Economic Risks of Climate Change in the United States” (New York: The Risky Business Project, 2014). http://riskybusiness.habitatseven.work/uploads/files/RiskyBusiness_Report_WEB_09_08_14.pdf
  132. Barry B. Burr, “Ceres: SEC needs to better enforce climate change disclosure requirements,” Pensions and Investments, February 7, 2014. http://www.pionline.com/article/20140207/ONLINE/140209893/ceres-sec-needs-to-better-enforce-climate-change-disclosure-requirements
  133. Justin Gillis, “Climate Efforts Falling Short, U.N. Panel Says,” The New York Times, April 13, 2014. http://www.nytimes.com/2014/04/14/science/earth/un-climate-panel-warns-speedier-action-is-needed-to-avert-disaster.html?_r=0
  134. The Energy Foundation, “The Midwest: A Leader in Clean Energy” (2012). http://www.ef.org/wp-content/uploads/2013/11/2012_EF_Annual_Report.pdf

Share this post

Stay informed

Your email address will never be given to third parties. All of our emails contain an “unsubscribe” link.

Close

Connect with us

Media inquiries General inquiries