Use this Launchpad as a starting place to understand what experience data (X-data) is, how to combine it effectively with operational data (O-data), and how to use both types of data to identify and drive experience improvements. Then explore the key resources included at the bottom of the page to expand your knowledge of this essential XM topic.
The Fundamentals
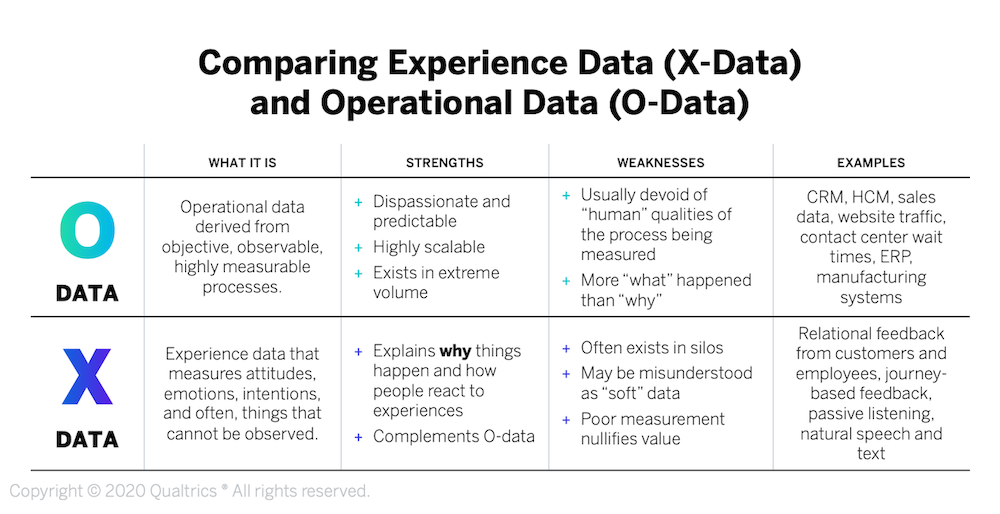
Organizations regularly collect and review the information generated by their operational systems, including enterprise applications like Customer Relationship Management (CRM), Human Resources (HR), financials, and supply chain. These systems produce vast quantities of operational data (O-data), which is what organizations have traditionally used to make most of their decisions. However, while O-data can reveal what has happened in the past, it often lacks insight into why something took place or what is likely to occur in the future.
That’s because O-data lacks a critical element…people. Information that reflects how people – including customers, employees, partners, suppliers, or prospects – think and feel about their interactions with an organization is called “experience data,” or X-data.
X-data provides insight into people’s perceptions of and attitudes towards a company, and it is essential for understanding business operations and making timely adjustments to improve people’s experiences. Additionally, because people’s perceptions and attitudes are often a leading indicator of their future behaviors – like purchasing more, recommending the company, or looking for a new job – X-data allows companies to identify and resolve potential issues before they escalate into significant problems.
Given its importance, organizations need to develop more systematic mechanisms for capturing and analyzing this type of data. The ability to gather the right X-data and combine it with appropriate O-data forms the foundation of the Experience Management (XM) discipline.
Six Types of X-Data
X-data reflects the way people process their experiences, which we’ve described in the Human Experience Cycle. There are six types of X-data that companies should be systematically collecting and analyzing to understand how people are thinking about and judging their interactions with the organization:
Experience Expectations
This is data about how people think and feel about a future interaction with an organization. For example, whether an employee expects a new process to be onerous or whether a customer believes it’s possible to accomplish a service interaction online.
Interaction Perceptions
This is data about how people view a specific interaction with the company. For example, whether a customer was satisfied with a contact center call or whether an employee found an internal town hall meeting valuable.
Journey Perceptions
This is data about how people view a collection of activities that they encountered along their journey to achieve a specific goal. For example, whether an employee was happy with the process of resolving a problem with the IT help desk or whether a customer found it easy to upgrade to a new product.
Relationship Attitudes
This is data about how people feel about an organization, which reflects the overall health of the relationship between a company and its customers, employees, partners, etc. For example, whether a customer is likely to recommend the organization to others or whether an employee has plans to look for a new job.
Choice Preferences
This is data about how people rank different alternatives based on their preferences. For example, which benefit options an employee would like best or which product features a customer favors.
Ad-Hoc Diagnostics
This is data about how people feel about a particular problem or opportunity, which is collected as-needed based on other findings. For example, to understand why a brand message didn’t resonate with prospective customers or why there’s a sudden drop in a supplier’s forecast accuracy.
Six Types of X- & O-Data Insights
While each type of data can provide organizations with valuable insights in and of itself, the real power of XM comes from the capability to combine X- and O-data to drive richer, more impactful insights. To help organizations recognize valuable opportunities for combining these two types of data, the XM Institute has identified six categories of use cases for bringing X- and O-data together:
X-Why
When you find something unexpected or significant in your O-data, look for an underlying explanation in your X-Data. For instance, if your O-data shows that customers who own a certain product aren’t renewing, you could examine their survey feedback and find that they don’t like the new product features.
O-Drivers
When you find something unexpected or significant in your X-data, analyze your O-data to diagnose the operational cause. For instance, if your X-data shows that employees feel less connected with the company mission, you could dig into operational data and find that this drop is mainly occurring in new employees who underwent a new, abbreviated onboarding training.
X&O Predict
Combine X- and O-data to project insights onto a larger population of people or to forecast likely future behaviors or events. For instance, you could combine employee O-data – like job categories, tenure, and past attrition rates – with X-data – like employee engagement or satisfaction scores – to predict future attrition for individual employees.
X&O Personalize
Combine X- and O-data to customize the experiences you deliver to individuals. For instance, you could personalize the contact center experiences of high-value customers (identified through O-data like loyalty status or total lifetime value) whose attitudes have been trending negatively (identified through X-data like CSAT or NPS scores) by automatically routing them to higher-skilled agents who are empowered to do what it takes to resolve their issue and don’t use upsell scripts.
X&O Alert
Combine X- and O-data to proactively send alerts or reports to key stakeholders For instance, a B2B company’s CEO would set up an alert to receive customized account information whenever there is negative feedback in the X-data from one of the top 100 accounts up for renewal, which comes from O-data.
X&O Value
Use X- and O-data to calculate the expected or actual business value of improving an experience. For instance, you could calculate the value of improving the employee onboarding experience by measuring the degree to which new employees who are more satisfied with the experience (X-data) end up with higher performance ratings and longer tenure (O-data).
Tips for Taking Action
So how should an organization go about using X- and O-data to measure and improve the experiences it delivers? Here are some tips for taking action:
Treat X-data as a corporate asset
Large organizations would never manage their critical HR data, customer data, financial data, or supply chain data through a number of disconnected spreadsheets and applications, but that’s how many currently treat their X-data. There’s no single source of truth for this critical data. Given the growing importance and quantity of X-data, organizations need to establish the enterprise capabilities to standardize, share, and control this key corporate asset.
Modernize X-data systems
Unlike O-data, most X-data is solicited or volunteered, making it more onerous to collect. Organizations can modernize their X-data systems by applying four characteristics of O-data systems to their experience data. First, prioritize X-data collection around employee and customer journeys. Second, seamlessly integrate X-data collection into the experience. Third, instrument unstructured listening elements, and fourth, make X- and O-data physically adjacent for leaders.
Look beyond survey data
Historically X-data came almost exclusively from surveys, but it can – and increasingly does – come from a number of other sources, including speech analytics on contact center conversations, text analytics on social media posts or review sites, sentiment analysis on chat transcripts, and video analytics on video ethnographies. So while surveys continue to be a valuable source of insights, you should be capturing X-data using new types of analytical methods as well.
Carefully select the right O-data
Organizations tend to be O-data rich and X-data poor, so they need to be somewhat selective in which O-data they target for driving insights. To determine which O-data to combine with X-data, use both a data-driven approach – like using driver analysis on your data ecosystem or normalizing for volume – as well as a your own business acumen. This may mean selecting O-data that is already close to your X-data – such as store-level sales or Average Handle Time – as well as data that helps you articulate economic value to leadership.
Design for action, not metrics
Organizations often start collecting X-data for the sole purpose of establishing measurements like Net Promoter Score or employee engagement. While metrics can help drive an organization in the right direction, they don’t achieve that benefit all on their own. The true value of X- and O-data comes, not from the measurements themselves, but from the actions organizations take based on the insights generated from the data. To keep from falling into a pattern of reporting metrics without action, leaders should continually ask two questions: “What have you learned?” and “What improvements are you making?”
Tailor insights for different audiences
Many leaders get overly enamored with the notion of the “democratization of data.” But sharing a constant flood of data does not necessarily drive any useful actions. Rather than just making data available, XM professionals need to tailor insights for the needs of specific people in specific roles. Design the content and timing of dashboard, alerts, reports, and any other distribution mechanisms to explicitly support the specific types of decisions that people are making. Ideally, you want to embed X- and O-data insights within existing operational processes.