Reports
Sale

Global Paper Cups Market Size, Share, Trends, Growth, Report: By Cup Type: Hot Paper Cups, Cold Paper Cups; By Wall Type: Single-Wall Paper Cups, Double-Wall Paper Cups, Triple-Wall Paper Cups; By End User: Quick Service Restaurants, Institutional, Household, Others; Regional Analysis; Competitive Landscape; 2024-2032
Global Paper Cups Market Size
The global paper cups market was aided by the growing consumption of the product. In 2023, the global consumption reached more than USD 10.8 billion in 2023 and expected to increase in the forecast period of 2024-2032 to reach above USD 13.3 billion by 2032, with consumption growing at a CAGR of 3.5% in the forecast period of 2024-2032.
Paper Cups Market Outlook
- The hot beverage cups segment, especially for tea and coffee, is projected to lead the market due to changing lifestyles of millennials.
- The Foodservice Packaging Institute (FPI) reports that the mills accepting cups in mixed paper bales account for more than 75% of United States mixed paper processing demand.
- The increasing need to replace plastic with eco-friendly materials is a major growth driver for the paper cups market.
- QSRs, also known as fast-food restaurants, are growing in number globally, boosting demand and consumption of paper cups during dine-in and takeaway food service activities in these settings.
Read more about this report - REQUEST FREE SAMPLE COPY IN PDF
Paper Cups Market Growth
Paper cups are used widely as carriers for hot and cold beverages like tea, coffee, soft drinks, iced tea, cold coffee, ice creams, and yoghurts, among others. It is often lined with plastic or wax to boost its durability and performance by preventing the liquid from leaking or soaking through the paper.
A shift away from single-use plastics is driving the demand for eco-friendly alternatives like paper cups. Additionally, innovations in paper cup manufacturing, such as recyclable and compostable options have influenced the paper cups market development. Lastly, the rising consumption of coffee and tea, coupled with fast-paced lifestyles, has increased the need for convenient on-the-go packaging solutions, where disposable cups play a vital role.
Key Trends and Developments
Rise in home delivery services, growing emphasis on sustainability, and growing popularity of coffee shops and fast-food outlets are shaping the paper cups market outlook
May 2024
Paper cup recycling in the U.S. has reached a significant milestone, with over 40 paper mills now accepting polyethylene-coated paper cups. This represents a major increase in cup acceptance compared to previous years.
May 2024
South Korea consumed over 940 million disposable cups last year. This figure includes 382 million paper cups and 558 million plastic ones. Moreover, the government is planning a deposit-refund scheme to boost cup recycling rates to 90%.
April 2024
Mother Parkers Tea & Coffee, in collaboration with Graphic Packaging International, has introduced a sustainable Boardio paperboard canister for retail coffee brands, offering a more environmentally friendly packaging option.
September 2023
Dart Container invested in Red Leaf Pulp, a company developing a wheat straw-based pulp mill in Regina, Saskatchewan. The USD 350 million facility will create 110 permanent jobs and will produce 182,000 tonnes of market pulp annually from waste wheat straw.
Shift towards sustainability
One of the most significant trends supporting paper cups market expansion is the growing emphasis on sustainability and eco-friendliness. In July 2021, Lecta launched EraCup Natural, a recyclable, biodegradable, and plastic-free paper-based solution for single-use cups.
Increasing demand for convenience
The rise of on-the-go lifestyles and the growing popularity of coffee shops and fast-food outlets have led to a surge in demand for portable and easy to use paper cups. Companies like Dixie are offering personalised paper cups for events, parties, and businesses, allowing customers to design their cups with logos, messages, or artwork.
Increasing popularity of cold beverages
While hot beverages like coffee and tea have traditionally dominated the paper cups market, the demand for cold beverages is also on the rise. The growing popularity of cold beverages has led to the development of specialised paper cups designed for cold drinks.
Innovations in paper cup design
Manufacturers are introducing new products with improved insulation, anti-leakage properties, and unique shapes to drive paper cups market growth. For example, hot paper cups are partially coated with PE resins and have anti-blocking and thermal insulation properties to keep beverages at the desired temperature.
Paper Cups Market Trends
According to Coca-Cola's Sustainability Report 2020, the company serves around 1.9 billion customers every day and has around 7 billion vending machines worldwide. To dispense soft drinks from vending machines, paper cups are commonly used. As a result, the growth in the overall production capacity of cold beverages is projected to augment the paper cups market growth.
Furthermore, another prominent example of the sustainability trend in the market is the introduction of the "Green Your Cup" initiative by Starbucks. This initiative aims to make the company's iconic white paper cups more environmentally friendly by increasing the use of post-consumer recycled fibre, exploring alternative materials, and promoting recycling in stores.
Read more about this report - REQUEST FREE SAMPLE COPY IN PDF
Paper Cups Industry Segmentation
The EMR’s report titled “Paper Cups Market Report and Forecast 2024-2032” offers a detailed analysis of the market based on the following segments:
Market Breakup by Cup Type
- Hot Paper Cups
- Cold Paper Cups
Market Breakup by Wall Type
- Single-Wall Paper Cups
- Double-Wall Paper Cups
- Triple-Wall Paper Cups
Market Breakup by End User
- Quick Service Restaurants
- Institutional
- Household
- Others
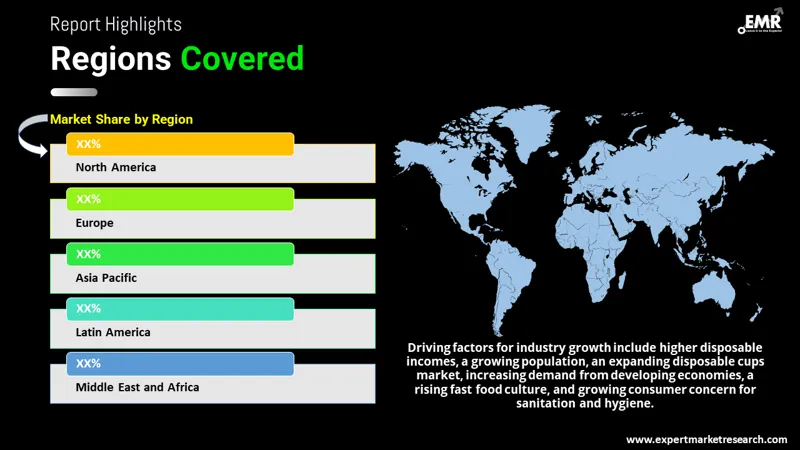
Market Breakup by Region
- North America
- Europe
- Asia Pacific
- Latin America
- Middle East and Africa
Paper Cups Market Share
Hot paper cups are aiding the market expansion of paper cups due to rising global consumption of tea and coffee
The hot paper cups segment holds a substantial share in the market as these cups are preferred for serving hot beverages like coffee and tea due to their insulating properties and anti-blocking PE resin covering. On the other hand, the cold paper cups segment also commands a considerable disposable paper cup market share, driven by its lightweight nature and affordability compared to hot cups. Moreover, the continual usage of single-wall products in serving milk-based beverages and flavoured dairy drinks is expected to fuel growth in this segment.
Single- wall paper cups segment dominate the market share due to their cost-effectiveness
As per paper cups market analysis, single wall cups hold a significant market share, known for their cost-effectiveness and eco-friendly appeal. Companies like BioPak are producing premium single wall BioCup products made from plant-based bioplastic, reducing carbon emissions, and appealing to environmentally conscious consumers. Additionally, double wall cups are gaining traction, especially in cafes and coffee shops, where they are used to serve hot beverages like coffee and tea, offering enhanced insulation and a premium image for brands.
Leading Companies in the Paper Cups Market
Market players are focused on developing eco-friendly materials, innovative designs, and strategic collaborations to stay competitive and meet evolving consumer preferences
Dart Container Corporation, founded in 1937, is a manufacturer of foam cups and containers. The company is headquartered in Mason, Michigan, and offers a wide range of food and beverage packaging solutions made from expanded polystyrene foam, solid polystyrene, polypropylene, PET, paper, and sugar cane.
F Bender Limited was established in 1899 and is based in Wrexham, United Kingdom. The company offers a variety of products, including hot, cold, and vending cups, along with lids and stirrers.
Pactiv LLC, founded in 1959, is a major North American fresh food and beverage packaging manufacturer headquartered in Illinois, United States. The company offers high-quality, recyclable, and renewable material-based products for various industries, including over 14,000 unique items crafted from 14 raw materials.
Konie Cups International, Inc., founded in 2007, headquartered in Florida, United States, caters to food service, janitorial, industrial, garage, and healthcare industries. The company offers leak-proof paper cone and souffle portion cups that provide cost-effective and eco-friendly solutions for condiments, medication administration, and sanitation.
Other key players in the global paper cups market include Jiangsu Yinwang New Material Technology Co., Ltd, Huhtamäki Oyj, Georgia-Pacific Consumer Products LP, Go-Pak Group, Graphic Packaging International, LLC, and Grupo Phoenix, among others.
Read more about this report - REQUEST FREE SAMPLE COPY IN PDF
Paper Cups Market Analysis by Region
North America is a prominent market for paper cups, driven by the regulations encouraging paper use
North America witnessed the largest revenue share in the global paper cups market in 2022, driven by the ban on single-use plastics for disposable cups and the rising preference for sustainable alternatives like paper cups. Presence of many quick service restaurants in North America has also helped in increasing the paper cups market share in the region as they use paper cups for instantly serving beverages.
The Asia Pacific region is also estimated to contribute the largest market share in the global paper cups market over the forecast period, driven by factors such as the thriving fast food culture, increasing consumer preference for sustainable packaging solution, and high demand for coffee and tea.
Key Highlights of the Report
| REPORT FEATURES | DETAILS |
| Base Year | 2023 |
| Historical Period | 2018-2023 |
| Forecast Period | 2024-2032 |
| Scope of the Report |
Historical and Forecast Trends, Industry Drivers and Constraints, Historical and Forecast Market Analysis by Segment:
|
| Breakup by Cup Type |
|
| Breakup by Wall Type |
|
| Breakup by End User |
|
| Breakup by Region |
|
| Market Dynamics |
|
| Competitive Landscape |
|
| Companies Covered |
|
| Report Price and Purchase Option | Explore our purchase options that are best suited to your resources and industry needs. |
| Delivery Format | Delivered as an attached PDF and Excel through email, with an option of receiving an editable PPT, according to the purchase option. |
Our Best Selling Reports
Artificial intelligence market
Latin America Explosives Market
Paper Cups Market Report Snapshots
Paper Cups Market Regional Analysis
*At Expert Market Research, we strive to always give you current and accurate information. The numbers depicted in the description are indicative and may differ from the actual numbers in the final EMR report.
1 Preface
2 Report Coverage – Key Segmentation and Scope
3 Report Description
3.1 Market Definition and Outlook
3.2 Properties and Applications
3.3 Market Analysis
3.4 Key Players
4 Key Assumptions
5 Executive Summary
5.1 Overview
5.2 Key Drivers
5.3 Key Developments
5.4 Competitive Structure
5.5 Key Industrial Trends
6 Market Snapshot
6.1 Global
6.2 Regional
7 Opportunities and Challenges in the Market
8 Global Paper Cups Market Analysis
8.1 Key Industry Highlights
8.2 Global Paper Cups Historical Market (2018-2023)
8.3 Global Paper Cups Market Forecast (2024-2032)
8.4 Global Paper Cups Market by Cup Type
8.4.1 Hot Paper Cups
8.4.1.1 Market Share
8.4.1.2 Historical Trend (2018-2023)
8.4.1.3 Forecast Trend (2024-2032)
8.4.2 Cold Paper Cups
8.4.2.1 Market Share
8.4.2.2 Historical Trend (2018-2023)
8.4.2.3 Forecast Trend (2024-2032)
8.5 Global Paper Cups Market by Wall Type
8.5.1 Single-Wall Paper Cups
8.5.1.1 Market Share
8.5.1.2 Historical Trend (2018-2023)
8.5.1.3 Forecast Trend (2024-2032)
8.5.2 Double-Wall Paper Cups
8.5.2.1 Market Share
8.5.2.2 Historical Trend (2018-2023)
8.5.2.3 Forecast Trend (2024-2032)
8.5.3 Triple-Wall Paper Cups
8.5.3.1 Market Share
8.5.3.2 Historical Trend (2018-2023)
8.5.3.3 Forecast Trend (2024-2032)
8.6 Global Paper Cups Market by End User
8.6.1 Quick Service Restaurants
8.6.1.1 Market Share
8.6.1.2 Historical Trend (2018-2023)
8.6.1.3 Forecast Trend (2024-2032)
8.6.2 Institutional
8.6.2.1 Market Share
8.6.2.2 Historical Trend (2018-2023)
8.6.2.3 Forecast Trend (2024-2032)
8.6.3 Household
8.6.3.1 Market Share
8.6.3.2 Historical Trend (2018-2023)
8.6.3.3 Forecast Trend (2024-2032)
8.6.4 Others
8.7 Global Paper Cups Market by Region
8.7.1 North America
8.7.1.1 Market Share
8.7.1.2 Historical Trend (2018-2023)
8.7.1.3 Forecast Trend (2024-2032)
8.7.2 Europe
8.7.2.1 Market Share
8.7.2.2 Historical Trend (2018-2023)
8.7.2.3 Forecast Trend (2024-2032)
8.7.3 Asia Pacific
8.7.3.1 Market Share
8.7.3.2 Historical Trend (2018-2023)
8.7.3.3 Forecast Trend (2024-2032)
8.7.4 Latin America
8.7.4.1 Market Share
8.7.4.2 Historical Trend (2018-2023)
8.7.4.3 Forecast Trend (2024-2032)
8.7.5 Middle East and Africa
8.7.5.1 Market Share
8.7.5.2 Historical Trend (2018-2023)
8.7.5.3 Forecast Trend (2024-2032)
9 North America Paper Cups Market Analysis
9.1 Market by Cup Type
9.2 Market by Wall Type
9.3 Market by End User
9.4 Market by Country
9.4.1 United States of America
9.4.1.1 Market Share
9.4.1.2 Historical Trend (2018-2023)
9.4.1.3 Forecast Trend (2024-2032)
9.4.2 Canada
9.4.2.1 Market Share
9.4.2.2 Historical Trend (2018-2023)
9.4.2.3 Forecast Trend (2024-2032)
10 Europe Paper Cups Market Analysis
10.1 Market by Cup Type
10.2 Market by Wall Type
10.3 Market by End User
10.4 Market by Country
10.4.1 United Kingdom
10.4.1.1 Market Share
10.4.1.2 Historical Trend (2018-2023)
10.4.1.3 Forecast Trend (2024-2032)
10.4.2 Germany
10.4.2.1 Market Share
10.4.2.2 Historical Trend (2018-2023)
10.4.2.3 Forecast Trend (2024-2032)
10.4.3 France
10.4.3.1 Market Share
10.4.3.2 Historical Trend (2018-2023)
10.4.3.3 Forecast Trend (2024-2032)
10.4.4 Italy
10.4.4.1 Market Share
10.4.4.2 Historical Trend (2018-2023)
10.4.4.3 Forecast Trend (2024-2032)
10.4.5 Others
11 Asia Pacific Paper Cups Market Analysis
11.1 Market by Cup Type
11.2 Market by Wall Type
11.3 Market by End User
11.4 Market by Country
11.4.1 China
11.4.1.1 Market Share
11.4.1.2 Historical Trend (2018-2023)
11.4.1.3 Forecast Trend (2024-2032)
11.4.2 Japan
11.4.2.1 Market Share
11.4.2.2 Historical Trend (2018-2023)
11.4.2.3 Forecast Trend (2024-2032)
11.4.3 India
11.4.3.1 Market Share
11.4.3.2 Historical Trend (2018-2023)
11.4.3.3 Forecast Trend (2024-2032)
11.4.4 ASEAN
11.4.4.1 Market Share
11.4.4.2 Historical Trend (2018-2023)
11.4.4.3 Forecast Trend (2024-2032)
11.4.5 South Korea
11.4.5.1 Market Share
11.4.5.2 Historical Trend (2018-2023)
11.4.5.3 Forecast Trend (2024-2032)
11.4.6 Australia
11.4.6.1 Market Share
11.4.6.2 Historical Trend (2018-2023)
11.4.6.3 Forecast Trend (2024-2032)
11.4.7 Others
12 Latin America Paper Cups Market Analysis
12.1 Market by Cup Type
12.2 Market by Wall Type
12.3 Market by End User
12.4 Market by Country
12.4.1 Brazil
12.4.1.1 Market Share
12.4.1.2 Historical Trend (2018-2023)
12.4.1.3 Forecast Trend (2024-2032)
12.4.2 Argentina
12.4.2.1 Market Share
12.4.2.2 Historical Trend (2018-2023)
12.4.2.3 Forecast Trend (2024-2032)
12.4.3 Mexico
12.4.3.1 Market Share
12.4.3.2 Historical Trend (2018-2023)
12.4.3.3 Forecast Trend (2024-2032)
12.4.4 Others
13 Middle East and Africa Paper Cups Market Analysis
13.1 Market by Cup Type
13.2 Market by Wall Type
13.3 Market by End User
13.4 Market by Country
13.4.1 Saudi Arabia
13.4.1.1 Market Share
13.4.1.2 Historical Trend (2018-2023)
13.4.1.3 Forecast Trend (2024-2032)
13.4.2 United Arab Emirates
13.4.2.1 Market Share
13.4.2.2 Historical Trend (2018-2023)
13.4.2.3 Forecast Trend (2024-2032)
13.4.3 Nigeria
13.4.3.1 Market Share
13.4.3.2 Historical Trend (2018-2023)
13.4.3.3 Forecast Trend (2024-2032)
13.4.4 South Africa
13.4.4.1 Market Share
13.4.4.2 Historical Trend (2018-2023)
13.4.4.3 Forecast Trend (2024-2032)
13.4.5 Others
14 Market Dynamics
14.1 SWOT Analysis
14.1.1 Strengths
14.1.2 Weaknesses
14.1.3 Opportunities
14.1.4 Threats
14.2 Porter’s Five Forces Analysis
14.2.1 Supplier’s Power
14.2.2 Buyer’s Power
14.2.3 Threat of New Entrants
14.2.4 Degree of Rivalry
14.2.5 Threat of Substitutes
14.3 Key Indicators for Demand
14.4 Key Indicators for Price
15 Value Chain Analysis
16 Cost Analysis
16.1 Land, Location and Site Development
16.2 Plant Machinery
16.3 Raw Material
16.4 Utilities
16.5 Manpower
16.6 Transportation
16.7 Packaging
16.8 Others
17 Manufacturing Process
18 Competitive Landscape
18.1 Market Structure
18.2 Company Profiles
18.2.1 Dart Container Corporation
18.2.1.1 Company Overview
18.2.1.2 Product Portfolio
18.2.1.3 Demographic Reach and Achievements
18.2.1.4 Certifications
18.2.2 F Bender Limited
18.2.2.1 Company Overview
18.2.2.2 Product Portfolio
18.2.2.3 Demographic Reach and Achievements
18.2.2.4 Certifications
18.2.3 Jiangsu Yinwang New Material Technology Co., Ltd
18.2.3.1 Company Overview
18.2.3.2 Product Portfolio
18.2.3.3 Demographic Reach and Achievements
18.2.3.4 Certifications
18.2.4 Huhtamäki Oyj
18.2.4.1 Company Overview
18.2.4.2 Product Portfolio
18.2.4.3 Demographic Reach and Achievements
18.2.4.4 Certifications
18.2.5 Georgia-Pacific Consumer Products LP
18.2.5.1 Company Overview
18.2.5.2 Product Portfolio
18.2.5.3 Demographic Reach and Achievements
18.2.5.4 Certifications
18.2.6 Pactiv LLC
18.2.6.1 Company Overview
18.2.6.2 Product Portfolio
18.2.6.3 Demographic Reach and Achievements
18.2.6.4 Certifications
18.2.7 Go-Pak Group
18.2.7.1 Company Overview
18.2.7.2 Product Portfolio
18.2.7.3 Demographic Reach and Achievements
18.2.7.4 Certifications
18.2.8 Konie Cups International, Inc.
18.2.8.1 Company Overview
18.2.8.2 Product Portfolio
18.2.8.3 Demographic Reach and Achievements
18.2.8.4 Certifications
18.2.9 Graphic Packaging International, LLC
18.2.9.1 Company Overview
18.2.9.2 Product Portfolio
18.2.9.3 Demographic Reach and Achievements
18.2.9.4 Certifications
18.2.10 Grupo Phoenix
18.2.10.1 Company Overview
18.2.10.2 Product Portfolio
18.2.10.3 Demographic Reach and Achievements
18.2.10.4 Certifications
18.2.11 Others
19 Key Trends and Developments in the Market
List of Key Figures and Tables
1. Global Paper Cups Market: Key Industry Highlights, 2018 and 2032
2. Global Paper Cups Historical Market: Breakup by Cup Type (USD Million), 2018-2023
3. Global Paper Cups Market Forecast: Breakup by Cup Type (USD Million), 2024-2032
4. Global Paper Cups Historical Market: Breakup by Wall Type (USD Million), 2018-2023
5. Global Paper Cups Market Forecast: Breakup by Wall Type (USD Million), 2024-2032
6. Global Paper Cups Historical Market: Breakup by Application (USD Million), 2018-2023
7. Global Paper Cups Market Forecast: Breakup by Application (USD Million), 2024-2032
8. Global Paper Cups Historical Market: Breakup by Region (USD Million), 2018-2023
9. Global Paper Cups Market Forecast: Breakup by Region (USD Million), 2024-2032
10. North America Paper Cups Historical Market: Breakup by Country (USD Million), 2018-2023
11. North America Paper Cups Market Forecast: Breakup by Country (USD Million), 2024-2032
12. Europe Paper Cups Historical Market: Breakup by Country (USD Million), 2018-2023
13. Europe Paper Cups Market Forecast: Breakup by Country (USD Million), 2024-2032
14. Asia Pacific Paper Cups Historical Market: Breakup by Country (USD Million), 2018-2023
15. Asia Pacific Paper Cups Market Forecast: Breakup by Country (USD Million), 2024-2032
16. Latin America Paper Cups Historical Market: Breakup by Country (USD Million), 2018-2023
17. Latin America Paper Cups Market Forecast: Breakup by Country (USD Million), 2024-2032
18. Middle East and Africa Paper Cups Historical Market: Breakup by Country (USD Million), 2018-2023
19. Middle East and Africa Paper Cups Market Forecast: Breakup by Country (USD Million), 2024-2032
20. Global Paper Cups Market Structure
Key Questions Answered in the Report
The global consumption of the product stood at USD 10.8 billion in 2023.
The consumption is projected to grow at a CAGR of nearly 3.5% in the forecast period of 2024-2032.
The consumption is estimated to reach a value of about USD 13.3 billion by 2032.
The major drivers of the market include the rising demand for disposable cups, growing fast food culture, and the increasing consumer concern about sanitation and hygiene.
Key trends aiding market expansion include the government policies incentivising the recycling of papers cups, rise in home delivery services, growing emphasis on eco-friendly packaging, and growing popularity of coffee shops and fast-food outlets.
Regions considered in the market are North America, Europe, the Asia Pacific, Latin America, and the Middle East and Africa.
The different types of paper cups in the market are hot and cold paper cups.
The wall types include single, double, and triple walled cups.
The dominant application sector of the product is tea and coffee.
Key players in the market are Dart Container Corporation, F Bender Limited, Jiangsu Yinwang New Material Technology Co., Ltd, Huhtamäki Oyj, Georgia-Pacific Consumer Products LP, Pactiv LLC, Go-Pak Group, Konie Cups International, Inc., Graphic Packaging International, LLC, and Grupo Phoenix, among others.
Purchase Options 10% off


Call us
Purchase Full Report
Mini Report
$ 2475
$1999
-
Selected Sections, One User
-
Printing Not Allowed
-
Email Delivery in PDF
-
Free Limited Customisation -
Post Sales Analyst Support -
50% Discount on Next Update
Single User License
$ 3849
$3499
-
All Sections, One User
-
One Print Allowed
-
Email Delivery in PDF
-
Free Limited Customisation -
Post Sales Analyst Support -
50% Discount on Next Update

Five User License
$ 4949
$4499
-
All Sections, Five Users
-
Five Prints Allowed
-
Email Delivery in PDF
-
Free Limited Customisation
-
Post Sales Analyst Support
-
50% Discount on Next Update
Corporate License
$ 6049
$5499
-
All Sections, Unlimited Users
-
Unlimited Prints Allowed
-
Email Delivery in PDF + Excel
-
Free Limited Customisation
-
Post Sales Analyst Support
-
50% Discount on Next Update
Any Question? Speak With An Analyst
View A Sample
Did You Miss Anything, Ask Now
Why Expert Market Research?
Right People
We are technically excellent, strategic, practical, experienced and efficient; our analysts are hand-picked based on having the right attributes to work successfully and execute projects based on your expectations.
Right Methodology
We leverage our cutting-edge technology, our access to trusted databases, and our knowledge of the current models used in the market to deliver you research solutions that are tailored to your needs and put you ahead of the curve.
Right Price
We deliver in-depth and superior quality research in prices that are reasonable, unmatchable, and shows our understanding of your resource structure. We, additionally, offer attractive discounts on our upcoming reports.
Right Support
Our team of expert analysts are at your beck and call to deliver you optimum results that are customised to meet your precise needs within the specified timeframe and help you form a better understanding of the industry.
NEWSLETTER