Water & Energy Institute, Sharif University of Technology, Tehran, Iran
Corresponding author Email: alavi@sharif.edu
Article Publishing History
Received: 12/01/2017
Accepted After Revision: 21/03/2017
The vegetation of the land, including ecological factors in the erosion and sediment in the watershed dams and rivers is. In this study, to determine the vegetation index within a specified period and on the part of the catchment area of the dam Latyan, as an important source of drinking water in Tehran, The change in comparison with the annual river discharge and rainfall were compared. Estimates of vegetation index NDVI in the basin during the years 2001 to 2013 show Roodak Station, between 2003 and 2005, the highest value and the lowest is 2008. The annual rainfall during those years show that the highest amount of rainfall was in 2003 and the lowest occurred in 2008. Curve shows, vegetation index largely follows changes in annual rainfall.
Vegetation Index, Ndvi, Remote Sensing, Latyan Dam, Tehran
Mirzai M, Alavi A. N, Sajadi A. Estimates of Vegetation and Changes in Rainfall and Runoff in the Catchment Area: A case study of Latian Watershed. Biosc.Biotech.Res.Comm. 2017;10(1).
Mirzai M, Alavi A. N, Sajadi A. Estimates of Vegetation and Changes in Rainfall and Runoff in the Catchment Area: A case study of Latian Watershed. Biosc.Biotech.Res.Comm. 2017;10(1). Available from: https://bit.ly/2XPMq9k
Introduction
Rivers, has long been needed and have paid attention. Therefore, human societies and industrial and agricultural centers, etc., to exploit water resources, usually near the rivers have been set up.
With the passage of time and development of centers of communities and an increase in abnormal manipulation of water sources and causes of climate change, changes in water quality conditions of the river. Measuring and analyzing qualitative data streams compared to the trend of influencing factors of quality, which makes it possible to adopt appropriate management practices to gradually reduce river pollution. The vegetation of the land, including ecological factors in the erosion and sedimentation in the upper watershed of the River dams. The study area in the study of Rivers watershed is in Roodak Station. The river forming Latian Reservoir, as an important source of water Tehran. Roodak station has a watershed of 403 square kilometers, the longitude and latitude and at an altitude of 1700 meters above sea level. Figure 1 shows the location of the area of the basin slope and shape 2.
 |
Figure 1: Watershed of Latian Dam and Roodak station |
 |
Figure 2: Classification slope, catchment area Jajrood River |
The average river water, 230 million cubic meters per year (Tehran Regional Water Company 2015). Latyan dam’s catchment area, has a special geographical location and climate. Studies have shown that this area because of the proximity to Tehran, have led to remarkable changes in population and development of residential complexes (Mirzaei et al. 2004). Studies have also shown that due to the high basin slope, soil type and lack of vegetation, erosion rate is high, (Mirzaei et al. 2010). The results of erosion modelling in the region show that if land use changes and increased vegetation in this area, reduced erosion rates, and sediments carried by the river are also reduced, with water quality index being in the middle range (Mirzaei et al. 2014).
Quantitative modeling of water erosion in the watershed Latian (Maleki et al. 2011 ) and Modeling erosion in the catchment areas in the region Amameh (Pour Abdullah et al. 2012), Among the various studies conducted in the region in this regard. As well as examining the changes in watershed land users Karkhe the quality of the river (Salajegheh et al. 2012). Of remote sensing in various studies such as environmental studies climate and vegetation changes, is used. Analysis of urban ecology plant (using – NDVI derived from satellite imagery) Case Study: Metropolis Ahvaz (Moradi 2016) and The efficiency of NDVI data to estimate the vegetation(Farahnak et al. 2015)and have reviewed changes to green space in Shiraz using GIS & RS. During the years 1977-2015, Jamali (2015) has studied using satellite images to determine the vegetation index.
Study autumn NDVI contributes more and more to vegetation improvement in the growing season across the Tibetan Plateau (Du et al. 2017) and vegetation response to intensive commercial horticulture and environmental changes within watersheds in central highlands, Kenya, using NDVI data (Muriithi et al. 2016) and seasonal vegetation response to climate change in the Northern Hemisphere (1982–2013) (Kong et al. 2017). Determination and monitoring rangeland condition classes with MODIS NDVI and EVI indices in Iranian arid and semi-arid lands (Jafari et al. 2017) and correlation analysis between vegetation coverage and climate drought conditions in North China during 2001–2013 (Gong et al. 2017). Consistency of vegetation index seasonality across the Amazon rainforest (Maeda et al. 2016) and vegetation response to rainfall seasonality and inter annual variability in tropical dry forests (Souza et al. 2016) and assessment of regional vegetation response to climate anomalies: For Australia using GIMMS NDVI time series between 1982 and 2006 .
Recently, De Keersmaecker et al. (2017) have studied this field. For impact assessment of watershed management programmes on land use/land cover dynamics using remote sensing and GIS (Thakkar et al. 2017)and vegetation greenness modelling in response to inter annual precipitation and temperature changes have been analyzed between 2001 and 2012 in Liao River Basin in Jilin Province, China by Lin et al. (2016) where this method has been used. The present study was carried out to determine the vegetation index in the area within a specified period, the change in comparison with the annual river discharge and rainfall have been investigated. In this study, we estimate the vegetation using remote sensing (satellite imagery) and its existing data.
Materials and Methods
In this study, to estimate vegetation, NDVI (Normalized Difference Vegetation Index) values in late August and early September, according to Smith et al studies (Smith 2000)have been used. Index NDVI (Normalized Difference Vegetation Index) or normalized difference vegetation index ratios between the bands 1 and 2 are calculated. NDVI maps on vegetation density that limit the use of bands of red (R) and near infrared range (NIR) is extracted. The NDVI prepared using the TERRA satellite images, the following equation was used. (1-2)
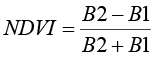
In which the near-infrared range B2 and B1 band is the red band. The index showed a good correlation with leaf density, but on three factors height and angle of the sun, earth and atmospheric effects is critical. The amount of reflection at different wavelengths depending on the type of vegetation cover (species, tissue, plant health, etc.) and the type of surface soil (organic matter, moist soil, texture, etc.) can be adjusted. During these studies, how changes in vegetation cover in the basin during the years 2001 to 2013 using the MODIS sensor images with a pixel size of 250 m was investigated. Time series and combinations (Composite) NDVI data types have many applications. Including their types can be combined in a 10-day, 16-day and monthly NDVI index mentioned. Combined time series analysis of the different indicators over time was associated with greater ease and does not lead to problems such as cloudiness (Iranian Space Agency 2015). The 16-day composite of MODIS images were used. The images Ascii format available for years at Exel extracted and examined.
Quantitative Data
Roodak Station, is gauging stations of Rivers. In this study, the mean values measured flow rate in this station by Tehran Regional Water Company and the amount of annual precipitation were recorded in it.
Results
Figure 3 shows the changes covered in this period. The results show that, Index NDVI in 2003 and 2005 had the highest value and the lowest is 2008. Figure 4 shows the changes in annual precipitation during these years. The greatest amount of precipitation in 2003 and the lowest occurred in 2008
By comparing Figures 3 and 4 can be seen, a lot of vegetation index follows changes in annual rainfall.
 |
Figure 3: 3. NDVI values during the years 2001-2013 |
 |
Figure 4: The height of the annual rainfall during the 2001 to 2013 |
Figure 5 shows the average annual flow changes to a height of rainfall and the sixth annual average flow rate during the same year in Roodak stations show that is almost linear.
 |
Figure 5: Average Annual discharge – annual Rainfall at the station Roodak |
 |
Figure 6: Average annual discharge of Rivers |
Conclusion
Since NDVI values calculated for the month of August and September, it can be concluded that the area under cultivation and summer planting vegetation obtained is more representative the results show that annual precipitation has increased in the high water and river flow increases, the amount of vegetation cover index also increased. Considering the results of erosion in the catchment can be concluded that Drought and low water, the causes of erosion and sediment and nutrients are in the river. Relatively high slope moss has increased catchment erosion potential.
References
- De Keersmaecker, W., Lhermitte, S., Hill, M.J, Coppin, P., Somers, B. (2017). Assessment of regional vegetation response to climate anomalies: A case study for Australia using GIMMS NDVI time series between 1982 and 2006 Journal of Remote Sensing, 9(1),pp. 34
- Du, J., He, P., Fang, S., Yuan, X., Yin, J. (2017). mn NDVI contributes more and more to vegetation improvement in the growing season across the Tibetan Plateau, International Journal of Digital Earth, pp.1-20
- Farahnak, M., Najibzade, M. (2015). The efficiency of NDVI data to estimate the vegetation, The second Global Conference on Sustainable Agriculture and Natural Resources
- Gong, Z., Zhao, S., Gu, J. ( 2017). Correlation analysis between vegetation coverage and climate drought conditions in North China during 2001–2013, Journal of Geographical Sciences., Vol 27, pp. 143-160
- Jafari, R., Bashari , H., Tarkesh, M. (2017). Discriminating and monitoring rangeland condition classes with MODIS NDVI and EVI indices in Iranian arid and semi-arid lands, Journal of Arid Land Research and Management.,31(1), pp .94-110
- Jamali, M. (2015).Review changes to green space in Shiraz using GIS & RS During the years 1393-1355, The first national conference on urban planning, urban management and sustainable developmentAutu
- Kong, D., Zhang, Q., Singh, V.P., Shi, P. (2017). Seasonal vegetation response to climate change in the Northern Hemisphere (1982–2013), Journal of Global and Planetary Change.,Vol 148,pp .1-8
- Lin, X.-S., Tang, J., Li, Z.-Y., Li, H.-Y. (2016). Vegetation greenness modelling in response to interannual precipitation and temperature changes between 2001 and 2012 in Liao River Basin in Jilin Province, China ,Springer Plus. 5(1), pp.1173
- Maeda, E.E., Moura, Y.M., Wagner, F. Aragão, L.E.O.C., Shimabukuro, Y. (2016).Consistency of vegetation index seasonality across the Amazon rain forest , International Journal of Applied Earth Observation and Geoinformation 52, pp. 42-53
- Maleki , M., Ahmadi, H., Jafari , M., Ghodousi , J. (2011).Quantitative modeling of water erosion using Analytic hierarchy process in the watershed Latian, National Conference erosion and sediment
- Mirzaei ,M. ,Nazari ,A.A. (2004).The effects of demographic changes on the quality of water resources – the catchment area of the dam Latyan, Journal of Water and Waste water.,Vol 49,pp.21-25
- Mirzaei, M., Sajadi.A., Nazari, A. A. (2010). GIS-based erosion modeling in the Latian Dam watershed using RUSLE, international Conference on Environmental Systems –Toronto,July 28-30.
- Mirzaei, M., Sajadi.A., Nazari, A. A.(2014 ). Modeling and simulation of watershed erosion (case study latian dam watershed, International Journal of Physical Sciences.,9 (9), pp. 224-232
- Mirzaei, M. (2014). Application of the Water Quality Index as Simple Indicator of Watershed Pollution Journal Advances in Water Resource and Protection Vol 2, pp. 42-46
- Moradi,Y. (2016).Analysis of urban ecology plant (using – NDVI derived from satellite imagery) Case Study: Metropolis Ahvaz,The second international conference on new research in civil engineering., , International Congress of architecture and urban management
- Muriithi, F.K., Yu, D., Robila, S. (2016). Vegetation response to intensive commercial horticulture and environmental changes within watersheds in central highlands, Kenya, using AVHRR NDVI data, International Journal of GI Science and Remote Sensing.,53(1),pp.1-21
- Pour Abdullah,M., Tajrishi, M.( 2012). Modeling of erosion with the help of swat and rusle models- Case Study amame watershed, International Congress of Civil Engineering University of Tehran
- Remote Sensing Applications (2015): Society and Environment 5, pp. 1-15
- Salajegheh , A., Razavizade, Samane ( 2012 ) . Changes in land use and its impact on river water quality -Case Study Kharkheh watershed, Journal of Ecology., vol 58, pp. 81-86
- Smith, J. ( 2016 ). Hydrologic Trends in the Middle East: Modeling and Remote Sensing, Yale University, pp 21.Iranian Space Agency 23 – http://www.isa.ir,(2016 )
- Souza, R., Feng, X., Antonino, A.Souza, E., Porporato, A. (2016). Vegetation response to rainfall seasonality and interannual variability in tropical dry forests, Journal of Hydrological Processes., 30(20), pp. 3583-3595
- Tehran Regional Water Company. (2016). Surface water flow report.
- Thakkar, A.K., Desai, V.R., Patel, A., Potdar, M.B. (2017). Impact assessment of watershed management programmes on land use/land cover dynamics using remote sensing and GIS

