


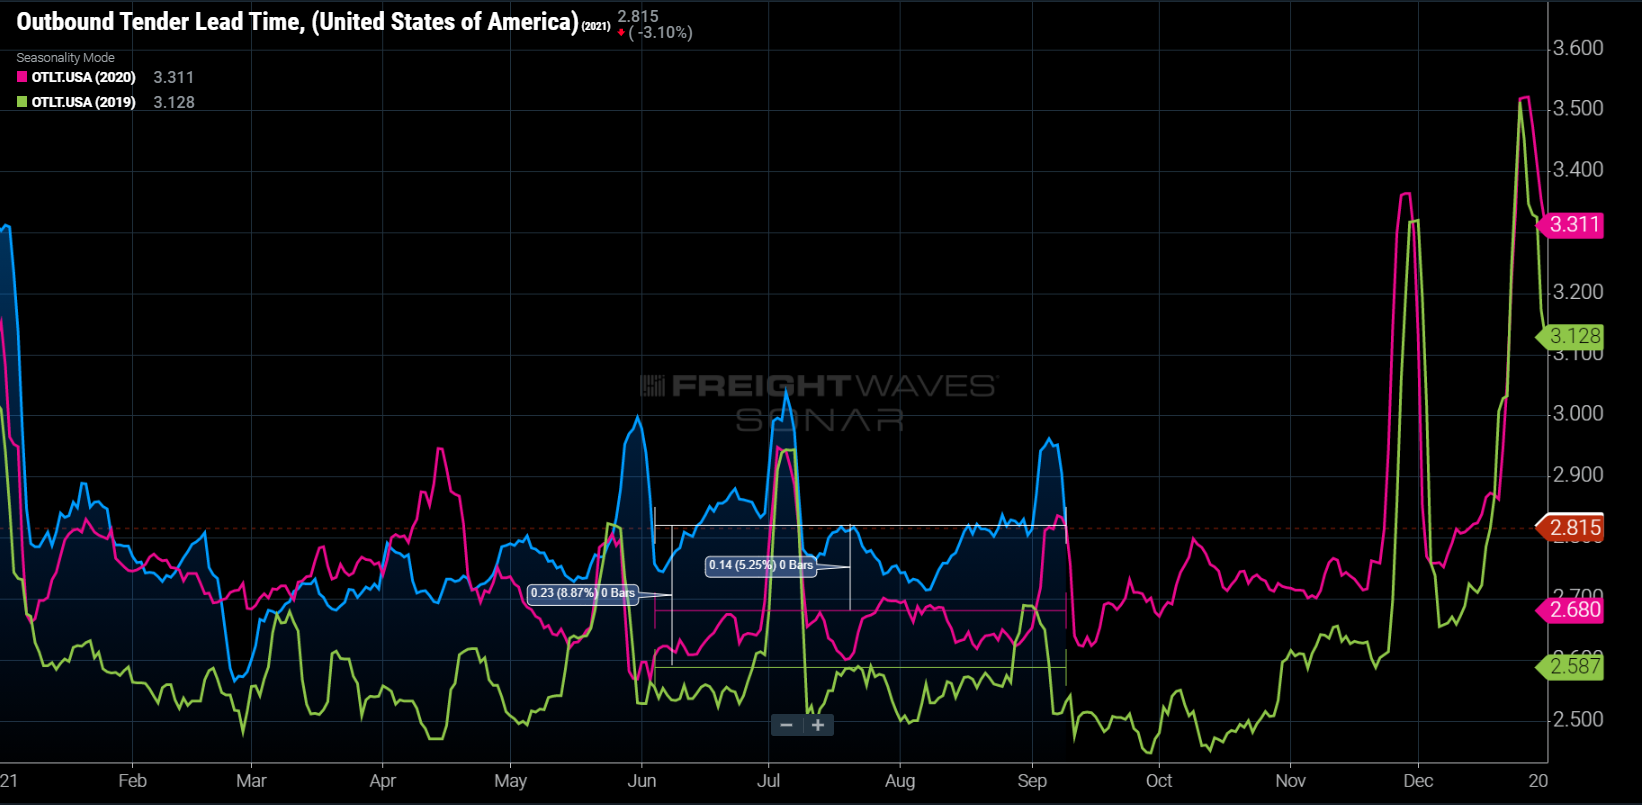
Chart of the Week: Outbound Tender Lead Time – USA SONAR: OTLT.USA
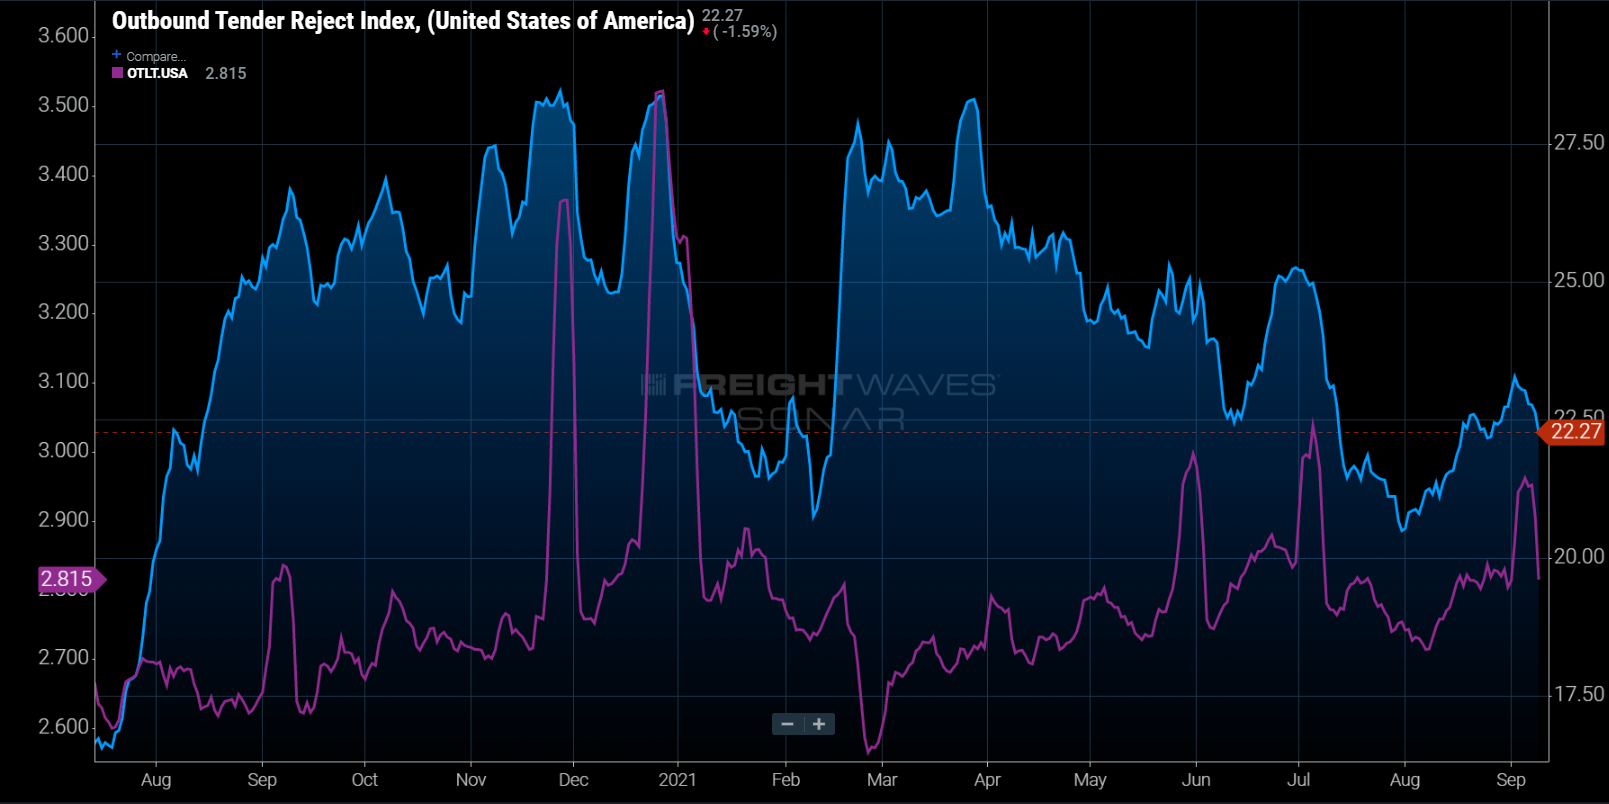
Shipper lead times (the time between request date and pickup date) have increased 5.25% versus last summer as tender rejection rates (the rate at which carriers reject load requests) have averaged 5 percentage points higher — 22% versus 17%. This is counterintuitive, but the real question is what would the rejection rate be if lead times remained the same?
Tender lead time (OTLT) is the time between a shipper’s request for a truck to pick up freight and the requested date of the pickup. So an order sent on Monday for a pickup on Thursday has a three-day lead time.
The average lead time from June through Labor Day weekend this year was 2.82 days compared to 2.68 in 2020. This may not seem like much, but when you are talking about tens of thousands of loads on a daily basis, it adds up to a lot of extra planning time.
Longer lead times should make it easier for a carrier to plan for a truck to be in the area to an extent. Sending an order for a truck multiple weeks in advance is not necessarily much more effective than a four- or five-day lead time due to the amount of unknown activity that can disrupt long-range planning — primarily other load requests but also delays at pickup or delivery, traffic and weather.
Capacity has been historically tight over the past 12 months as carriers have rejected over one in every five loads. Simply put, there is more demand for trucking capacity than supply — by a long way. To put it in perspective, a market where there is more supply than demand (2019) has a tender rejection rate around 5-6%. Tender lead times averaged right around 2.5 days during this time.
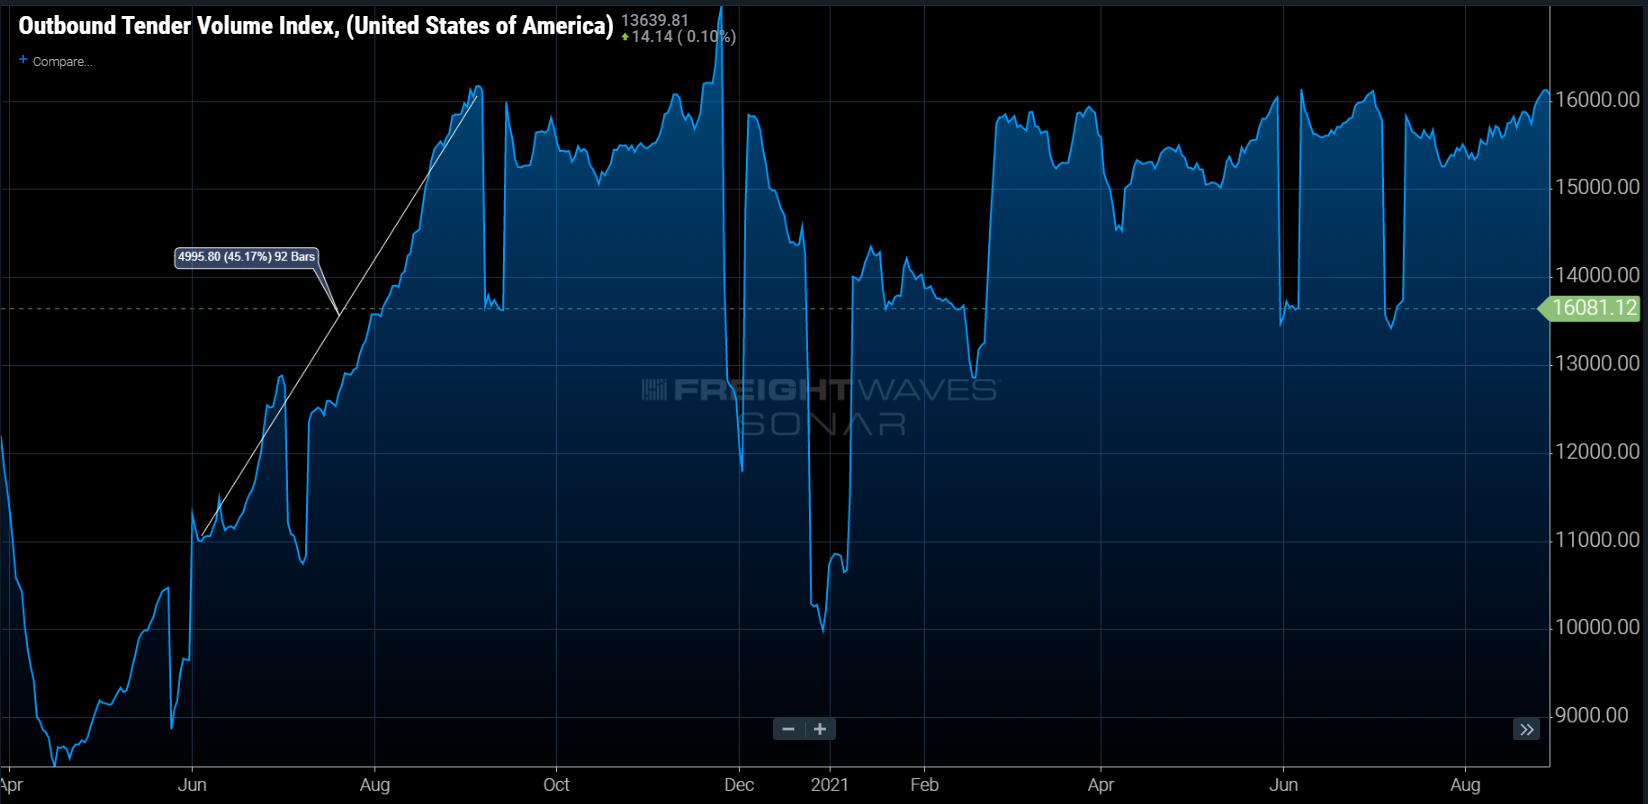
The problem with comparing lead times year-over-year in this instance is that the market was rapidly changing over the summer in 2020. Freight demand grew at its fastest pace in history over the course of the summer months. The Outbound Tender Volume Index (OTVI), which measures the amount of shipper requests, increased 45% from June 1 to Labor Day last year. Lead times increased marginally during this period (0.2%).
Lead times typically increase after capacity tightens as a reactive measure by shippers. Once capacity has been tight for a decent amount of time, shippers begin to change their behavior. In this case, it took roughly three months before there was a measurable change.
There are of course a multitude of other factors at play here in regard to how much of a factor lead times are in securing capacity such as spot and contract rates. Spot rates increased 46% during the summer of 2020, according to the Truckstop.com top 100 van lanes, rendering many contract rates inert. The spread between the two became too great for carriers to ignore.
To really see the impact of lead times, you need to compare two markets with similar conditions and change the lead times in front of any changes in capacity. Unfortunately, the aggregate values only change in reaction to the market — increasing after tightening and declining after loosening. There has not been one year easily compared to the other over the past five years, making it nearly impossible to determine the true impact at a high level.
The proof, however, may be in the pudding in the way you can assume the shippers would not consistently use this method of securing capacity after periods of tightening, meaning at a more granular level they can see measurable changes in carrier compliance without as much noise. At this point, it is in shippers’ best interest to do all they can to increase their odds of success in moving their freight.
About the Chart of the Week
The FreightWaves Chart of the Week is a chart selection from SONAR that provides an interesting data point to describe the state of the freight markets. A chart is chosen from thousands of potential charts on SONAR to help participants visualize the freight market in real time. Each week a Market Expert will post a chart, along with commentary, live on the front page. After that, the Chart of the Week will be archived on FreightWaves.com for future reference.
SONAR aggregates data from hundreds of sources, presenting the data in charts and maps and providing commentary on what freight market experts want to know about the industry in real time.
The FreightWaves data science and product teams are releasing new data sets each week and enhancing the client experience.
To request a SONAR demo, click here.

Walter Smith
Over the last year, I have increased the lead times for my tender only partially as a way to decrease the chance of rejection. Mostly, I have increase my lead times as a way to countermeasure the increased cost of shipping unplanned loads. Expedite costs are much higher. Scheduling loads 48-72 hours in advance seems to help a little.