


What’s inside:
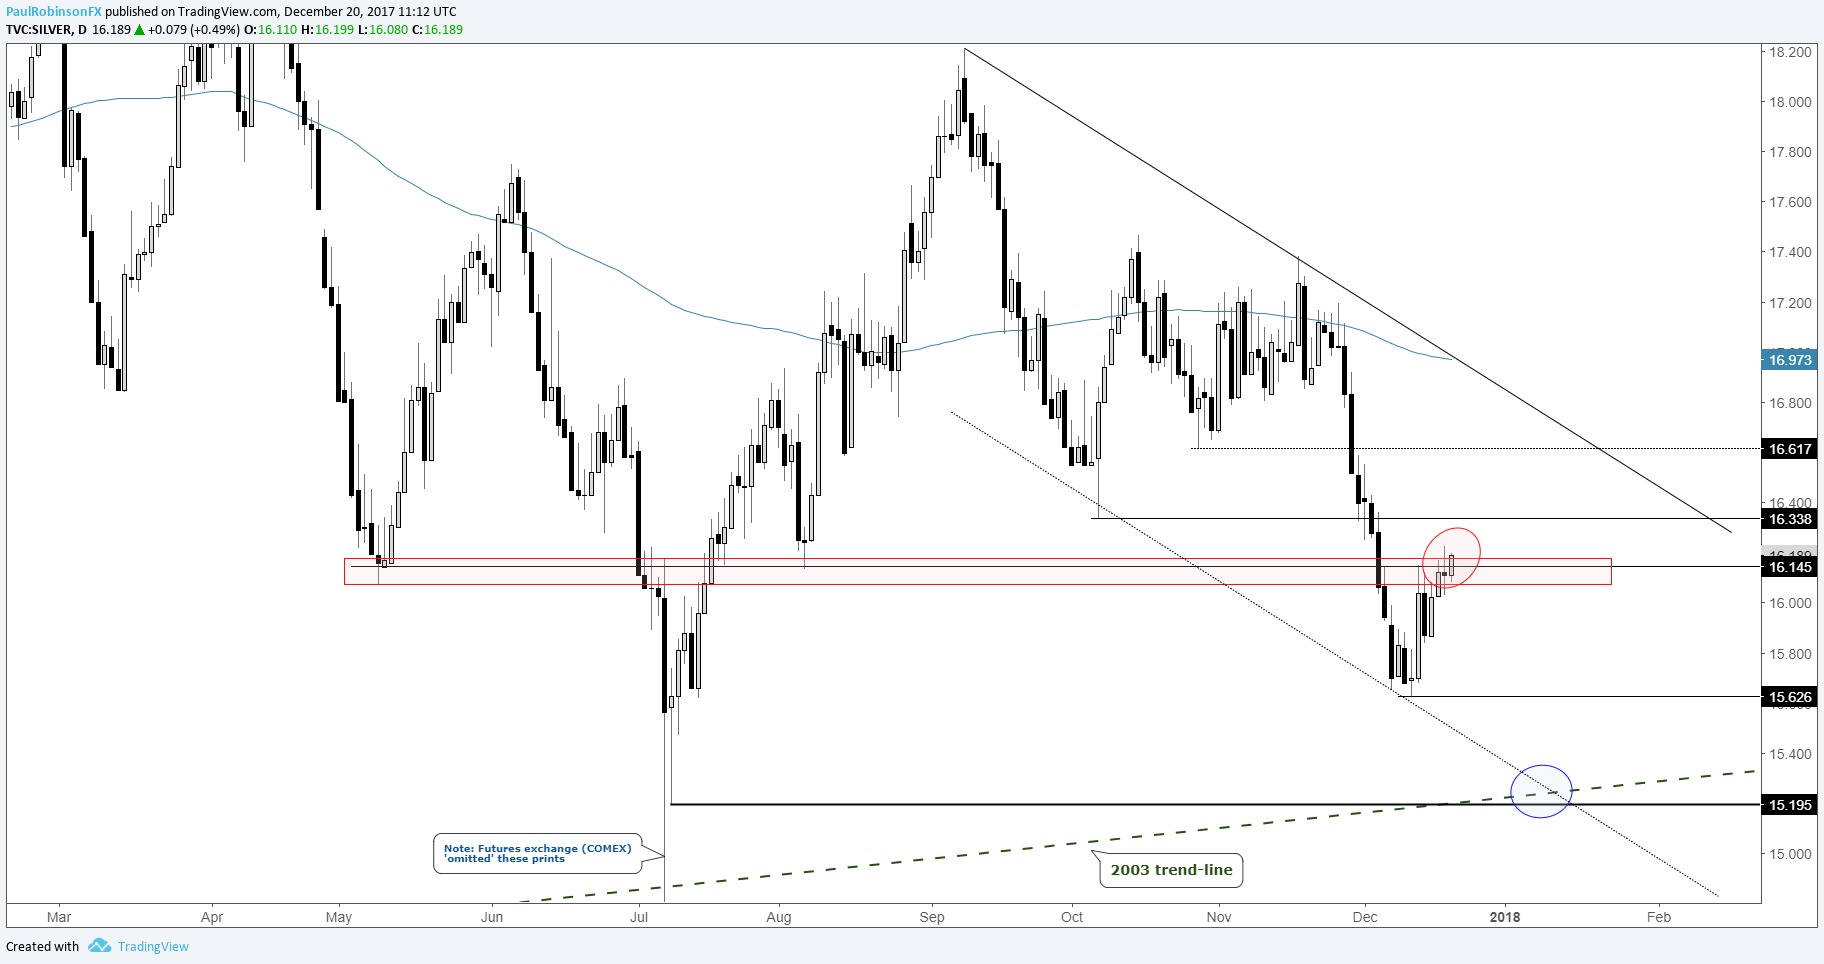
- Silver bouncing into resistance around the 16.15 line
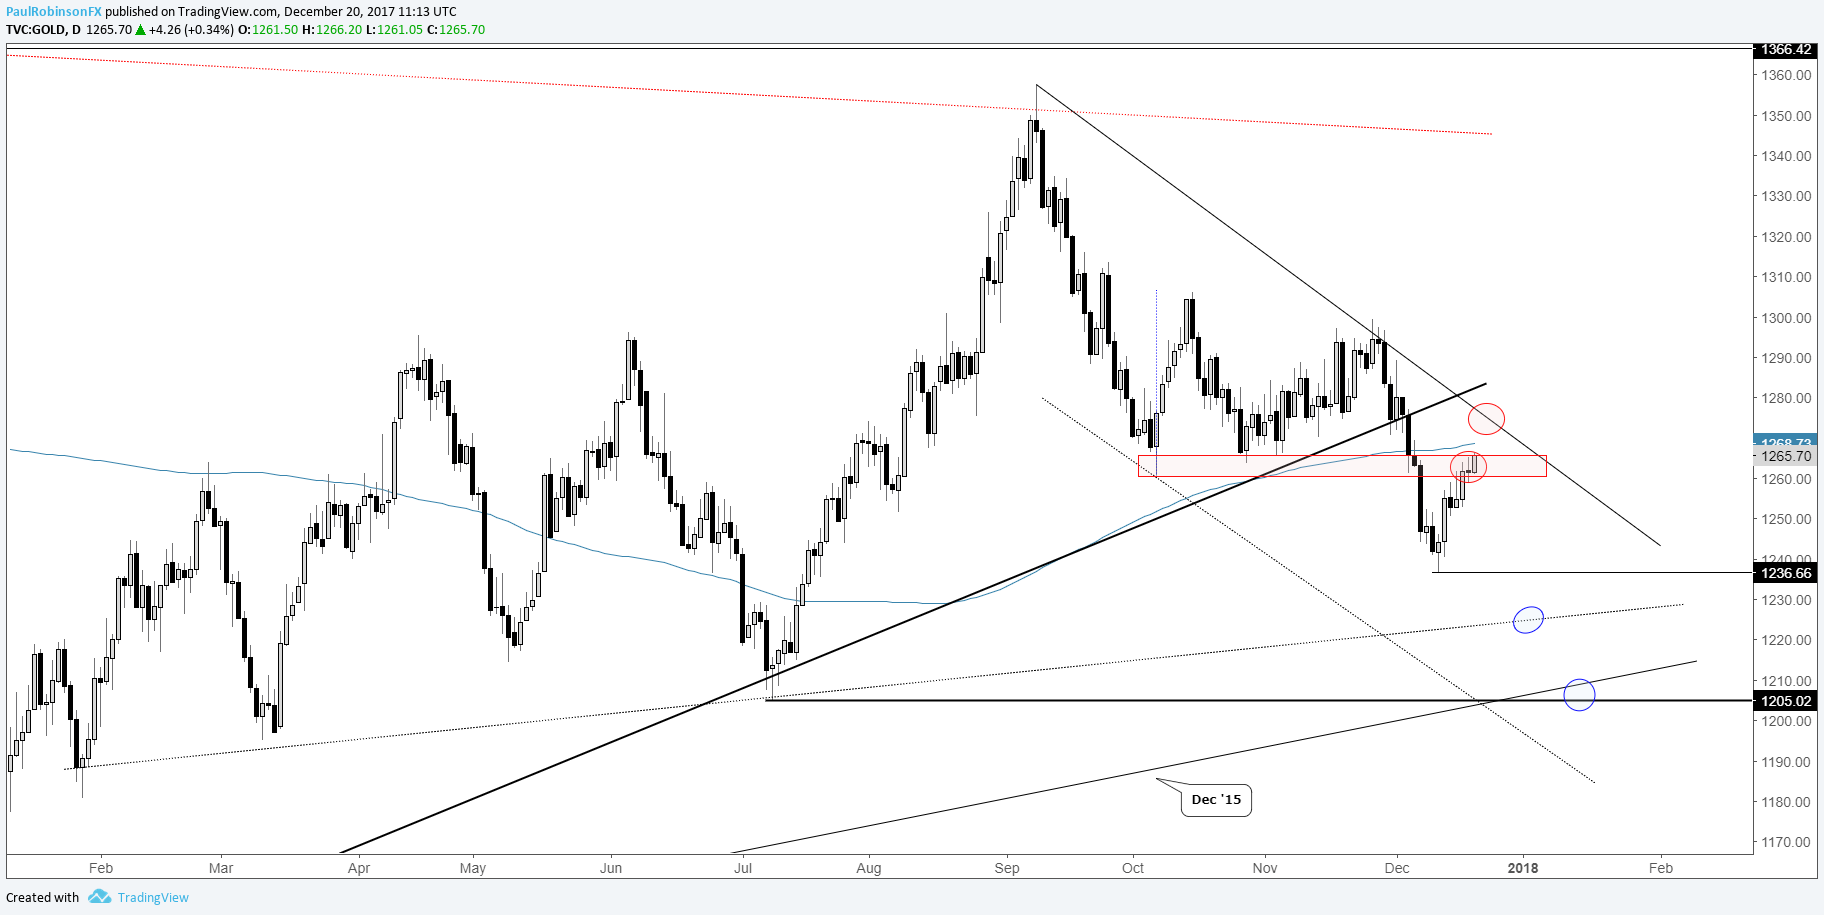
- Gold is facing off with levels in the 1260s and a little higher
- Still giving downtrend and resistance levels the benefit of the doubt
See how traders are positioned in key markets/currency pairs and what it could mean, please visit the IG Client Sentiment page.
Silver is currently lifting into an area of resistance around 16.15 consisting of a pair of lows in May and October. Yesterday, we saw a small turn lower on an attempt to trade on through, but it wasn’t the most convincing rejection. A little more substance to a turnaround is needed to heighten conviction that silver wants to trade lower again. Should we see the bounce extend higher, 16.34 up to 16.62 will be eyed as the next levels of resistance. A turn lower will bring the low at 15.62 back into view along with the lower parallel from which the current bounce is mounting from, and most importantly the 2003 trend-line and July spike-low. This would be the ideal spot for silver to trade to for a big-picture rally to develop later-on. But for now, the swing higher is only viewed as a corrective bounce as long as the trend structure remains bearish and resistance levels remain intact.
Silver: Daily
Gold experienced a sell-off to a lesser extent as silver, so it’s no surprise that it is recovering with a bit more strength. It is currently trading into the bottom of the congestion period it broke free from earlier this month. The 200-day also lies not far ahead along with the trend-line off the September high. From current levels up into the low 1270s is a very important area. A rejection will bring the recent low at 1236 back into focus, and from there the January and December 2015 trend-lines.
See this guide with 4 ideas on how to Build Confidence in Trading
Gold: Daily
---Written by Paul Robinson, Market Analyst
To receive Paul’s analysis directly via email – SIGN UP HERE
You can follow Paul on Twitter at @PaulRobinsonFX


