Paul Dorian

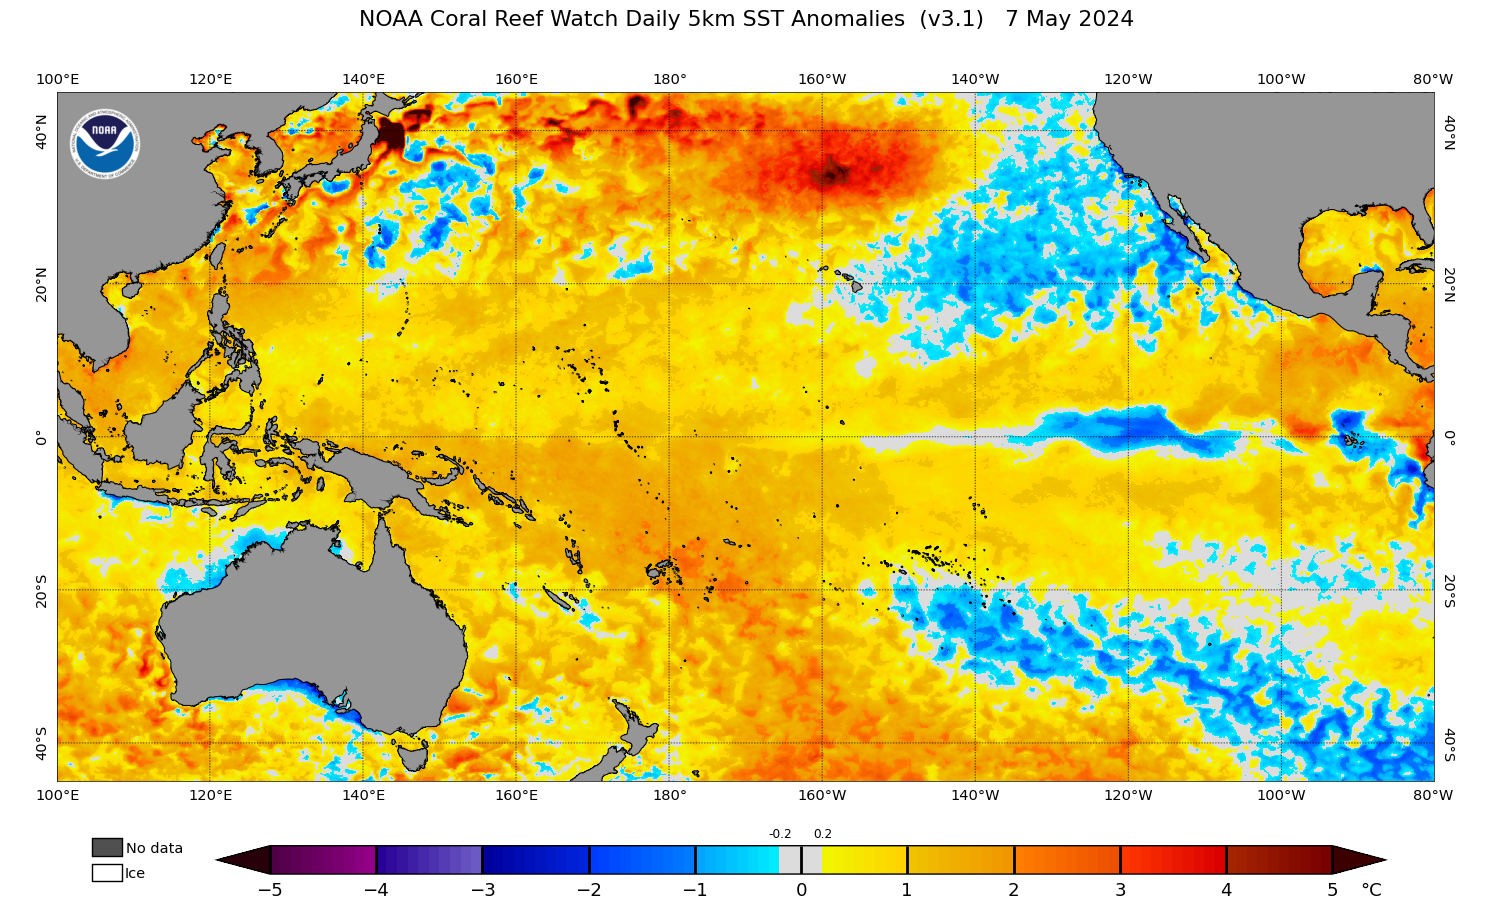
Sea surface temperatures continue to run at colder-than-normal levels (shown in blue) in the equatorial part of the Pacific Ocean and La Nina is likely to last into at least the beginning part of the upcoming summer season. Map courtesy NOAA, tropicaltidbits.com
La Nina conditions continue across the equatorial Pacific…likely to last into at least early summer with a potential impact on tropical activity…seeing an impact on global temperatures
Overview
La Nina conditions have dominated the scene in the equatorial part of the Pacific Ocean for this winter season as it did for the prior winter season of 2020-2021. Numerous computer models suggest that these colder-than-normal sea surface temperatures in the tropical Pacific will last into at least the beginning part of the upcoming summer season. If so, La Nina may indeed have an impact on global tropical activity this summer as it did during the last tropical season in 2021. In addition to its impact on tropical activity in the Atlantic and Pacific Oceans, these back-to-back La Nina episodes have seemingly affected global temperatures during the past many months which have dropped to nearly normal levels in the latest monthly reading.

This plot shows forecasts made by dynamical and statistical models for sea surface temperature (SST) anomalies in the “Nino 3.4” region (central Pacific) for nine overlapping 3-month periods. Many of the models suggest that the current La Nina episode will continue into at least the start of the upcoming summer season. Data source: IRI/CPC
Background
The Pacific Ocean is the largest on the planet, covers more than 30 percent of the Earth’s surface, and is bigger than the landmass of all the continents combined. The warm waters of the equatorial Pacific Ocean store a great amount of latent heat when compared to cooler waters and breed a great deal of convection which impacts downstream ridging and troughing in the atmosphere. As such, its sea surface temperature (SST) pattern has a tremendous influence on all weather and climate around the world and the more anomalous the sea surface temperatures, the more the impact can be on the atmosphere around the world. The El Nino-Southern Oscillation (ENSO) is a recurring climate pattern involving changes in the temperature of waters in the central and eastern tropical Pacific Ocean. El Nino and La Nina are the extreme phases of the ENSO cycle; between these two phases is a third phase called ENSO-neutral.
Weak-to-Moderate La Nina continues in the equatorial Pacific
During the winter season on 2020-2021, La Nina conditions (i.e., colder-than-normal water) persisted in the equatorial part of the Pacific Ocean and they then weakened to a nearly neutral state during the spring and summer of last year. New cooling then formed in the same part of the Pacific Ocean last fall and La Nina conditions strengthened in time for the still-ongoing winter season of 2021-2022. It is actually not all that unusual to have two La Nina events follow each other with eight of the twelve “first-year” La Nina events since 1950 followed by a second year episode during the subsequent winter season.

The accumulated cyclone energy (ACE) is the best measure of overall tropical activity and it was below-normal for the 2021 season across the entire Northern Hemisphere (boxed in value at lower right where 430.5 is actual and 543.7 is normal). While the Atlantic Basin experienced above-normal ACE, the Pacific Ocean more than offset this with far less activity compared to normal; especially, when considering the number of “major” hurricanes. Data courtesy Colorado State University, NOAA
La Nina’s impact on global tropical activity
What goes on in the tropical Pacific Ocean with respect to ENSO does indeed have an effect on tropical activity in the Atlantic Basin. El Nino, which refers to warmer-than-normal waters in the equatorial Pacific Ocean, tends to be an inhibiting factor for tropical storm formation/intensification in the Atlantic Basin. First, El Nino tends to produce faster-than-usual high-altitude winds over the tropical Atlantic Ocean and this increase in wind shear (change of wind speed with height) is hostile to the development or maintenance of tropical storms. Second, El Nino tends to result in sinking motion over parts of the Atlantic Basin which also is hostile to tropical storm formation/intensification.

The El-Nino Southern Oscillation (ENSO) regions of the equatorial Pacific Ocean are often broken up into smaller sub-sections as labeled on this map (courtesy NOAA).
On the other hand, La Nina, which refers to colder-than-normal waters in the equatorial part of the Pacific Ocean, is usually correlated with weaker wind shear over the breeding grounds of the tropical Atlantic Ocean. This typically leads to a more favorable environment in the tropical Atlantic for the development/intensification of tropical activity. Indeed, with La Nina in full force last summer, the Atlantic Basin tropical season was the third-most active on record in terms of the number of named storms with 21.
While La Nina conditions were a favorable factor for tropical activity in the Atlantic Basin in 2021, it tended to suppress activity in the equatorial part of the Pacific Ocean. In both regions of the Pacific Ocean (i.e., to the east and to the west of the “international date line”), overall tropical activity was below-normal in 2021 in terms of accumulated cyclone energy (ACE). The ACE metric – which was originally created by Dr. William Gray and associates at Colorado State University and later tweaked by NOAA – not only factors in the intensity of a tropical cyclone, it also takes into account its longevity. A “major” hurricane, for example, that lasts for a long time will have a much bigger impact on the accumulated cyclone energy than a short-lived and weaker tropical system. The number of “major” hurricanes in the Pacific Ocean during the 2021 tropical season was well below the normal amount.

In general, an El Nino episode in the tropical Pacific Ocean tends to cause a spike in global temperatures and there is often a noticeable drop off during and after La Nina events as has occurred during the past several months. The latest monthly reading for January 2022 of UAH global temperature anomalies is +0.03 degrees (C) using the base period of 1991-2020 for comparison. Data source: Dr. Roy Spencer, University of Alabama at Huntsville (UAH)
La Nina’s impact on global temperatures
In addition to an impact on tropical activity, La Nina can indeed have ramifications on global temperatures that are largely driven by oceanic and solar cycles. In recent decades, the number of El Nino episodes has surpassed the number of La Nina events and global temperatures have often reacted with noticeable spikes. For example, temperatures spiked in 2016/2017 following a strong El Nino event and they had a secondary peak in 2019 associated with a second El Nino episode in the tropical Pacific. Prior to that, strong El Nino events that centered on the years of 1997/1998 and 2009/2010 were associated with sharp upticks in lower atmosphere global temperatures.

Warm (red) and cold (blue) periods are listed in this table back to 2010 and are based on a threshold of +/- 0.5°C for the Oceanic Niño Index (ONI) [3 month running mean of ERSST.v5 SST anomalies in the Niño 3.4 region (5°N-5°S, 120°-170°W)], based on centered 30-year base periods updated every 5 years. La Nina conditions developed late in the spring of 2020 and has continued into the winter season of 2021-2022 although it weakened at times. Data source: NOAA/CPC
In times of La Nina such as during 2007/2008 and 2010/2011/2012, there have been noticeable downturns in global temperatures of the lower atmosphere. Since the most recent El Nino incident of 2018/2019, La Nina has been in control and global temperatures have responded accordingly. In fact, there has been quite a noticeable drop in global temperatures over the past several months to the point that levels are nearly normal on a worldwide basis as of the latest reading of UAH data in January of 2022. If La Nina does indeed continue for several more months as depicted by some computer models, global temperatures could respond by holding at these nearly normal quantities or perhaps even by falling to below-normal levels.
Meteorologist Paul Dorian
Arcfield
arcfieldweather.com
Follow us on Facebook, Twitter, YouTube
The longer La Nina prevails the bigger El Nino will be when it returns, so expect lots of global warming hysteria at that point.
And for anyone who wants to argue with Pablo about how La Nina events help to provide the warm water that fuel El Nino events, see my free ebook titled Who Turned on the Heat?:
v2-tisdale-who-turned-on-the-heat-free-edition.pdf (wordpress.com)
Regards,
Bob
“Keep in mind, though, infrared radiation only penetrates the top few millimeters of the ocean surface. That’s many orders of magnitude less than how far sunlight penetrates the oceans.
Volcanic aerosols reduce the amount of sunlight reaching the ocean surface. Sunlight is downward shortwave radiation, and the anthropogenic global warming hypothesis is not based on it. Downward shortwave radiation penetrates the oceans to depths of about 100 meters. That’s one hundred meters for sunlight versus a few millimeters for infrared radiation caused by greenhouse gases.”
Bob, thank you for that. It made the read worth it in a very short time. I will continue to read the rest of the book. Your visuals are enormously helpful.
Greenhouse gasses don’t cause infrared radiation. They absorb and then emit them.
wow, 558 pages- just curious but what is your expertise in the subject? – and I don’t mean to imply I have any doubts- just wondering how one gets to know so much about a topic like this
Do a search on this site for Bob Tisdale’, almost 2300 entries over the past twelve or more years
The same way Issac Newton did. Sit under an apple tree and keep your eyes open.
Then stand on the shoulders of giants.
Hard work.
Bob, I find it curious that we consider the plant to be cooling during a La Niña when in fact the ocean/atmosphere system is warming—lots of heat is being pushed deep into the Pacific warm pool—and warming during a El Niño event, when in fact the plant is cooling because heat that was stored in the Pacific warm pool is being vented to the atmosphere, and then to space via LW radiation.
To me this is one reason why it is absurd to monitor air temperature and to expect to see the fingerprint of warming caused an enhanced greenhouse effect due to human CO2 emissions. The atmosphere gets cool when the overall systems is gaining heat, and hotter when the system is losing heat.
Another reason why monitoring air temperature is absurd is that temperature isn’t even a measure of the heat content of atmospheric air. Air heat content is measured in units of BTUs per pound of dry air and associated moisture. It is the air temperature (called sensible heat) plus the energy that was consumed to evaporate any water vapor that is present (called latent heat). The latent heat will be converted back to sensible heat when the parcel of air is cooled, and the water condenses back to liquid form.
The heat content of air in a desert area with 110 °F (43 °C) dry air can be the same as a tropical climate with 85 °F (29 °C) humid air. So temperature alone tells us nothing about total heat content, and the global average temperature has no meaning. The global atmosphere could be getting warmer, but drier, or cooler, but moister, but the heat content could be the same.
” The longer La Nina prevails the bigger El Nino will be when it returns… ”
When I look at
or at
I can’t fully agree.
Wait and see.
I agree with Bindidon that “wait and see” is the correct outlook for actual scientists.
There was NOT a La Nina after the monster 2016 El Nino. The current La Nina event may be the compensation event for the TWO previous El Ninos.
It certainly does not appear to be a monster La Nina. However, we may experience a mild to moderate La Nina for an extended period of time. The predictive models keep moving back the date for the end of this La Nina.
Hehe, I can fully disagree with Pablo. 3-4 units from bottom to top, which also disproves the funny notion that La Ninas fuels El Ninos. Rising ENSO is what fuels Ninos. That’s when there is extra solar input.
Excellent post Bindidon.
Thank you.
Yes of course.
But no one really knows for certain when actually that big El Nino will happen… and how strong the cooling will persist to be till then.
That presents a daring conundrum for the climateriat.
While for a long time now they have played through force of authority a “win-win” scenario game, now they are under the stress to gamble, meaning that they may end up with a “lose–lose” outcome… with the chance being at best for them @ 50/50, with a considerable stretch there.
cheers
That would only be true if whatever is causing warmth to be stored in the oceans was constant.
Since we are still arguing over the source of the warmth, to conclude that whatever it is must be constant, is to say the least, premature.
Lots of things are premature, like the predictions that all oil would run out by 1980 and all arctic sea ice would be gone by 2012.
But the nice thing about catastrophic predictions is that its OK to keep moving the goal posts to pretend that you can predict the future. Nobody ever gets called on it.
The predictions are just guesses based on past behavior of a planetary force, mother nature, over which we have no control. Thus, the continued moving of the goal posts to cover the scientists collective butts when their forecasting falls flat. If its plausible enough, more grant money to continue studying and not having to get a real job. Good work if you can get it…
What are these “normal” temperatures, please? Who defines what is “normal” in a dynamic climate system?
I was thinking the same thing. It’s like normal daylight hours. The ocean temperature passes through normal on its way from low to high and back again.
Moi aussi.
And the boxes drawn around these areas of the ocean are totally arbitrary.
Normal temperatures are required to maintain a socialist economy.
Other peoples money runs out sooner when its hot. Fact.
Normal is a distribution, not a distinct point within it. Pretty much anything we see in the climate is normal, is it not?
Not normal would be the imaginary woke ideal that never changes.
it’s like when I see a weatherman… er…. weatherperson… say something like, “today is going to be 4 degrees above normal”- that always bothers me- as if to say today won’t be n normal- I should think normal for any given day has an extremely wide range, especially some areas of the world, like New England
That bothers me too. Please just tell me what the weather will be like, not the commentary. They also describe any rainy or snowy day as something bad or depressing, like only sunny days will make a person happy. I’m sorry but rain and clouds are normal weather and very much needed.
Our One news weatherman here in NZ likes to tell us that temperatures will be x degrees above where they ‘should’ be. That always grinds my gears.
enough to cause panic in the streets!
Yes, I wish they would stick to making objective statements based on fact rather than the insidious subjective statements based on opinion.
Normal is based on opinion whereas average is based on fact.
They are not interchangeable and an interesting part of the NZ forecasts is they seem to be above normal when hot and below average when cold.
Disingenuous and misleading.
So when was the last time the temperature was where is “should” be? My bet is that is not where it should be much more often than where is should be. 😉
Absolutely. WTF is ‘normal’ in a constantly changing climatic system? That’s like ‘the average man’ – he doesn’t exist nor does normal weather or climate. They should say what they mean, assuming they know. Is it the last 30 year average? To not enough hot or warm events to keep the media in a tizzy? Exactly what is their ‘normal’?
It may just mean the recent average, sometimes the temperature is higher than that, sometimes lower, sometimes about normal.
Yes, and what on earth is meant by
“which have dropped to nearly normal levels in the latest monthly reading”?
0.03C anomoly is only _nearly_ normal?
Surely ‘normal’ would cover a range of temperatures, and I would have thought 0.03C above average would fall well within that range.
We can defne average values (and even modify them to fit a story). I don’t think that we have a long enough hisotry of any climate variable to be able to assess “normal”.
The vagueness is a reluctance to come out and say T has dropped 0.5°C, almost the same amount that it rose since 1850! It only has to drop few more points to hook up with the 1945-1979 cooling to erase the Global Warming of the 1980s and late 90s! There is a lot of pain and and angst in the in climateburg
Good point. With weather and climate any average is not normal. The average temperature for any given day might only occur for two short periods of time, once in the morning and once in the evening.
Worse yet, records are set an incalculable number of times every day somewhere on Earth. Today at 12:01 pm was the warmest temperature ever recorded at 12:01 on February 10th in the northeast corner of my back yard (garden). I have no idea if that is true, but it illustrates the point.
good article but when people use summer and winter as references for timing of large scale events spanning both hemispheres I have to check their location and time frames. Heading into Summer in the North is heading into Winter down under 🙂
Interesting in that the difference of the earths’ temperature between the peak of El Niño and adjacent La Niña is about 0.5 deg C, and the world deals with this change with local negative/positive changes, but overall the world keeps right on doing what it does. It looks like a 0.5 deg C temperature change doesn’t have much effect. Over the course (1979 to 2022) of the world temperature chart the overall lowest La Niña to warmest El Niño is about 0.9 deg C, and that doesn’t appear to be a problem, unless you are against greening of the planet.
The short term effect of a given temperature change is much smaller than the long term effect. Given a 0.5ºC change, every day would add to the effect and after some years, if it is not reversed, the effect would be very important. After some centuries the effect of that 0.5ºC is huge. The LIA was just about a 0.5ºC cooling that remained for half a millennium.
Javier, I understand your point, but how about adaption? Both plants and animals adapt, sometimes by changing and staying put and sometimes by moving a little. The slower effect gives more time for adaption.
Average temperature is not a good way to judge the climate. The avg of 40 and 60 is fifty, but so is the avg between 0 and 100.
I agree. The current obsession with a single global temperature (GAT) uses data that is massaged, homogenized, and averaged to the point that any variation over seasonal changes just totally disappears.
La Niña cold tongue is contracting, as demonstrated by the increase in temperature in the Niño-3.4 region. La Niña won’t last past April.
Chances of being followed by a 2022-23 winter Niño are higher than a third Niña in a row, which is unusual but not unheard. Chances of Neutral are also lower.
In Spain we would welcome an El Niño, since we are short on precipitations and undergoing a quite strong drought currently. Let’s hope that the disappearance of La Niña brings lots of badly needed spring rain.
Agreed, to both parts.
We were several times in Andalucia since 2010, and have noticed the increasing drought traces you mention.
East of Málaga (a few km north of Torrox), the difference between 2021 and 2017 was amazing in the hills around us.
So CO2 doesn’t control droughts? A cooler Central to Eastern Pacific does? Don’t worry, though, the Warmnusts are working hard to “prove” CO2 drives ENSO.
Jesus is that fixation on the CO2 blah blah boring!
Are you able to think about something different?
Boring or not, I’ve been told by the U.S. government that Man’s emissions of CO2 is an existential threat to all of humankind. It is so personally fearsome that its all I can think about. Numerous phycological medical practices have been established to treat this disorder. Be afraid!
I also agree, and have waited for this time, for when sunspot activity exceeds 95 v2 SN.
Niño34 began an upward trend in mid-Dec 2021 after sunspot activity exceeded 95, my sun-ocean decadal warming threshold, for 13 days in Dec starting Dec 16, the SN average was 117.8, which translated into TSI also rising above my warming threshold, initiating the Niño34 warming.
Many people mistake the warming out of a La Niña at the start of a solar cycle to be a consequence of relative cloudlessness when the ocean absorbs more sunlight, ‘recharging’, but it is being recharged from the sun being strong enough from solar activity, particularly while it’s happening near the perihelion, enhancing the tropical warming effect.
The fact is central Pacific outgoing longwave radiation (CP OLR) has been positive all but two months since July 2019, so there has been plenty of time for the over-rated cloudless insolation warming effect to get going. Only now as solar activity has increased beyond the threshold, are the tropics starting to absorb solar radiation, as the January CP OLR is zero.
Everyone should be prepared for solar activity warming the ocean enough through the solar maximum for the ocean to exceed the 1.5C threshold ‘limit’. Credit the sun for it please.
The NCEP Niño34 projection for February, 2022 calls for the La Niña to end soon:
Nino4 has returned to “normal”, but Nino3 remains as cool as its been for the last 3 months or longer. The cold tongue may be contracting, but only at one end, not along its length.
Some how I bet we still sea surface temperatures way above normal in most of the global temperature data sets
Why not? Tom Karl assured continued warming by adjusting ARGO up by 0.12 C to stay consistent with unreliable ship engine intake water temperatures. As more and more ARGO data accumulate, the warmer the trend becomes.
“In fact, there has been quite a noticeable drop in global temperatures”
There is no doubt whatsoever that 2021 was cooler than 2020; which I’m certain was a major headache for alarmism in general and CoP26 in particular. They had to come up with creative headlines like “2021 was world’s 6th-warmest year on record” etc. and point to the birth of the industrial revolution as the beginning of all our woes.
Should this year turnout to be similar or perhaps a bit cooler than 2021 I wonder what they will come up with? 7th or 8th-warmest year on record doesn’t look so good.
No doubt about it , water ocean temp has more influence on world weather that the warmist’s like to call climate change than the local hot or cold air temps .
Global tropospheric temperature trend anomaly estimates appear to coincide with a simple integral of the NINO indices. The last several decades have presented a slight dominance of positive NINO anomalies. The slightest shift to negative NINO anomalies would surely correspond to an opposite effect on tropospheric temperature trends. There is no reason to expect the past pattern of positive dominance during the satellite observation period will persist. It’s anyone’s guess. This observed internal energy oscillation between ocean and atmosphere has no requirement for TOA energy imbalance.
could be a ~100 year cycle, could be a ~1000 year cycle
“Global tropospheric temperature trend anomaly estimates appear to coincide with a simple integral of the NINO indices.”
True. UAH lags the ocean (HadSST3) by 2 months, while the 30y HadSST3 perfectly correlated (r=.995) with the 30y integrated MEI, when iMEI was continuously positive, otherwise r=.62 with SST3 lagging iMEI by 9 months:
“…no requirement for TOA energy imbalance”
True, this is why my work starts at the ocean surface not TOA.
good stuff Bob.
Paul Dorian said: “In recent decades, the number of El Nino episodes has surpassed the number of La Nina events”.
Since you used UAH for your analysis I’ll consider the period from 1978/12 to present. And since you used ONI I’ll do the El Nino and La Nina counting with that dataset. Given those parameters I count 12 El Nino events and 14 La Nina events. The average of the ONI is 0.02.
I noticed you also had a breakdown of the ONI since 2010. Starting from that year we have had 3 El Nino events and 6 La Nina events. The average of the ONI is -0.06.
Would you mind clarifying what you mean when you say the number of El Nino episodes surpassed the number of La Nina events?
Maybe it depends on how you do the stat with which source you use.
If I use MEI V2’s data
https://psl.noaa.gov/enso/mei/data/meiv2.data
and sum up the positive and negative numbers in the monthly data, I obtain, out of 516,
But averaging the monthly values gives as mean indices for 1979-2021
and for 2010-2021
Here is a Niño / Niña split over the entire MEI V2 period:
The MEI index trends for El Niño resp. La Niña: -0.09 resp. -0.10 / decade.
NOAA keeps changing the base over time. This may be influencing any comparisons over time. When warming is will make El Nino events looks weaker and La Nina event look stronger. The opposite will happen when cooling.
You confound two basically different NOAA ENSO products:
While their NINO3+4 has a shifting reference period, MEI’s V2 anomalies are based on a fixed reference period (1980-2018).
MEI V1, designed by Klaus Wolter, had as reference period 1950-1993.
How often in decadal scales are the global temp effects of negative ENSO, PDO, AMO, and solar cycle overlapped?
In just a few days the global temp anomaly went from 0.0 to 0.5. There were no noticeable changes in sea temps. Both poles appear to have warmed the most but the change seems universal over most of the land. How can global surface temps change so fast and so widespread. I’ve always seen global changes occur slowly even though the cold and warm areas move around. The last three days make no sense.
http://www.karstenhaustein.com/reanalysis/gfs0p5/GFS_anomaly_timeseries_global.html
The temperature is going down again coming 7 days to around 0,25 from 0,6. Interesting really.
Yep. The GFS is forecasting a decline over the next 7 days. Notice, however, the recent change in the 7 day forecast error. It has been significantly underestimating temperatures over the last couple of days. In fact, the last point in the graph (look closely) is at -0.3. So if that -0.3 error persists then we might not expect much of a decline from 0.6.
I agree hope someone can explain that
Strong landings in Peru’s anchovy fishery confirm that La Nina is well established
Peru fishery exports grew 39% in 2021 as anchovy catches rose – Undercurrent News
Lots of anchovies means lots of upwelling means lots of La Nina
Or Fe deposition from Tonga eruption
I suspect the flow in that last sentence needs to be reversed
Indeed – although with “means” the causality can be either direction – I think
edit: forgot to include the link to the YouTube video for reference.
[emphasis mine]
I wonder how related these computer models are to those that predict the weather?
I was watching a YouTube production of Lex Fridman interviewing Konstantin Batygin (a physicist at CalTech) discussing Planet 9, Gravity, and a bunch of other related topics. They were discussing the capabilities and relevance of simulating the birth of our solar system. Specifically, it was revealed that it isn’t a matter of whether or not the simulations were possible, it’s just that the results of the simulation are useless (or irrelevant). On or around the 53:16 mark, it is disclosed that the simulations used to predict the weather has a similar situation. I am paraphrasing here, but the equations that govern the weather simulations are well known, it’s just that the solutions to those equations are meaningless after a couple of days.
Would a parallel situation exist with respect to the climate simulations? I’m granting that the equations are well known (assumed to be synonymous with valid for argument’s sake), but perhaps the solutions are meaningless after a period of time. I’m also assuming that prediction accuracy can be validated by past performance (how close did previous solution data points track via simulation using data points from prior dates…backcasting, for lack of a better term).
La Niña is present.*
Equatorial sea surface temperatures (SSTs) are below average across the eastcentral and eastern Pacific Ocean.
The tropical Pacific atmosphere is consistent with La Niña.
La Niña is likely to continue into the Northern Hemisphere spring (67% chance
during March-May 2022) and then transition to ENSO-neutral (51% chance
during April-June 2022).*
SST Outlook: NCEP CFS.v2 Forecast (PDF corrected)
Issued: 7 February 2022
https://www.cpc.ncep.noaa.gov/products/analysis_monitoring/lanina/enso_evolution-status-fcsts-web.pdf
Still cold Peruvian Current. Little chance of El Nino. Will La Nina reappear in the Pacific in November?
The CFS.v2 ensemble mean (black dashed line) predicts La Niña to continue into autumn 2022.
The solar wind was too weak for the easterly wind to lead to a strong La Niña, similar to last year. But solar activity is slowly increasing and the easterly wind along the equator may intensify. This is evidenced by the increase in SOI with the recent increase in solar activity (several weak geomagnetic storms).
SOI has been rising again since late January.
https://www.longpaddock.qld.gov.au/soi/
http://www.bom.gov.au/archive/oceanography/ocean_anals/IDYOC007/IDYOC007.202202.gif
There is no indication of El Niño developing. The subsurface wave in the Pacific is too weak.
In November, as the ice around Antarctica begins to melt, the temperature of the Peruvian Current may drop again.
“these back-to-back La Nina episodes have seemingly affected global temperatures during the past many months which have dropped to nearly normal levels in the latest monthly reading.”
Big poker player’s tell! Seemingly indeed! It is an indisputable fact that effects are considerable. The only climate forecasts that have been on the money in timing and effect in the last several decades are those of sceptics who foresaw the current cooling period that is now worrying Gavin Schmidt (“models are running away too hot…”) and Jim Hansen who thinks it possible for a 30yr cooling in the works)
Having handwaved back to back la Niñas, NOAA felt this needed a bit more emphasis to show how ‘ordinary’ this is, hence sleight of hand handwave:
“It is actually not all that unusual to have two La Nina events follow each other with eight of the twelve “first-year” La Nina events since 1950 followed by a second year episode during the subsequent winter season.”
Yes this happened, but coincided with the Ice-Age-Cometh deep cooling from 1945 to 1980; it stopped for the two decades of warming that is what all the global warming hype is about; and came back to usher in another 30-35 yr cooling period! They know this very well and are worrying themselves sick.
Climateers always signal what is in their hand and on their minds.
Surface temperatures in the equatorial Pacific remain low and there is no indication of a change in circulation anytime soon. Global troposphere temperature will continue to decline, consistent with the delayed La Niña effect.
Ireneusz, I pointed out (here on WUWT) in 2016 that there wasn’t enough warm water to sustain such an el Niño. It was very slow to develop. (I suspected the data had been fiddled when it finally went up) and then the temperature plunged down from the peak in the most rapid descent ever, I noted that cold water was not only upwelling in the equatorial east Pacific, but major flows of cold water were slanting from the NE and SE directly into the ENSO zones.
The pattern had changed and ushered in this very long new kind of la Niña. My observations were ignored which one has to get used to I guess.
I love the hopium displayed by the scale. Open ocean temperature is limited annually to 30C with a monthly overshoot to 31C. Having a scale to 45C is so silly and ill-informed.
This is incorrect. It is actually the other way around. It has dominated the last two austral summers.
Says the man down under!
Paul: You state that “The warm waters of the equatorial Pacific Ocean store a great amount of latent heat”
Did you use the term “latent heat” in error, or is it a novel use of the term to mean “heat hidden below the surface”, which is what seems to be released when an El Niño discharges hot water from the depths to the surface layer.
As a total neophyte in the field of niñology without the time to read it up myself, I’ve always had these nagging questions.
Questions 2 and 3 arise from my (not unreasonable) assumption that warmer water is less dense than cooler water (as long as their salinity is equal) and so should always tend to be on surface. And if it’s denser because of higher salinity, why does it come to surface at all?
I think the Peruvian Current water is less salty because it comes from the sea ice around Antarctica, and the Peruvian Current is a surface current. This water is pushed at the equator by a steady wind. Note that La Niña intensifies in November and lasts through the summer in the Southern Hemisphere.
“The La Niña event which commenced in November 2021 is predicted by climate models to persist until at least March 2022. Since November, overall rainfall for northern Australia has been well above average. The latest climate outlooks indicate that for the remainder of the wet season (until the end of April), average to above-average rainfall is likely across much of northern Australia, with a high chance of above-average totals expected for northern Queensland and parts of the southern Northern Territory.”
My understanding is this. When the Trade Winds are strong, they push equatorial water towards the Pacific Warm Pool, where it accumulates to considerable depth. When the Trade winds weaken, this warm water sloshes back to the east across the Pacific, and the heat trapped in the warm pool is released to the atmosphere. As I mentioned in a comment above, this El Niño “warming” is actually the ocean venting heat to the atmosphere, where is can be radiated away to space. The ocean/atmosphere system is actually cooling, but the atmosphere warms as the heat passes through on its way to deep space.
The stratospheric polar vortex is strengthening.
Circulation will now be more latitudinal. Winter in the northern hemisphere will last longer. More snowfall in Europe.
As this article points out, the Nino 34 region is an important indicator of global weather conditions.
This is what the CMIP3 models predicted:
http://climexp.knmi.nl/data/itas_cmip3_ave_mean_sresa1b_-170–120E_-5-5N_n_5sea_su_1980:2025.png
This is what has actually been recorded:
http://climexp.knmi.nl/data/isstoi_v2_-170–120E_-5-5N_n.png
There is no global warming in the Nino34 region over the past 40 years.
And note the impossible low temperature of the models in 1980.
Correlating CMIP3 model output with Nino34 SST:
The correlation coefficient is actually negative for all months over the 42 years.
How does anyone with an ounce of knowledge believe climate models have any useful scientific application?
Regardless how correct these good ol’ CMIP3 models might have been, the minimum you could do would be to enter correct data, before you draw possibly irrelevant conclusions.
The Nino 3+4 region’s coordinates are: 5N-5S, 120W-170W.
Here is a graph made out of the UAH 6.0 LT grid for that region:
During the previous La Niña, the largest drop in troposphere temperature occurred in February 2021.
NASA used to be part of the Australian Bureau of Meteorology data base for ENSO predictions but they dropped them off over a year ago because they did not agree with the warming narrative.
Now they only use 7 instead of 8.
I hope they end up with egg on their face big time.
At the moment the SOI is just doing a slight uptick.
No one knows where it is going, look at the sphagetti.
–
I use a stock market technique, follow the trend.
At any one moment the trend is moving toward or away from zero.
The movement away is pushed by the trend positively but weakening.
The movement back is pushed positively but increasing.
when it is going up, or down expect it to keep doing so, but not forever.
If it goes the other way, ditto.
–
Past performance can be an indicator of future performance.
Until it is’nt.
I wish these articles would stop referring to ‘normal’ temperatures and call it what it is – average temperatures.
A tropical cyclone is seen north of New Zealand.
http://tropic.ssec.wisc.edu/real-time/mtpw2/product.php?color_type=tpw_nrl_colors&prod=ausf×pan=24hrs&anim=html5
Heavy frost on the Great Lakes in two days.