
")
Global Beef Market Report by Producing Country (United States, Brazil, European Union, China, India, Argentina, Australia, Mexico, Canada, Russia, South Africa, Others), Consuming Country (United States, Brazil, China, European Union, India, Argentina, Mexico, Russia, Japan, United Kingdom, Canada, Others), Importing Country (China, United States, Japan , Hong Kong, South Korea, United Kingdom, European Union, Chile, Egypt, Malaysia, Philippines, Others), Exporting Country (Brazil, United States, Australia, India, European Union, New Zealand, Argentina, Canada, Uruguay, Paraguay, Mexico, Others), and Company Analysis 2024-2028
Get Free Customization in This Report
Global Beef Market is expected to reach US$ 421.61 Billion in 2028 at a compound annual growth rate (CAGR) of 4.05% from 2022 to 2028. Beef is a popular meat in many cultures, and as people travel and are exposed to different cuisines, they may develop a taste for beef. The global beef meat industry is a large and complex sector that involves producing, processing, and distributing beef products. It significantly contributes to the world's food supply and employs millions globally. The demand for beef has been increasing globally, driven by rising populations and income levels, particularly in developing countries.
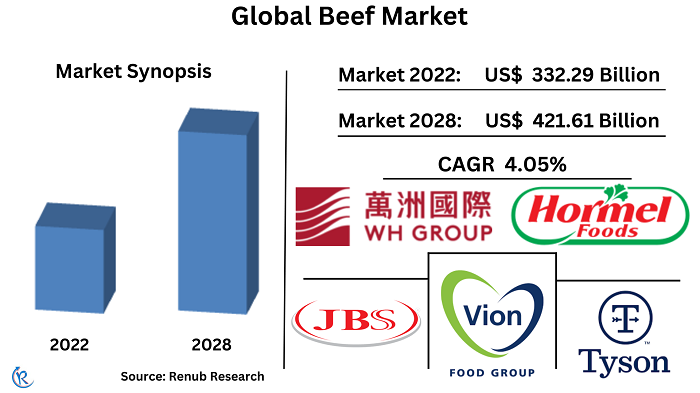
However, the industry is also faced with challenges, such as concerns over animal welfare, environmental impact, and health risks. Also Trade disputes, food safety regulations, and supply chain disruptions can significantly impact the industry. The beef industry invests in marketing and advertising to promote beef consumption. Global Beef Industry was valued at US$ 332.29 Billion in 2022.
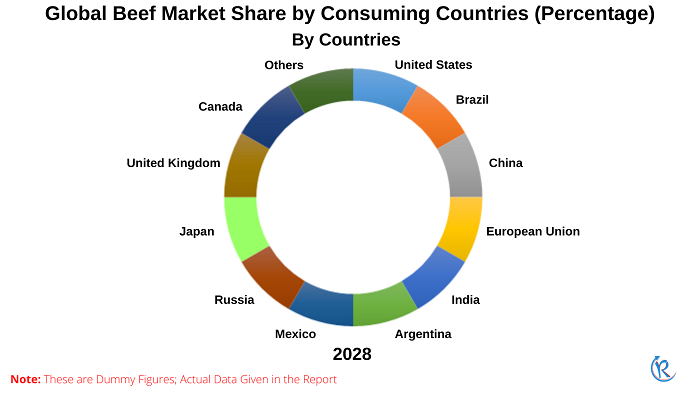
USA was the Largest Consumer of Beef Worldwide
The Beef sector is a significant contributor to the global food industry and is driven by a growing demand for beef products, particularly in developing countries where populations and income levels are rising. The United States was historically one of the largest consumers of beef meat globally. Americans have a long history of consuming beef, and it remains a staple of the country's diet. The United States was the largest beef consumer in the world, followed by Brazil, China, the European Union, India, Argentina, Mexico, Russia, Japan, the United Kingdom, Canada, and Others.
Brazil and the United States Beef Industry will Increase in Upcoming Years
Beef production is a major part of the global agriculture industry and occurs in many countries worldwide. Some of the largest beef-producing countries include the United States. It is the largest beef producer in the world. East Asia is the most important regional market for U.S. beef exports. Brazil is the second largest producer, with a significant portion of its production dedicated to export markets. China is a large and growing producer, with a rapidly expanding middle-class driving increased demand for beef.
India is the largest producer of buffalo meat, an essential beef source in many countries. Australia, Argentina, is a significant producer and exporter of beef, known for its high-quality grass-fed products. Other major beef-producing countries include Mexico, Canada, Russia, South Africa, and the European Union. The same production levels can vary from year to year due to factors such as weather conditions, disease outbreaks, and government policies.
China was the Largest Importer of Beef in the World
Beef is a highly traded commodity, and many countries import significant amounts of beef to meet the demands of their populations. The factors influencing the beef import market include a supply of beef from exporting countries and the need for beef in importing countries are important drivers of the beef import market. Beef imports are forecast to increase for the most prominent importers: China/Hong Kong (HK), the U.S., Japan, and South Korea.
China/H.K. continues to grow as the largest beef importer in the world. United States is also one of the largest beef-importing countries. Beef imports into Japan have remained largely stable in recent years, but they were down somewhat from a record in 2019. In recent years, South Korea has become another large beef importer. For 2023, the largest importers, including China/H.K., the U.S., Japan, and South Korea, are forecast to gain beef imports. Other significant beef-importing countries include Chile, the U.K., E.U., Egypt, the Philippines, and Malaysia.
United States was the World's biggest Beef Exporter
Global beef exports have seen significant growth in recent years, with major exporting countries including Brazil, Australia, and the United States. These countries export a range of beef products, including fresh and frozen cuts and processed beef products. Some of the largest importers of beef are countries in the Asian region, such as China, Japan, and South Korea, as well as countries in the Middle East and Europe. The demand for beef has increased due to population growth and rising incomes, leading to increased imports and exports of beef products worldwide.
The rise in global beef exports can be attributed to several factors, including increasing demand, improved production methods, and advancements in transportation and logistics. Growing populations, particularly in developing countries, and rising incomes have increased the demand for beef and other protein-rich food products. Additionally, improvements in breeding and feeding techniques have resulted in a more efficient and cost-effective beef production system, making it possible to meet growing demand. The development of new trade agreements and the liberalization of international trade have also played a role in the rise of beef exports.
Key Players
The market is characterized by various global players such as Tyson Foods, Inc.; Danish Crown; Cargill Incorporated; Marfrig Global Foods S.A.; N.H. Foods Ltd.; Minerva Foods; St. Helen's Meat Packers; Hormel Foods Corporation; JBS USA; National Beef Packing Company, LLC; Vion Food Group; Australian Agricultural Company Limited.
JBS, a global pioneer in protein-based food, will present at Gulfood 2022, the world's largest annual food and beverage trade fair, in February 2022. (United Arab Emirates). Friboi, JBS's best-selling Brazilian beef brand, provided participants with a premium experience with the Black Friboi and 1953 ranges. Only 1% of the cattle satisfy the selection requirements for Black Friboi, the brand's most premium halal portfolio developed from the best genetic Black Angus in the USA: only 1% of the animals match the selection criteria.
Renub Research report titled “Global Beef Market, Forecast By Producing Country (United States, Brazil, European Union, China, India, Argentina, Australia, Mexico, Canada, Russia, South Africa, Others), Consuming Country (United States, Brazil, China, European Union, India, Argentina, Mexico, Russia, Japan, United Kingdom, Canada, Others), Importing Country (China, United States, Japan , Hong Kong, South Korea, United Kingdom, European Union, Chile, Egypt, Malaysia, Philippines, Others), Exporting Country (Brazil, United States, Australia, India, European Union, New Zealand, Argentina, Canada, Uruguay, Paraguay, Mexico, Others), Company Analysis (JBS S.A, Tyson Foods, Pilgrim's Pride Corporation, Danish Crown Group, Vion Food Group, WH Group, Hormel Foods Corporation, and Muyuan Foods)". This report provides an all-encompassing analysis of the key growth drivers and restraining factors, demand, and their projections for the upcoming years.
Consuming Countries – Global Beef Meat Market and Volume
1. United States
2. Brazil
3. China
4. European Union
5. India
6. Argentina
7. Mexico
8. Russia
9. Japan
10. United Kingdom
11. Canada
12. Others
Producing Countries – Global Beef Volume
1. United States
2. Brazil
3. European Union
4. China
5. India
6. Argentina
7. Australia
8. Mexico
9. Canada
10. Russia
11. South Africa
12. Others
Importing Countries – Global Beef Volume
1. China
2. United States
3. Japan
4. Hong Kong
5. South Korea
6. United Kingdom
7. European Union
8. Chile
9. Egypt
10. Malaysia
11. Philippines
12. Others
Exporting Countries – Global Beef Volume
1. Brazil
2. United States
3. Australia
4. India
5. European Union
6. New Zealand
7. Argentina
8. Canada
9. Uruguay
10. Paraguay
11. Mexico
12. Others
Company Insights:
• Overview
• Recent development
• Sales Analysis
Key Payers Analysis:
1. JBS S.A
2. Tyson Foods
3. Pilgrim's Pride Corporation
4. Danish Crown Group
5. Vion Food Group
6. WH Group
7. Hormel Foods Corporation
8. Muyuan Foods
Report Details:
| Report Features | Details |
| Base Year | 2022 |
| Historical Period | 2018 - 2022 |
| Forecast Period | 2023 - 2028 |
| Market | US$ Billion |
| Segment Covered | Consuming Countries, Producing Countries, Importing Countries, and Exporting Countries |
| Consuming Countries Covered | United States, Brazil, China, European Union, India, Argentina, Mexico, Russia, Japan, United Kingdom, Canada and Others |
| Companies Covered | JBS S.A, Tyson Foods, Pilgrim's Pride Corporation, Danish Crown Group, Vion Food Group, WH Group, Hormel Foods Corporation, and Muyuan Foods |
| Customization Scope | 20% Free Customization |
| Post-Sale Analyst Support | 1 Year (52 Weeks) |
| Delivery Format | PDF and Excel through Email (We can also provide the editable version of the report in PPT/Word format on request) |
1. Introduction
2. Research Methodology
3. Executive Summary
4. Market Dynamics
4.1 Growth Drivers
4.2 Challenges
5. Global Beef Market
6. Market share - Global Beef Market
7. Volume Share- Global Beef Meat
7.1 Consuming Countries
7.2 Producing Countries
7.3 Importing Countries
7.4 Exporting Countries
8. Global Top 12 Countries – Global Beef Market and Volume
8.1 United States
8.1.1 Market
8.1.2 Volume
8.2 Brazil
8.2.1 Market
8.2.2 Volume
8.3 China
8.3.1 Market
8.3.2 Volume
8.4 European Union
8.4.1 Market
8.4.2 Volume
8.5 India
8.5.1 Market
8.5.2 Volume
8.6 Argentina
8.6.1 Market
8.6.2 Volume
8.7 Mexico
8.7.1 Market
8.7.2 Volume
8.8 Russia
8.8.1 Market
8.8.2 Volume
8.9 Japan
8.9.1 Market
8.9.2 Volume
8.10 United Kingdom
8.10.1 Market
8.10.2 Volume
8.11 Canada
8.11.1 Market
8.11.2 Volume
8.12 Others
8.12.1 Market
8.12.2 Volume
9. Producing Countries – Global Beef Volume
9.1 United States
9.2 Brazil
9.3 European Union
9.4 China
9.5 India
9.6 Argentina
9.7 Australia
9.8 Mexico
9.9 Canada
9.10 Russia
9.11 South Africa
9.12 Others
10. Importing Countries – Global Beef Volume
10.1 China
10.2 United States
10.3 Japan
10.4 Hong Kong
10.5 South Korea
10.6 United Kingdom
10.7 European Union
10.8 Chile
10.9 Egypt
10.10 Malaysia
10.11 Philippines
10.12 Others
11. Exporting Countries – Global Beef Volume
11.1 Brazil
11.2 United States
11.3 Australia
11.4 India
11.5 European Union
11.6 New Zealand
11.7 Argentina
11.8 Canada
11.9 Uruguay
11.10 Paraguay
11.11 Mexico
11.12 Others
12. Porters Five Forces Analysis
12.1 Bargaining Power of Buyers
12.2 Bargaining Power of Suppliers
12.3 Degree of Competition
12.4 Threat of New Entrants
12.5 Threat of Substitutes
13. Key Players Analysis
13.1 JBS S.A
13.1.1 Overview
13.1.2 Recent Development
13.1.3 Financial Insight
13.2 Tyson Foods
13.2.1 Overview
13.2.2 Recent Development
13.2.3 Financial Insight
13.3 Pilgrim's pride corporation
13.3.1 Overview
13.3.2 Recent Development
13.3.3 Financial Insight
13.4 Danish Crown Group
13.4.1 Overview
13.4.2 Recent Development
13.4.3 Financial Insight
13.5 Vion Food Group
13.5.1 Overview
13.5.2 Recent Development
13.5.3 Financial Insight
13.6 WH Group
13.6.1 Overview
13.6.2 Recent Development
13.6.3 Financial Insight
13.7 Hormel Foods Corporation
13.7.1 Overview
13.7.2 Recent Development
13.7.3 Financial Insight
13.8 Muyuan Foods
13.8.1 Overview
13.8.2 Recent Development
13.8.3 Financial Insight
List of Figures:
Figure-01: Global – Beef Market (Billion US$), 2018 – 2022
Figure-02: Global – Forecast for Beef Market (Billion US$), 2023 – 2028
Figure-03: United States – Beef Consumption Market (Billion US$), 2018 – 2022
Figure-04: United States – Forecast for Beef Consumption Market (Billion US$), 2023 – 2028
Figure-05: United States – Beef Consumption Volume (Thousand Metric Tonnes), 2018 – 2022
Figure-06: United States – Forecast for Beef Consumption Volume (Thousand Metric Tonnes), 2023 – 2028
Figure-07: Brazil – Beef Consumption Market (Billion US$), 2018 – 2022
Figure-08: Brazil – Forecast for Beef Consumption Market (Billion US$), 2023 – 2028
Figure-09: Brazil – Beef Consumption Volume (Thousand Metric Tonnes), 2018 – 2022
Figure-10: Brazil – Forecast for Beef Consumption Volume (Thousand Metric Tonnes), 2023 – 2028
Figure-11: China – Beef Consumption Market (Billion US$), 2018 – 2022
Figure-12: China – Forecast for Beef Consumption Market (Billion US$), 2023 – 2028
Figure-13: China – Beef Consumption Volume (Thousand Metric Tonnes), 2018 – 2022
Figure-14: China – Forecast for Beef Consumption Volume (Thousand Metric Tonnes), 2023 – 2028
Figure-15: European Union – Beef Consumption Market (Billion US$), 2018 – 2022
Figure-16: European Union – Forecast for Beef Consumption Market (Billion US$), 2023 – 2028
Figure-17: European Union – Beef Consumption Volume (Thousand Metric Tonnes), 2018 – 2022
Figure-18: European Union – Forecast for Beef Consumption Volume (Thousand Metric Tonnes), 2023 – 2028
Figure-19: India – Beef Consumption Market (Billion US$), 2018 – 2022
Figure-20: India – Forecast for Beef Consumption Market (Billion US$), 2023 – 2028
Figure-21: India – Beef Consumption Volume (Thousand Metric Tonnes), 2018 – 2022
Figure-22: India – Forecast for Beef Consumption Volume (Thousand Metric Tonnes), 2023 – 2028
Figure-23: Argentina – Beef Consumption Market (Billion US$), 2018 – 2022
Figure-24: Argentina – Forecast for Beef Consumption Market (Billion US$), 2023 – 2028
Figure-25: Argentina – Beef Consumption Volume (Thousand Metric Tonnes), 2018 – 2022
Figure-26: Argentina – Forecast for Beef Consumption Volume (Thousand Metric Tonnes), 2023 – 2028
Figure-27: Mexico – Beef Consumption Market (Billion US$), 2018 – 2022
Figure-28: Mexico – Forecast for Beef Consumption Market (Billion US$), 2023 – 2028
Figure-29: Mexico – Beef Consumption Volume (Thousand Metric Tonnes), 2018 – 2022
Figure-30: Mexico – Forecast for Beef Consumption Volume (Thousand Metric Tonnes), 2023 – 2028
Figure-31: Russia – Beef Consumption Market (Billion US$), 2018 – 2022
Figure-32: Russia – Forecast for Beef Consumption Market (Billion US$), 2023 – 2028
Figure-33: Russia – Beef Consumption Volume (Thousand Metric Tonnes), 2018 – 2022
Figure-34: Russia – Forecast for Beef Consumption Volume (Thousand Metric Tonnes), 2023 – 2028
Figure-35: Japan – Beef Consumption Market (Billion US$), 2018 – 2022
Figure-36: Japan – Forecast for Beef Consumption Market (Billion US$), 2023 – 2028
Figure-37: Japan – Beef Consumption Volume (Thousand Metric Tonnes), 2018 – 2022
Figure-38: Japan – Forecast for Beef Consumption Volume (Thousand Metric Tonnes), 2023 – 2028
Figure-39: United Kingdom – Beef Consumption Market (Billion US$), 2018 – 2022
Figure-40: United Kingdom – Forecast for Beef Consumption Market (Billion US$), 2023 – 2028
Figure-41: United Kingdom – Beef Consumption Volume (Thousand Metric Tonnes), 2018 – 2022
Figure-42: United Kingdom – Forecast for Beef Consumption Volume (Thousand Metric Tonnes), 2023 – 2028
Figure-43: Canada – Beef Consumption Market (Billion US$), 2018 – 2022
Figure-44: Canada – Forecast for Beef Consumption Market (Billion US$), 2023 – 2028
Figure-45: Canada – Beef Consumption Volume (Thousand Metric Tonnes), 2018 – 2022
Figure-46: Canada – Forecast for Beef Consumption Volume (Thousand Metric Tonnes), 2023 – 2028
Figure-47: Others – Beef Consumption Market (Billion US$), 2018 – 2022
Figure-48: Others – Forecast for Beef Consumption Market (Billion US$), 2023 – 2028
Figure-49: Others – Beef Consumption Volume (Thousand Metric Tonnes), 2018 – 2022
Figure-50: Others – Forecast for Beef Consumption Volume (Thousand Metric Tonnes), 2023 – 2028
Figure-51: United States – Beef Production Volume (Thousand Metric Tonnes), 2018 – 2022
Figure-52: United States – Forecast for Beef Production Volume (Thousand Metric Tonnes), 2023 – 2028
Figure-53: China – Beef Production Volume (Thousand Metric Tonnes), 2018 – 2022
Figure-54: China – Forecast for Beef Production Volume (Thousand Metric Tonnes), 2023 – 2028
Figure-55: Brazil – Beef Production Volume (Thousand Metric Tonnes), 2018 – 2022
Figure-56: Brazil – Forecast for Beef Production Volume (Thousand Metric Tonnes), 2023 – 2028
Figure-57: European Union – Beef Production Volume (Thousand Metric Tonnes), 2018 – 2022
Figure-58: European Union – Forecast for Beef Production Volume (Thousand Metric Tonnes), 2023 – 2028
Figure-59: India – Beef Production Volume (Thousand Metric Tonnes), 2018 – 2022
Figure-60: India – Forecast for Beef Production Volume (Thousand Metric Tonnes), 2023 – 2028
Figure-61: Argentina – Beef Production Volume (Thousand Metric Tonnes), 2018 – 2022
Figure-62: Argentina – Forecast for Beef Production Volume (Thousand Metric Tonnes), 2023 – 2028
Figure-63: Australia – Beef Production Volume (Thousand Metric Tonnes), 2018 – 2022
Figure-64: Australia – Forecast for Beef Production Volume (Thousand Metric Tonnes), 2023 – 2028
Figure-65: Mexico – Beef Production Volume (Thousand Metric Tonnes), 2018 – 2022
Figure-66: Mexico – Forecast for Beef Production Volume (Thousand Metric Tonnes), 2023 – 2028
Figure-67: Canada – Beef Production Volume (Thousand Metric Tonnes), 2018 – 2022
Figure-68: Canada – Forecast for Beef Production Volume (Thousand Metric Tonnes), 2023 – 2028
Figure-69: Russia – Beef Production Volume (Thousand Metric Tonnes), 2018 – 2022
Figure-70: Russia – Forecast for Beef Production Volume (Thousand Metric Tonnes), 2023 – 2028
Figure-71: Japan – Beef Production Volume (Thousand Metric Tonnes), 2018 – 2022
Figure-72: Japan – Forecast for Beef Production Volume (Thousand Metric Tonnes), 2023 – 2028
Figure-73: Others – Beef Production Volume (Thousand Metric Tonnes), 2018 – 2022
Figure-74: Others – Forecast for Beef Production Volume (Thousand Metric Tonnes), 2023 – 2028
Figure-75: China – Beef Import Volume (Thousand Metric Tonnes), 2018 – 2022
Figure-76: China – Forecast for Beef Import Volume (Thousand Metric Tonnes), 2023 – 2028
Figure-77: United States – Beef Import Volume (Thousand Metric Tonnes), 2018 – 2022
Figure-78: United States – Forecast for Beef Import Volume (Thousand Metric Tonnes), 2023 – 2028
Figure-79: Japan – Beef Import Volume (Thousand Metric Tonnes), 2018 – 2022
Figure-80: Japan – Forecast for Beef Import Volume (Thousand Metric Tonnes), 2023 – 2028
Figure-81: Hong Kong – Beef Import Volume (Thousand Metric Tonnes), 2018 – 2022
Figure-82: Hong Kong – Forecast for Beef Import Volume (Thousand Metric Tonnes), 2023 – 2028
Figure-83: South Korea – Beef Import Volume (Thousand Metric Tonnes), 2018 – 2022
Figure-84: South Korea – Forecast for Beef Import Volume (Thousand Metric Tonnes), 2023 – 2028
Figure-85: United Kingdom – Beef Import Volume (Thousand Metric Tonnes), 2018 – 2022
Figure-86: United Kingdom – Forecast for Beef Import Volume (Thousand Metric Tonnes), 2023 – 2028
Figure-87: European Union – Beef Import Volume (Thousand Metric Tonnes), 2018 – 2022
Figure-88: European Union – Forecast for Beef Import Volume (Thousand Metric Tonnes), 2023 – 2028
Figure-89: Chile – Beef Import Volume (Thousand Metric Tonnes), 2018 – 2022
Figure-90: Chile – Forecast for Beef Import Volume (Thousand Metric Tonnes), 2023 – 2028
Figure-91: Egypt – Beef Import Volume (Thousand Metric Tonnes), 2018 – 2022
Figure-92: Egypt – Forecast for Beef Import Volume (Thousand Metric Tonnes), 2023 – 2028
Figure-93: Malaysia – Beef Import Volume (Thousand Metric Tonnes), 2018 – 2022
Figure-94: Malaysia – Forecast for Beef Import Volume (Thousand Metric Tonnes), 2023 – 2028
Figure-95: Philippines – Beef Import Volume (Thousand Metric Tonnes), 2018 – 2022
Figure-96: Philippines – Forecast for Beef Import Volume (Thousand Metric Tonnes), 2023 – 2028
Figure-97: Others – Beef Import Volume (Thousand Metric Tonnes), 2018 – 2022
Figure-98: Others – Forecast for Beef Import Volume (Thousand Metric Tonnes), 2023 – 2028
Figure-99: Brazil – Beef Export Volume (Thousand Metric Tonnes), 2018 – 2022
Figure-100: Brazil – Forecast for Beef Export Volume (Thousand Metric Tonnes), 2023 – 2028
Figure-101: United States – Beef Export Volume (Thousand Metric Tonnes), 2018 – 2022
Figure-102: United States – Forecast for Beef Export Volume (Thousand Metric Tonnes), 2023 – 2028
Figure-103: Australia – Beef Export Volume (Thousand Metric Tonnes), 2018 – 2022
Figure-104: Australia – Forecast for Beef Export Volume (Thousand Metric Tonnes), 2023 – 2028
Figure-105: India – Beef Export Volume (Thousand Metric Tonnes), 2018 – 2022
Figure-106: India – Forecast for Beef Export Volume (Thousand Metric Tonnes), 2023 – 2028
Figure-107: European Union – Beef Export Volume (Thousand Metric Tonnes), 2018 – 2022
Figure-108: European Union – Forecast for Beef Export Volume (Thousand Metric Tonnes), 2023 – 2028
Figure-109: New Zealand – Beef Export Volume (Thousand Metric Tonnes), 2018 – 2022
Figure-110: New Zealand – Forecast for Beef Export Volume (Thousand Metric Tonnes), 2023 – 2028
Figure-111: Argentina – Beef Export Volume (Thousand Metric Tonnes), 2018 – 2022
Figure-112: Argentina – Forecast for Beef Export Volume (Thousand Metric Tonnes), 2023 – 2028
Figure-113: Canada – Beef Export Volume (Thousand Metric Tonnes), 2018 – 2022
Figure-114: Canada – Forecast for Beef Export Volume (Thousand Metric Tonnes), 2023 – 2028
Figure-115: Uruguay – Beef Export Volume (Thousand Metric Tonnes), 2018 – 2022
Figure-116: Uruguay – Forecast for Beef Export Volume (Thousand Metric Tonnes), 2023 – 2028
Figure-117: Paraguay – Beef Export Volume (Thousand Metric Tonnes), 2018 – 2022
Figure-118: Paraguay – Forecast for Beef Export Volume (Thousand Metric Tonnes), 2023 – 2028
Figure-119: Mexico – Beef Export Volume (Thousand Metric Tonnes), 2018 – 2022
Figure-120: Mexico – Forecast for Beef Export Volume (Thousand Metric Tonnes), 2023 – 2028
Figure-121: Others – Beef Export Volume (Thousand Metric Tonnes), 2018 – 2022
Figure-122: Others – Forecast for Beef Export Volume (Thousand Metric Tonnes), 2023 – 2028
Figure-123: JBS S.A – Global Revenue (Billion US$), 2018 – 2022
Figure-124: JBS S.A – Forecast for Global Revenue (Billion US$), 2023 – 2028
Figure-125: Tyson Foods – Global Revenue (Billion US$), 2018 – 2022
Figure-126: Tyson Foods – Forecast for Global Revenue (Billion US$), 2023 – 2028
Figure-127: Pilgrim's pride corporation – Global Revenue (Billion US$), 2018 – 2022
Figure-128: Pilgrim's pride corporation – Forecast for Global Revenue (Billion US$), 2023 – 2028
Figure-129: Danish crown group – Global Revenue (Billion US$), 2018 – 2022
Figure-130: Danish crown group – Forecast for Global Revenue (Billion US$), 2023 – 2028
Figure-131: Vion Food Group – Global Revenue (Billion US$), 2018 – 2022
Figure-132: Vion Food Group – Forecast for Global Revenue (Billion US$), 2023 – 2028
Figure-133: WH group – Global Revenue (Billion US$), 2018 – 2022
Figure-134: WH group – Forecast for Global Revenue (Billion US$), 2023 – 2028
Figure-135: HORMEL FOODS CORPORATION. – Global Revenue (Billion US$), 2018 – 2022
Figure-136: HORMEL FOODS CORPORATION. – Forecast for Global Revenue (Billion US$), 2023 – 2028
Figure-137: Muyuan foods – Global Revenue (Billion US$), 2018 – 2022
Figure-138: Muyuan foods – Forecast for Global Revenue (Billion US$), 2023 – 2028
List of Tables:
Table-01: Global – Beef Consumption Market Share by Countries (Percent), 2018 – 2022
Table-02: Global – Forecast for Beef Consumption Market Share by Countries (Percent), 2023 – 2028
Table-03: Global – Beef Consumption Volume Share by Countries (Percent), 2018 – 2022
Table-04: Global – Forecast for Beef Consumption Volume Share by Countries (Percent), 2023 – 2028
Table-05: Global – Beef Production Volume Share by Countries (Percent), 2018 – 2022
Table-06: Global – Forecast for Beef Production Volume Share by Countries (Percent), 2023 – 2028
Table-07: Global – Beef Import Volume Share by Countries (Percent), 2018 – 2022
Table-08: Global – Forecast for Beef Import Volume Share by Countries (Percent), 2023 – 2028
Table-09: Global – Beef Export Volume Share by Countries (Percent), 2018 – 2022
Table-10: Global – Forecast for Beef Export Volume Share by Countries (Percent), 2023 – 2028
Reach out to us
Call us on
USA: +1-678-302-0700
INDIA: +91-120-421-9822
Drop us an email at
info@renub.com