European Geologist Journal 54
Geothermal use and potential of the Lund Sandstone in SW Skåne, Sweden
by Mikael Erlström 1,2 and Jan-Erik Rosberg 3
1 Geological Survey of Sweden, Kiliansgatan 10. SE-223 50 Lund, Sweden
2 Lund University, Department of Geology, Sölvegatan 12, SE-223 62 Lund, Sweden
3 Lund University, Division of Engineering Geology, Faculty of Engineering, LTH, Box 118, SE-221 00 Lund, Sweden
Contact: mikael.erlstrom@sgu.se
Abstract
The Cretaceous Lund Sandstone has been used as a geothermal resource by the city of Lund since the mid 1980s. A geothermal plant has provided up to 350 GWh/year from the c. 20 °C reservoir, corresponding to up to 45% of the heating demand in the city. The operational experiences serve as a unique reference for further exploration. The heat in place is estimated to correspond to several hundred years of heat consumption for five urban areas with about 300,000 inhabitants. The heat storage potential is also substantial and highly interesting for further exploration. Illustrating the heat reserve and the storage potential will hopefully foster further use of the resource, provided there are feasible competitive technical solutions.
Cite as: Erlström, Mikael, & Rosberg, Jan-Erik. (2022). Geothermal use and potential of the Lund Sandstone in SW Skåne, Sweden. European Geologist, 54. https://doi.org/10.5281/zenodo.7882784

This work is licensed under a Creative Commons Attribution 4.0 International License.
1. Introduction
In the early 1980s the Swedish Energy Agency (SWEA) promoted actions where fossil fuels for heating purposes could be substituted by other sources of energy. This aroused interest in investigating the potential of geothermal energy as a contributor of heat to the district heating systems. One potential geothermal reservoir was the Upper Cretaceous Lund Sandstone in southwest Skåne, the southernmost province of Sweden. In 1981 the department of Engineering Geology, Lund Energy (today Kraftringen AB) and the General Swedish Electrical Company (ASEA STAL AB) presented a concept to utilise this reservoir. A full-scale system was built and put into production in 1984 [1,2]. Despite, relatively low initial formation temperatures (about 21 °C), it was economically feasible to utilise the reservoir for geothermal heat to the city of Lund. This was largely related to a significant gross thickness of several hundred metres, a high net sand share, high porosity, and permeability. The built capacity corresponded initially to about 40% of the district heat demand in Lund. However, lower temperatures and flow capacities have resulted in a gradually decreasing share. All this is as expected in the life-cycle models, based on production capacities, distances between production and injection wells, and the lifetime for the well components [3,4]. Overall, the lifespan of the system is much better than expected. The system is still operating – although with reduced capacity – after 37 years and demonstrates a successful use of this geothermal resource, especially regarding the operational experience and environmental benefits. Along with other examples of long-time utilisation [5], this shows that sustainable geothermal production is viable.
Although the Lund Sandstone is found beneath several urban areas in southwest Skåne, its geothermal value is largely unknown. This is partly due to the fact that little has been published that shows its geothermal value, including distribution and volume of the reservoir, and available amount of heat. Early on publications primarily presented site-specific operational experiences from the Lund geothermal plant [1–4,6] and not the entire reservoir. Aside from a brief description in the European Geothermal Atlas in 2002 [7], until this study there had not been any regional GIS data of the reservoir showing the depths and the gross volume for the calculation of the available heat. The GIS data, together with a comprehensive compilation of previously unpublished well data on the reservoir properties [8], has made it possible to assess the resource from a regional perspective for the first time. In addition, an increasing number of heat-in-place (HIP) calculations during the last decades on various geothermal reservoirs and scales [9–12] provide valuable references on the methodology as well as on heat-in-place estimates in a European perspective.
The Lund Sandstone has lately also been assessed concerning its energy storage potential [13,14], which further highlights its value. As the European Commission [15] states, decarbonising the energy demand and increasing the utilisation of renewable resources is of paramount importance. This largely aims to increase the capacity to store energy when other renewable resources are integrated in the energy grids. This is also emphasised in the Geological Service for Europe (GSEU) project [17] that will directly support the vision of the European Green Deal [18], including thematic work on resource assessments of pan-European geothermal energy and underground storage. There is a potential to increase the share of geothermal energy but that the potential needs to be better promoted and recognised. In this context an assessment of the available heat in the Lund Sandstone provides valuable information to a region in southernmost Sweden with about 300,000 inhabitants, mainly living in five urban areas with district heating systems that facilitate the use of geothermal heat. Hence, this study aims to increase awareness of the resource by demonstrating the operational experiences, reservoir characteristics, distribution, and calculations of the HIP (GJ/m2) and heat storage potential (HSP, GJ/m2) for the Lund Sandstone.
2. Study area
2.1 Geological setting and data
The Lund Sandstone is found in the easternmost margins of the Mesozoic Danish Basin, adjacent to the bounding Romeleåsen Fault Zone to the NE (Figures 1, 2). The distribution is based on wells and seismic data from surveys by the Swedish Oil Prospecting CO (OPAB) in the early 1970s, Swedegas AB in the 1980s and by Lund Energy (today Kraftringen AB) and the department of Engineering Geology in 2001 and 2008 [8]. The reservoir properties are evaluated from wire-line logs, core analyses and hydraulic data from 20 exploration wells [8].
The several hundred-metre-thick reservoir is found within a c. 1,500 m thick Upper Cretaceous–Paleogene limestone-dominated succession (Figure 1) and consists of deltaic sandstone, formed during the late Campanian by extensive erosion and deposition, related to Alpine compression tectonics and uplift of the Sorgenfrei-Tornquist Zone [18,19].
The sandstone is defined as the Lund Sandstone Member in the Upper Cretaceous–Paleogene Höllviken Formation [20]. The gross thickness is up to c. 700 m in the northeast, while gradually thinning to the southwest and gradually becoming finer grained (Figure 2a). In the study area, the Lund Sandstone is found between 350 and c. 1,100 m depth (Figures 2b and 3). The net sand share is based on a porosity cut-off value of 15% using data from Sonic and Neutron logs. The net sand share varies between 50 and 80% of the gross thickness in the northeast parts and c. 20–30% in the southwest parts of the study area.
The formation temperatures commonly range between 17 °C and 35 °C for reservoir depths between 350 and 1,100 m. The reservoir pressure is equivalent to the hydrostatic pressure.
The reservoir contains commonly up to 50 m thick highly porous and permeable sandstone units separated by argillaceous and arenaceous limestone and calcareous claystone. Core analyses on sandstone beds show a porosity between 20 and 32% and a permeability of up to about 6 Darcy, but commonly 1.1–2.7 Darcy [8]. Hydraulic tests give a hydraulic conductivity of about 6·10-5 m/s and a transmissivity of 3–5 ·10-3 m2/s [1]. The geothermal fluid contains up to 2.5 dm3 gas/100 dm3 of formation water and is dominated by nitrogen, a few percent methane and helium. The geothermal water from the production wells has a pH of 6.9, density of 1.030 kg/m3, chloride concentration of 2.6% and an iron content of 28 mg/l [3].
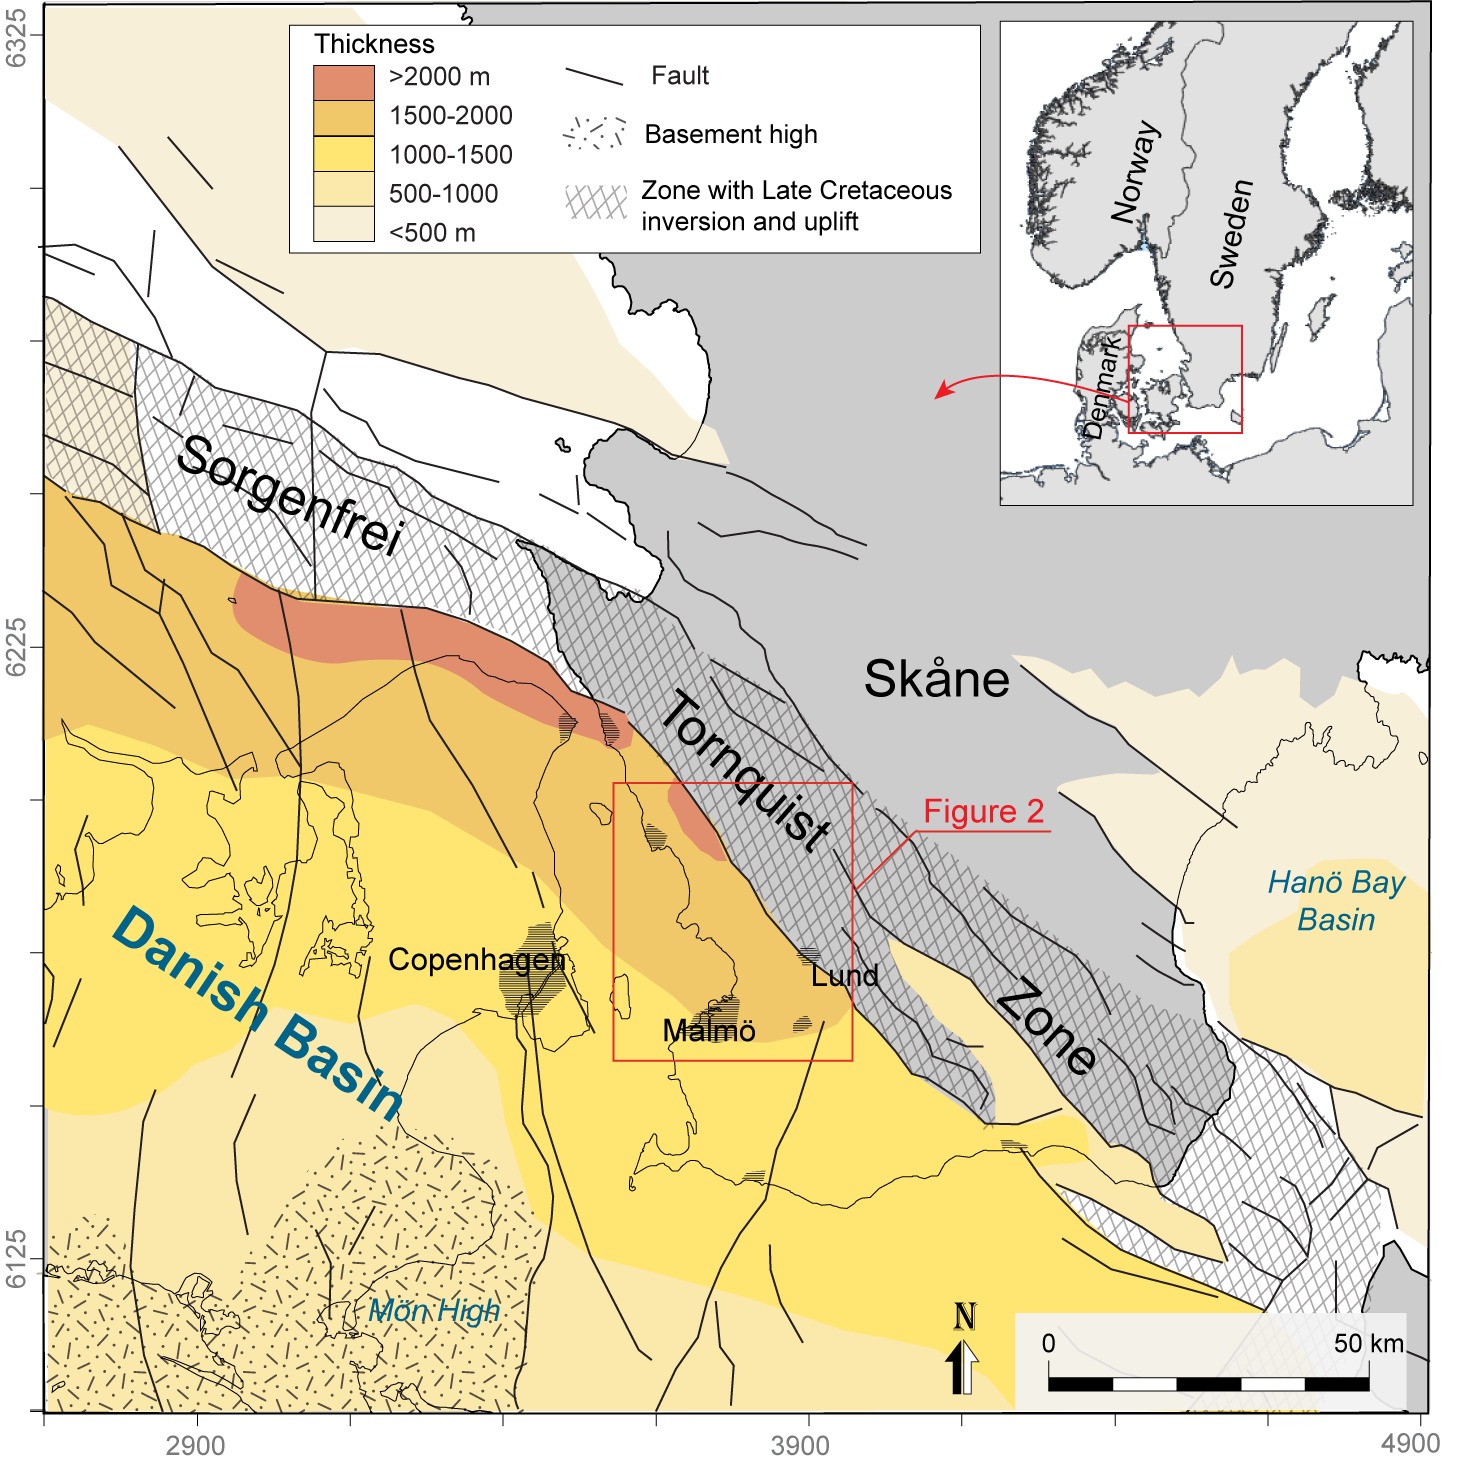
Figure 1: Location map with the main structural elements and gross thickness of the Upper Cretaceous, including the Lund Sandstone. Coordinates are given in the Swedish National Grid SWEREF99.

Figure 2: a) map showing the gross thickness of the Lund Sandstone, b) depth contour map of the top of the Lund sandstone.
2.2 The geothermal plant in Lund
The Lund geothermal plant includes four production and four (initially five) injection wells to depths between 654 and 768 metres below sea level. In addition, there are two observation wells including Flackarp-1 (Figure 3). The wells are completed with a 20” (508 mm) conductor casing to 25–75 m depth, sealing off the Quaternary deposits and the freshwater aquifers. The next section, drilled with a 17 ½” (445 mm) bit, is completed with a 13 3/8” (340 mm) casing cemented up to the surface. The reservoir was drilled with a 12 ¼” (311 mm) bit using a KCl polymer-based mud. The selected production interval was reamed to 15” (381 mm) before being completed with gravel pack, 7 5/8” (194 mm) (OD) stainless blanks and 6 5/8” (168 mm) (OD) wire wrapped screens. The uniformity coefficient Cu-value (d60/d10) of the formation sand is below 2.5 and therefore a gravel pack completion was chosen. The screen lengths vary between 61 and 147 m. The longer ones are in the injection wells, allowing a decrease of the injection pressure. The slot width is either 0.5 or 0.8 mm and the grain sizes of the gravel pack are either 0.7–1.2 mm or 1.0–1.7 mm.
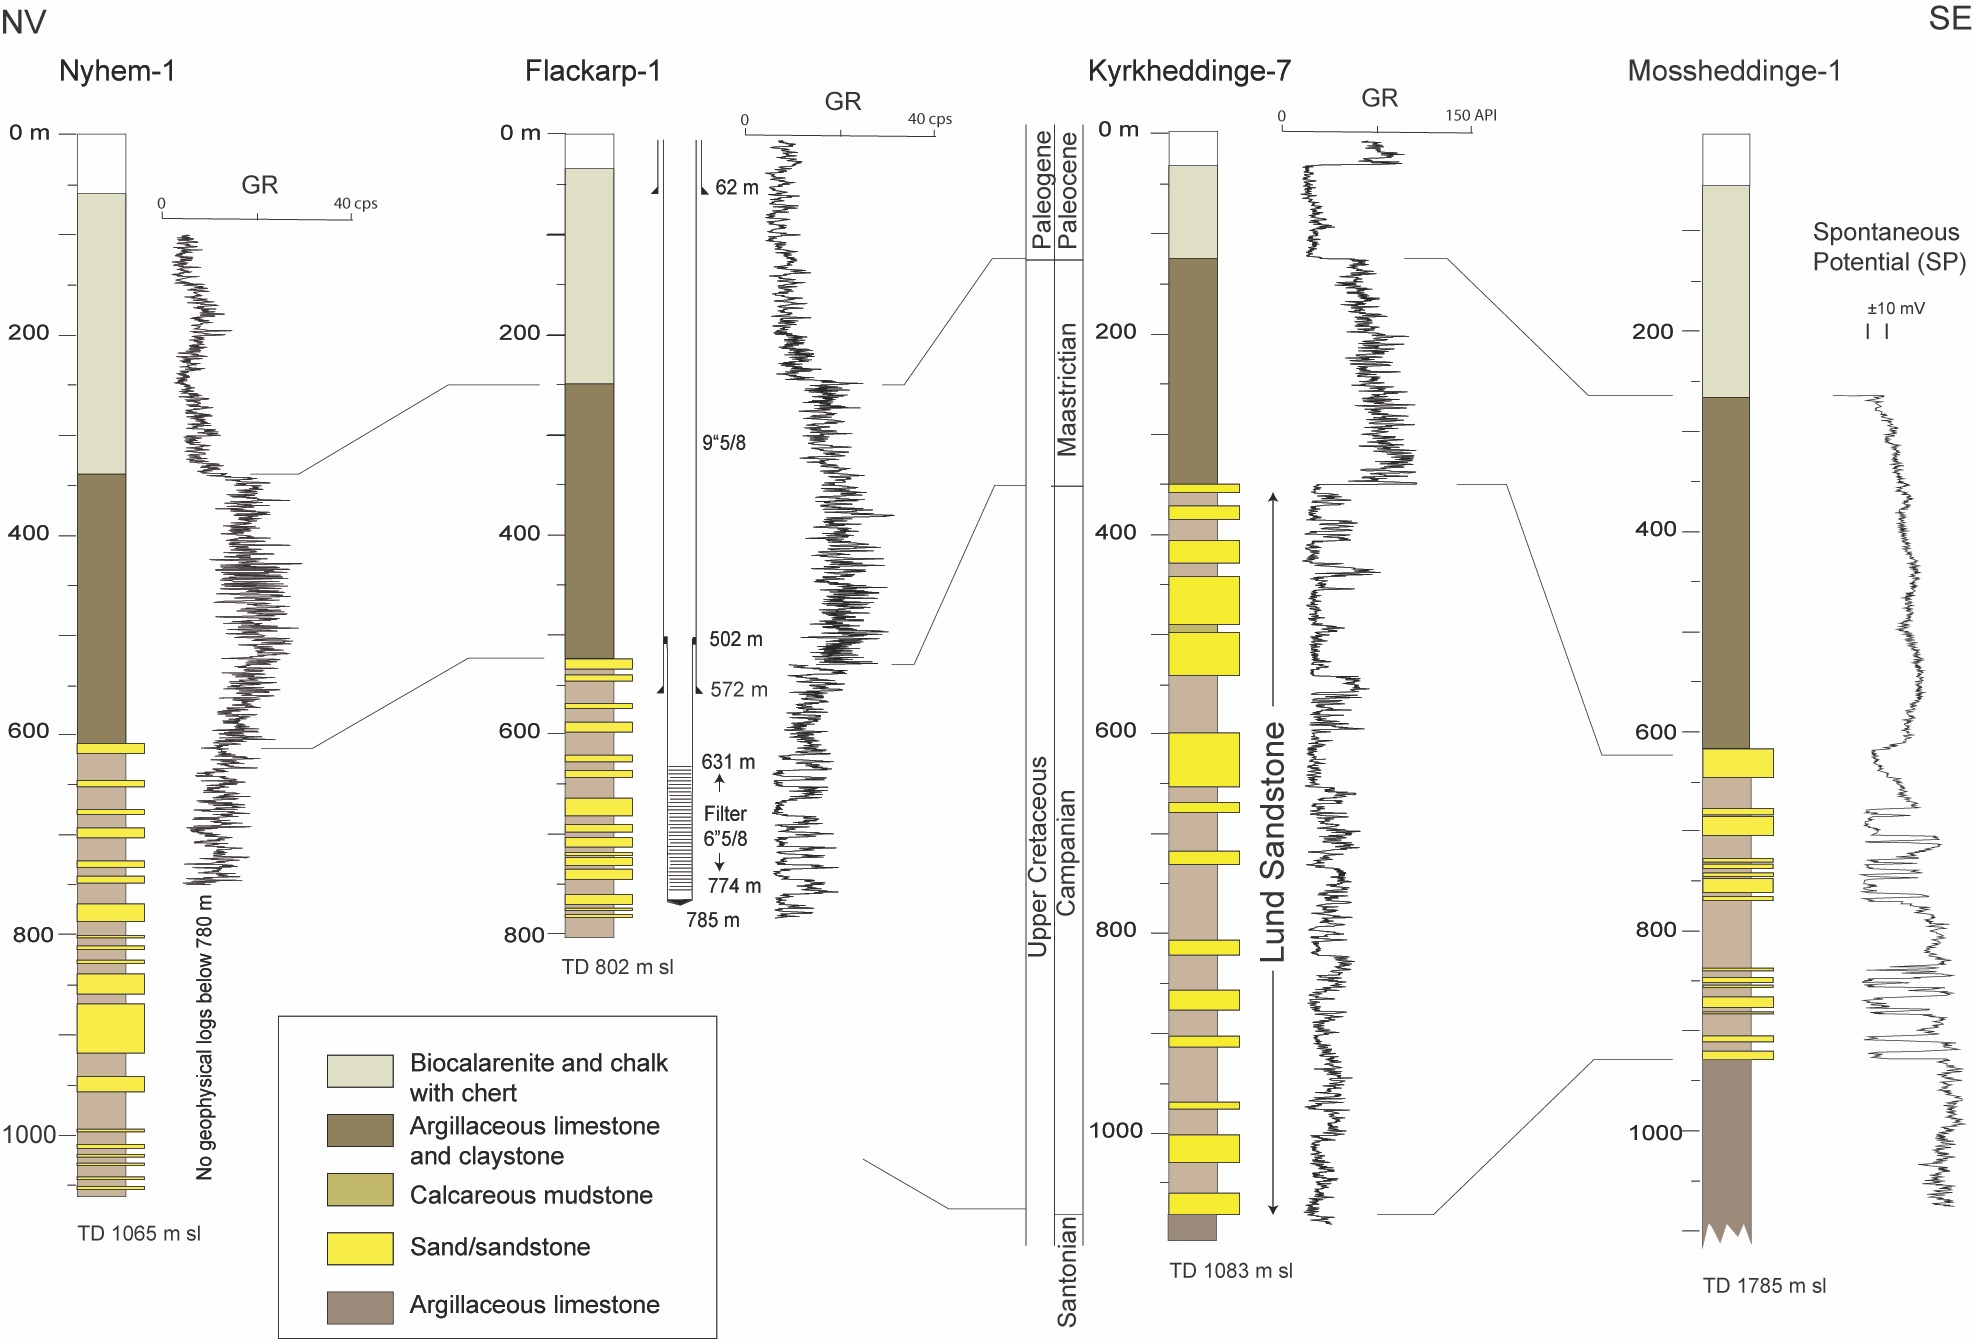
Figure 3: Examples of well log profiles within the studied area from the northwest to the southeast. The well locations are shown in Figure 2. The well design of producing interval in the Lund geothermal field is exemplified by the Flackarp-1 well.
A submersible pump (OD 290 mm) with a capacity of 120 l/s is mounted at the bottom of a production pipe (OD 200 mm) at c. 70 meters depth in the production wells. The distances between the production and injection wells vary between 1,310 and 2,350 m.
The geothermal plant is built on two ASEA STAL heat pumps with a maximum heat output of 21 MW and 27 MW. Two step-turbo compressors supporting the refrigerant have an inlet pressure of 16 bar, intermediate pressure of 25 bar and output pressure, after the compressor, of 40 bar. Each compressor is driven by an electrical motor rated to 6.5 and 9 MW respectively. The heat pumps initially contained 15- and 20-ton refrigerant R500, which was in 1995 substituted by R134a. The coefficient of performance is on average 3.5 [3].
Wells and heat pump plant are connected by a 4.2 km long system of fibreglass reinforced plastic tubes (600 mm OD) that resist a temperature of 35 °C and a pressure of 16 bar. The pipes are placed beneath ground at a depth of c. 1.5 m on a bed of quartz sand.
The geothermal plant has from the start operated 6,000–8,500 hours/year with an average flow of around 1,650 m3/h. However, the average production temperature has dropped from c. 21 °C to c. 19 °C due to a temperature decrease of 4–8 °C in two of the production wells (Figure 4a). The temperature drop is caused by relatively colder formation water moving from the injection wells towards the nearest production wells. The injection temperature varies between 4 and 7 °C. The decreasing production temperature has resulted in a declining amount of heat to the district heating, from 300–350 GWh/year to 100 GWh/year (Figure 4b). Before the drop in production temperature it contributed up to 45% of the district heating in the city of Lund. Besides the temperature decrease, the gradually decreasing share is also caused by increasing competition from other heat resources to the district heating, as well as an increasing number of stops due to maintenance of the aging system.
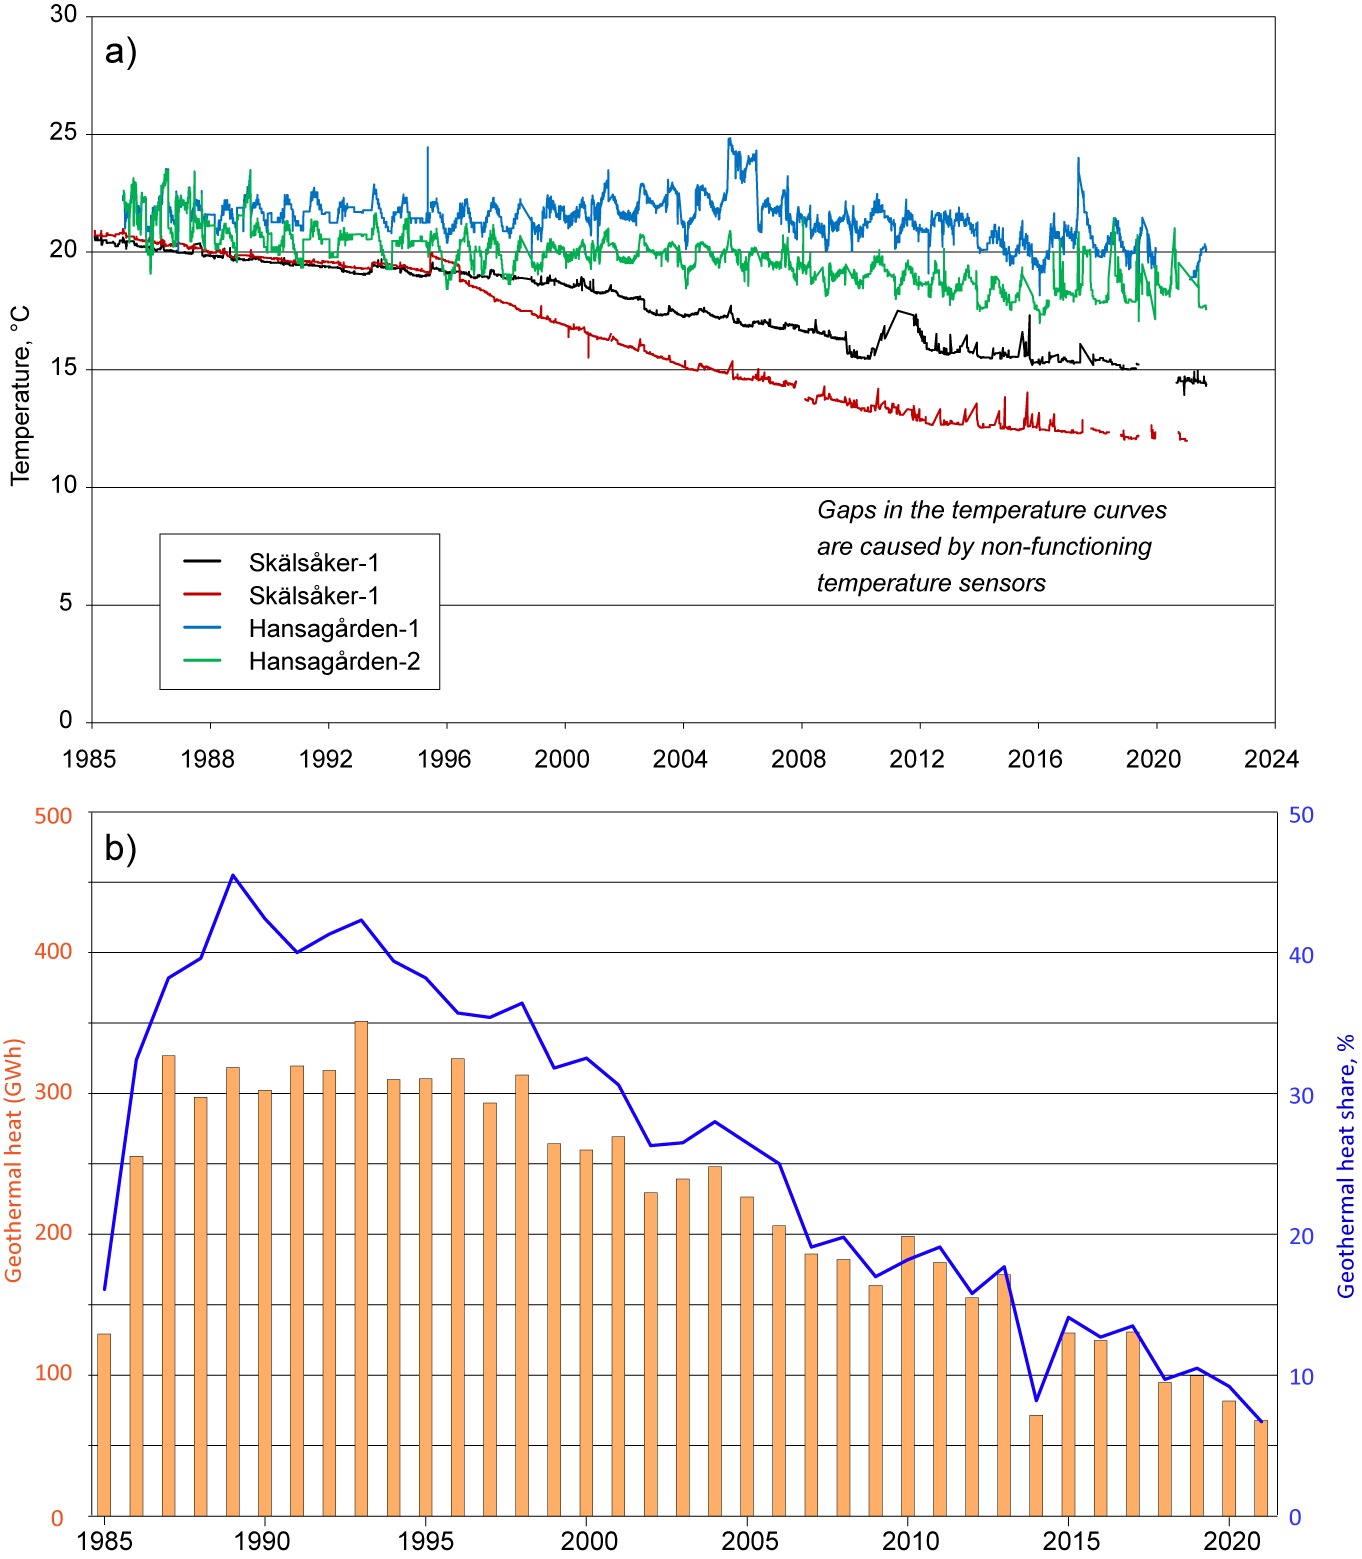
`Figure 4: a) graphs showing the temperature decrease with time in the four production wells. Note that the temperature decrease is greatest in Skälsåker-1 and -2, which are the two wells located closest (c. 1,310 m) to the injection wells, b) composite graph illustrating the amount of geothermal energy coming from the geothermal plant in Lund and its share of the total heat demand in the Lund district heating system.
A recurring problem is that the injection pressure gradually increases during operation. This has been mitigated by regular airlifting operations to reactivate and stimulate the gravel pack. Despite the airlifting, the increase of the injection pressure enforced a coiled-tubing hydro jetting operation in 2012–2013 to remove fines, scaling and clogging. This successful operation resulted in regained injection flow rates in all wells. However, the most troublesome concern today is the integrity of the old wells. Well inspections with wire-line logging tools, such as Video, Caliper, flow meter and temperature, have been performed on several occasions. One injection well has been abandoned due to a collapsed casing. It is noteworthy that the casing intervals in front of the pump locations have had to be repaired due to abrasion.
Furthermore, the change in refrigerant in 1994 and 1995 resulted in a slight decrease in output effect of the heat pumps. Within the coming years, the currently used R134a refrigerant must be replaced, due to new regulations. One alternative is to replace the R134a with a R-1234ze refrigerant. However, this will lead to an additional 20% reduction. This is still a critical issue regarding the future operation of the Lund geothermal system. Although the Lund geothermal system has proven to operate far better than initial expectations, it is still uncertain whether any new wells will be drilled, primarily because of the competition from other energy sources, such as heat from incineration of waste and biomass.
3. Methodology
The most widely used method for geothermal resource assessments is calculating the maximum theoretically extractable heat in an aquifer (HIP) [21]. We have here applied a method initially developed by the United States Geological Survey [22] which is suited for low temperature aquifers like the Lund Sandstone. It also used for the assessments given in the European Geothermal Atlas [23] and concluded to be the most useful tool for evaluating geothermal reservoirs at an early stage of development [22]. This method, also known as the volumetric method, gives a simplistic estimate based on relatively few input parameters [22,24]. Basically, the HIP is calculated as the theoretical amount of thermal energy stored in a volume of a reservoir rock, under homogeneous conditions regarding porosity, density, heat capacity and temperature gradients.
The first step in our study was to define the volume by constructing depth maps for the top (Figure 2b) and base of the Lund Sandstone. From this the gross thickness (Figure 2a) and volume of the reservoir is given. The temperature to the top of the reservoir is calculated from a uniform gradient of 2.5 °C/100 m and a mean surface temperature of 8 °C. The net sand share is assessed to decrease step-wise from 60% where the gross thickness is >500 m to 20% in the outer parts of the studied area, where the gross thickness is <150 m. Similarly, a decrease in porosity from 25% to 15% was assessed in the calculations from northeast to southwest. Most of the work was performed by using the ArcGIS software.
CA = Ø × ρw × Cw + (1 – Ø)ρs × Cs (1)
HIP = VA × CA × (TR – Tinj) (2)
HSP = VA × CA × (Tinj – TR)Fr × Fp (3)
Our calculations using the volumetric method, defined by equations (1) and (2), are mainly based on parameters and values exemplified in Table 1. The values come from well data in the Lund and Kyrkheddinge area (Figure 2a, b and Figure 5) [8]. The specific heat capacity of the formation water is set to 4,180 J/kg°C, corresponding to fresh water, for reasons of simplification. In reality, a slightly lower but unknown value could be expected due to a slightly saline formation water. The specific heat capacity of the rock matrix (Cs) is set to 800 J/kg°C [25].
In addition, following the workflow presented by [10], the heat storage potential (HSP) is calculated using equation (3). The effective storage volume is also considered to be half of the total, which is further reduced by compression packing (Fp) and recovery (Fr) factors [26–28]. In this case we use Fp=0.8 and Fr=0.7, like the models used for the North German Basin study by [17].
The actual amount of heat that can be extracted from the reservoir depends on a recovery factor. This factor is for a production-reinjection doublet defined by Lavigne to be 0.33 [29]. This definition is also widely used in other assessments [9–11]. The fraction (R0) of extractable amount of heat also depends on a reference surface temperature (T0), production temperature (T) and the reinjection temperature (Tinj) according to equation (4).
R0=0.33 × (T-Tinj) / (T-T0) (4)
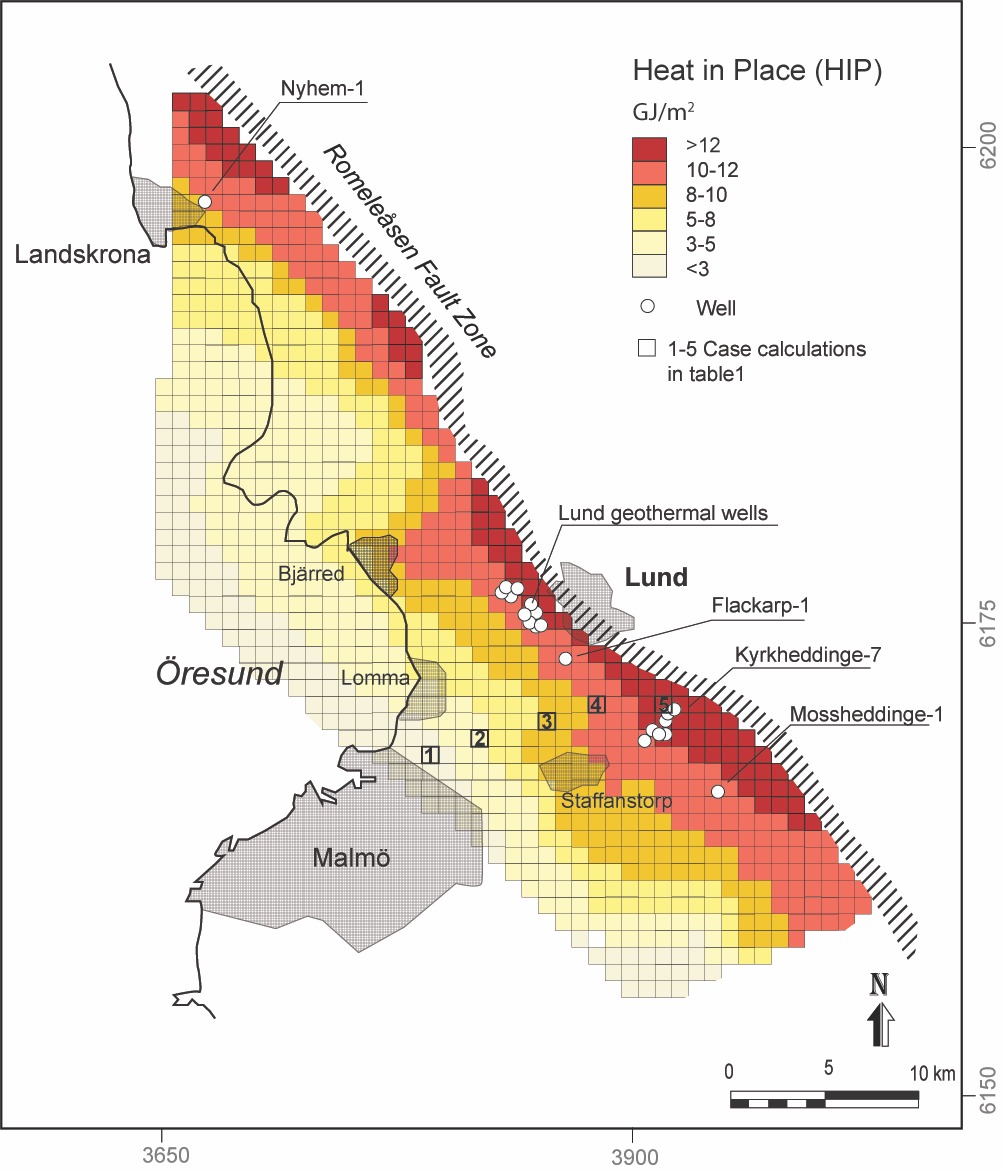
Figure 5: Schematic map of the estimated heat-in-place (HIP, GJ/m2) reserves in the Lund Sandstone.
4. Results and discussion
Using equation (1) gives a volumetric heat capacity (CA) of 2.43–2.65 MJ/m3°C, which fall within the range of typical sandstone values [30]. The HIP, calculated for one-square-kilometre large blocks, using equation (2), ranges between 1.5 and 13.4 GJ/m2. Sample calculations are shown for five locations (cases 1–5) with various reservoir properties related to increasing distance from the bounding Romeleåsen Fault Zone, with corresponding step-wise reduced reservoir properties such as gross thickness, net sand share and porosity (Table 1, Figure 5).
The main part of the studied area, i.e., where the top of the reservoir is deeper than 400 m, the net sand >100 m and the temperature >20 °C, have HIP values above 8 GJ/m2. This is significantly higher than for a Lower Cretaceous reservoir in the Lisbon region (3.8 GJ/m2) [12] and for Mesozoic reservoirs in the North German Basin [10] but in the same range as the geothermal reservoirs in the Paris Basin (7.0 GJ/m2) [31]. HIP values ranging between 3 and 10 GJ/m2 are also mentioned for Triassic and Jurassic reservoirs with temperatures of 45–80 °C in the Danish Basin in Denmark [9]. Considering 5–8 GJ/m2 for the main part of our studied area, this will add up to a conservative estimated HIP reserve of 1,000–1,600 PJ. Since the injection temperature in the Lund case is similar or commonly lower than the reference surface temperature, this means that the extractable heat will be about 1/3 of the calculated HIP values.
Considering a rough estimate for the heat consumption in the district heating systems of 4 PJ/year for the urban areas of Landskrona, Lund, Staffanstorp, Bjärred and Lomma [32], we find that the reserves could provide geothermal heat to these systems for several hundred years. We should note that the HIP calculations have not considered the replenishment of heat by conduction from layers above and below. Even if this factor has greater impact on deeper and thinner reservoirs and moderate production rates, it should be further evaluated for the Lund Sandstone.
The HSP is in our case based on a 20 m thick homogeneous sandstone interval, with an effective porosity of 25% and a formation temperature of 20 °C. The heat is stored at an injection temperature of 90 °C. This gives a HSP value of 1.0 GJ/m2 in our case. This is slightly higher than the high-end values for the Keuper reservoirs in the North German Basin [10]. Thus, considering the favourable depth, which brings down the cost of drilling, and good reservoir properties, the aquifer thermal energy storage (ATES) potential in the Lund Sandstone is considerable.
Table 1: Input parameters for the different case calculations of heat-in-place (HIP) and heat storage potential (HSP). The cases exemplify the range of energy present at various locations where depth, gross thickness, net sand, porosity, and temperature of the Lund Sandstone reservoir differs. The locations are shown in Figure 5.
| Parameter | Case 1 | Case 2 | Case 3 | Case 4 | Case 5 | ||
| Minimum depth | dmin | m | 650 | 500 | 450 | 400 | 350 |
| Maximum depth | dmax | m | 800 | 850 | 850 | 900 | 1,050 |
| Gross thickness | hg | m | 150 | 350 | 400 | 500 | 700 |
| Net sand | hn | m | 30 | 100 | 200 | 300 | 400 |
| Surface area | A | m2 | 1.0E+06 | 1.0E+06 | 1.0E+06 | 1.0E+06 | 1.0E+06 |
| Effective porosity | Ø | % | 0.15 | 0.20 | 0.20 | 0.25 | 0.25 |
| Effective reservoir volume | VA | m3 | 3.0E+07 | 1.0E+08 | 2.0E+08 | 3.0E+08 | 4.0E+08 |
| Top reservoir temperature | TR | °C | 24 | 21 | 19 | 18 | 17 |
| Injection temperature | Tinj | °C | 4 | 4 | 4 | 4 | 4 |
| Density water | ρw | kg/m3 | 1,030 | 1,030 | 1,030 | 1,030 | 1,030 |
| Density matrix | ρs | kg/m3 | 2,620 | 2,620 | 2,620 | 2,620 | 2,600 |
| Specific heat capacity water | Cw | J/kg°C | 4,180 | 4,180 | 4,180 | 4,180 | 4,180 |
| Specific heat capacity solids | Cs | J/kg°C | 800 | 800 | 800 | 800 | 800 |
| Volumetric heat capacity | CA | MJ/m3°C | 2.43 | 2.54 | 2.54 | 2.65 | 2.65 |
| Heat in place | HIP | GJ/m2 | 1.5 | 4.2 | 7.7 | 11.1 | 13.4 |
5. Conclusions
The Lund Sandstone is here assessed as a substantial geothermal resource in SW Skåne, southernmost Sweden. Our estimates give that the heat in place is commonly around 8 GJ/m2 within an area of 200 km2. This corresponds to several hundred years of consumption in the local district heating systems, supporting five urban areas and about 300,000 inhabitants.
So far, the resource has only been exploited in the city of Lund, where since 1985 it has provided several hundred GWh heat yearly to the district heating system. Beyond expectations, the geothermal plant is still operating, but with a decreasing capacity due to gradually less well functioning wells and increasing temperature interference. Despite over 37 years of successful operation and environmental benefits, this resource is largely an untapped and poorly recognised heat and storage resource in the region. Our calculations show a high heat storage capacity of 1.0 GJ/m2, a relatively shallow target depth, high porosity and permeability, homogeneity, and a formation of temperature of around 20 °C, which is especially advantageous for storage.
Unfortunately, further exploration has been essentially neglected because of a lack of awareness and due to competition from and pricing of other energy sources. However, it is hoped that highlighting the magnitude of the heat reserve and the storage potential will foster further exploration and use of the resource, provided there are feasible competitive technical solutions for its future utilisation.
Author Contributions: Conceptualisation and methodology, M.E. and J.-E.R.; formal analysis, M.E. and J.-E.R.; writing—original draft preparation, M.E.; writing—review and editing, M.E. and J.-E.R.; illustrations, M.E. and J.-E.R. Both authors have read and agreed to the published version of the manuscript.
Funding: This research received no external funding.
Acknowledgments: Kraftringen AB power company and Peter Ottosson are thanked for letting us use the operational data on the geothermal plant in Lund.
Conflicts of Interest: The authors declare no conflict of interest.
References
- Alm, P-G.; Bjelm, L. Geothermal energy in Scania: a summary of research activities and results within the national program for geothermal energy in sedimentary rocks 1977–1994: NUTEK Project 656-090-3. Lund Institute of Technology. Department of Engineering Geology 1995, 81 pp.
- Alm, P-G. Longtime study of geothermal data from a low enthalpy geothermal heat plant. Twenty-Fourth Workshop on Geothermal Engineering. Stanford University, California 1999, 6 pp.
- Ottosson, P. District Heating Production with Heat Pumps based on Geothermal Energy. World Geothermal Congress. Antalaya, Turkey 2005, 8 pp.
- Bjelm, L.; Alm, P.-G. Reservoir Cooling After 25 Years of Heat Production in the Lund Geothermal Heat Pump Project. World Geothermal Congress. Bali, Indonesia 2010, 5 pp.
- Axelsson, G. Sustainable geothermal utilization – Case histories; definitions; research issues and modelling. Geothermics 2010, 39, 283–291.
- Bjelm, L.; Lindeberg, L. Long-term experience from a heat pump plant in Lund, Sweden, using a low-temperature geothermal aquifer. World Geothermal Congress Florence, Italy 1995, 2173–2176.
- Lehmets, M.; Alm, P.-G.; Olsson, R. Sweden. In S. Hurter and R. Huenel (eds) Atlas of Geothermal Resources in Europe. Publication No. EUR 17811 of the European Commission. Office for Official Publications of the European Communities, 2002, 57–58.
- Erlström, M.; Alm, P.-G.; Rosberg, J.E.; Ask, M. Infrastructure for cap-rock studies. Lund University, Faculty of Engineering, LTH. Swedish Research Council. Dnr: 826-2011-5976. 2014, 40 pp.
- Balling, N.; Major, M.; Fuchs, S.; Mathiesen, A.; Møller Nielsen, C.; Mejer Hansen, T.; Kristensen, L.; Förster, F. Geothermal reservoirs in the Danish area: temperatures, resources, and models for long-term energy extraction. Scientific report, Department of Geoscience, Aarhus University 2019, 68 pp
- Frick, M.; Kranz, S.; Norden, B.; Bruhn, D.; Fuchs, S. Geothermal Resources and ATES Potential of Mesozoic Reservoirs in the North German Basin. Energies 2022, 15, doi.org/10.3390/en15061980.
- Agemar, T.; Weber, J.; Moeck, I. Assessment and Public Reporting of Geothermal Resources in Germany: Review and Outlook. Energies 2018, 11, 332. DOI: https://doi.org/10.3390/en11020332
- Marrero-Diaz, R.; Ramalho, E.; Costa, A.; Ribeiro, L.; Carvalho, J.; Pinto, C.; Rosa, D.; Correia, A. Updated Geothermal Assessment of Lower Cretaceous Aquifer in Lisbon Region, Portugal. Proceeding World Geothermal Congress 2015, Melbourne Australia 19–25 April.
- Energy Storage Mapping and Planning. https://estmap.eu/home, (accessed 2 September 2022).
- Aldenius, E. Subsurface characterization of the Lund Sandstone – 3D model of the sandstone reservoir and evaluation of the geoenergy storage potential, SW Skåne, south Sweden. Dissertations in Geology at Lund University 572 2019, 39 pp.
- DG ENERG. https://ec.europa.eu/info/strategy/priorities-2019-2024/european-green-deal/energy-and-green-deal, (accessed September 2nd 2022).
- Geological Survey of Europe. (https://www.eurogeosurveys.org/gseu/ accessed October 13th 2022).
- European Commission. European Green Deal. https://climate.ec.europa.eu/eu-action/european-green-deal_en#european-green-deal (accessed October 13th 2022).
- Erlström, M. Petrology and deposition of the Lund Sandstone, Upper Cretaceous, southwestern Scania. Sveriges Geologiska Undersökning Forskningsrapporter 1990, Ca 74, 91 pp.
- Erlström, M. Evolution of Cretaceous sedimentation in Scania. Lund Publications in Geology 1994, 122, 37 pp.
- Sivhed, U.; Wikman, H.; Erlström, M. Beskrivning till berggrundkartorna 1C Trelleborg NV och NO samt 2C Malmö SV, SO, NV och NO. (Description of the bedrock maps 1C Trelleborg NW, NE, 2C Malmö SW, SE, NW and NE). Sveriges geologiska undersökning (Geological Survey of Sweden) 1999, Af 191–194, 196 and 198, 143 pp. (in Swedish with an English summary).
- Ciriaco, A.E.; Zarrouk, S.J.; Zakeri, G. Geothermal resource and reserve assessment methodology: Overview, analysis, and future directions. Renew. Sustain. Energy Review 2020, 119, 109515.
- Muffler, P.; Cataldi, R. Methods for Regional Assessment of Geothermal Resources. Geothermics 1978, 7, 53–89, doi.org/10.1016/0375-6505(78)90002-0.
- Hurter, S.; Haenel, R. (eds), Atlas of geothermal resources in Europe. European Commission, Directorate-General for Research and Innovation. Publications Office 2002, 270 pp.
- Garg, S.K.; Combs, J. A Reformulation of USGS Volumetric “Heat in Place” Resource Estimation Method. Geothermics 2019, 55, 150–158, doi.org/10.1016/j.geothermics.2015.02.004.
- Robertsson, E.C. Thermal properties of rocks. United States Department of the Interior Geological Survey Open-File Report 1988, 441, 106 pp.
- Kunkel, C.; Agemar, T.; Stober, I. Geothermal potential of the Buntsandstein and Keuper aquifers in NE Bavaria with a focus on deep thermal aquifer storage. Grundwasser 2019, 24, 251–267, doi:10.1007/s00767-019-00430-1.
- Wang, Y.; Voskov, D.; Khait, M.; Saeid, S.; Bruhn, D. Influential factors on the development of a low-enthalpy geothermal reservoir: A sensitivity study of a realistic field. Renewable Energy 2021, 179, 641–651, doi:10.1016/j.renene.2021.07.017.
- de Bruijn, E.A.M.; Bloemendal, M.; ter Borgh, M.M.; Godderij, R.R.G.G.; Vossepoel, F.C. Quantifying the contribution of heat recharge from confining layers to geothermal resources. Geothermics 2021, 93, 102072, doi:10.1016/j.geothermics.2021.102072.
- Lavigne, J. Les ressources géothermiques françaises. Possibilités de mise en valeur. (Geothermal resources in France – development opportunities). Annales Des Mines 1978, 184, 57–72.
- Pahud, D. Geothermal Energy and Heat Storage. Laboratorio di Energia, Ecologia ed Economia, Canobbio 2002.
- Lopez, S.; Hamm, V.; Le Brun, M.; Schaper, L.; Boissier, F.; Cotiche, C.; Giuglaris, E. 40 years of Dogger aquifer management in Ile-de-France, Paris Basin, France, Geothermics 2010, 39, 339–356, doi:10.1016/j.geothermics.2010.09.005.
- Ottosson, P. (Kraftringen AB, Lund, Sweden). Personal communication, 2022.
This article has been published in European Geologist Journal 54 – Geothermal energy – A geological contribution to the energy transition
Read here the full issue: