
Bitcoin and the three altcoins are in a downward correction. All the cryptos made brief upward move but the uptrend was short-lived. This is because of the overwhelming selling pressure of the cryptocurrency market.
BTC/USD Major Trend: Bearish
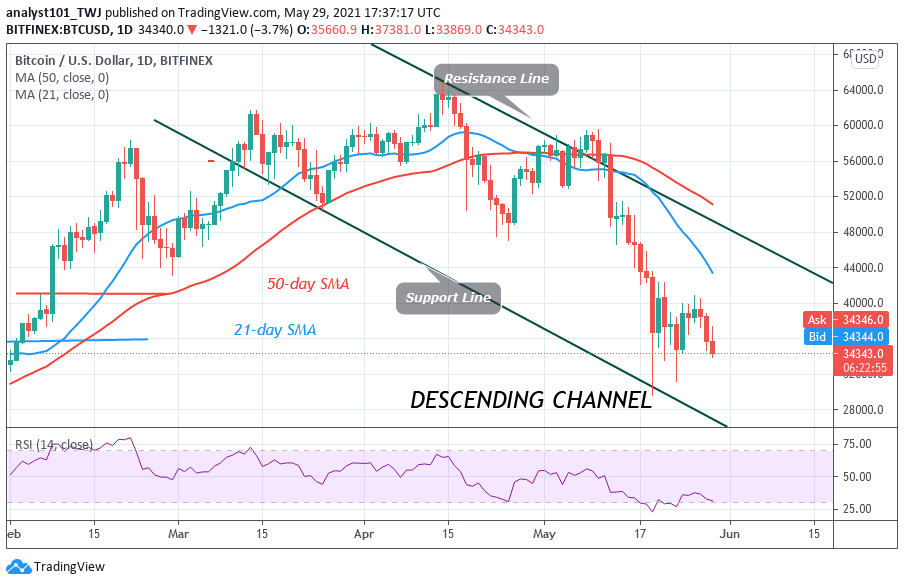
BTC/USD has fallen to $34,206 at the time of writing. The current downtrend was caused by the bull’s failure to break the $40,000 resistance level. BTC price has an initial fall to $35,000 support twice. The crypto corrected upward but the uptrend was stalled at $37,000 high. For two days, Bitcoin was in a downward correction between $35,000 and $37,000. However, the bears broke the $35,000 support to resume the downward move. As the selling pressure resumes, Bitcoin is likely to revisit the $30,000 support.
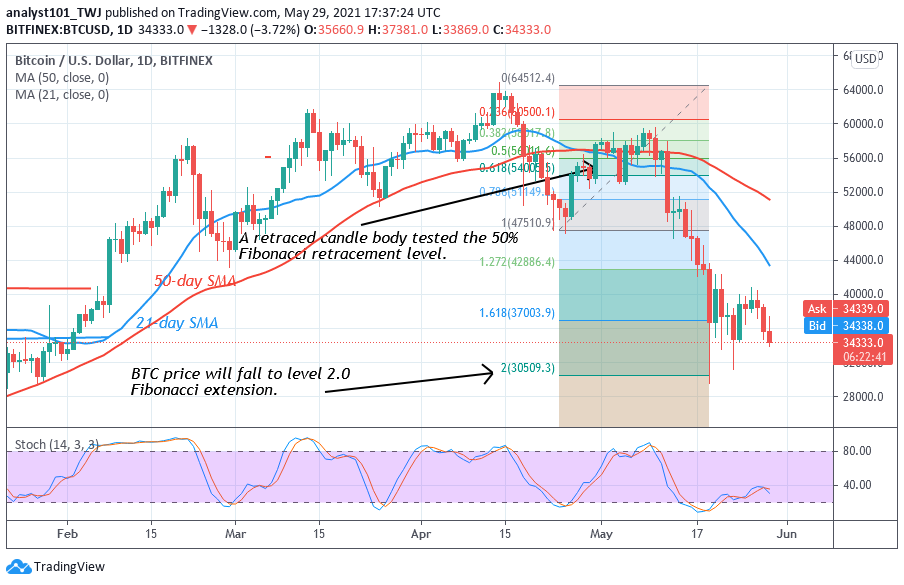
Meanwhile, the price indicator has indicated a possible downward move to the previous low at $30,000. On April 25 downtrend, a retraced candle body tested the 50% Fibonacci retracement level. The retracement indicates that Bitcoin will fall to level 2.0 Fibonacci extension or level $30,509.30. On May 19, Bitcoin tested the $30,000 support and pulled back. Today, the market is falling to revisit the previous low.
DOT/USD Major Trend: Bearish
Polkadot has resumed a fresh downward move as the altcoin faced rejection at the $25 high. On the downside, if the bearish momentum is sustained, DOT will fall and revisit the previous low $$13.73. From the previous price action, the altcoin faced its initial rejection from the high of $49.80.In the first downtrend, the bears succeeded in sinking the coin to the low of $16 twice.

The bulls bought the dips to push the altcoin above the $32 high. In the second downtrend, on May .23, the altcoin slumped to $13.73 and pulled back. The pulled back has been repelled at the $25 high as the market resumed its downward move. On May 19 downtrend; a retraced candle body tested the 78.6% Fibonacci retracement level. The retracement indicates that DOT will fall to level 1.272 Fibonacci extension or level $7.24.
LTC /USD Major Trend: Bearish
For the past week, Litecoin has been in a downward correction after falling to the low of $120. On May 19, LTC/USD dropped to $144 low and resumed a downward move. LTC price corrected up to $200 and resumed range-bound move between $120 and $200. Buyers have attempted to push the coin above the $200 high but were repelled.
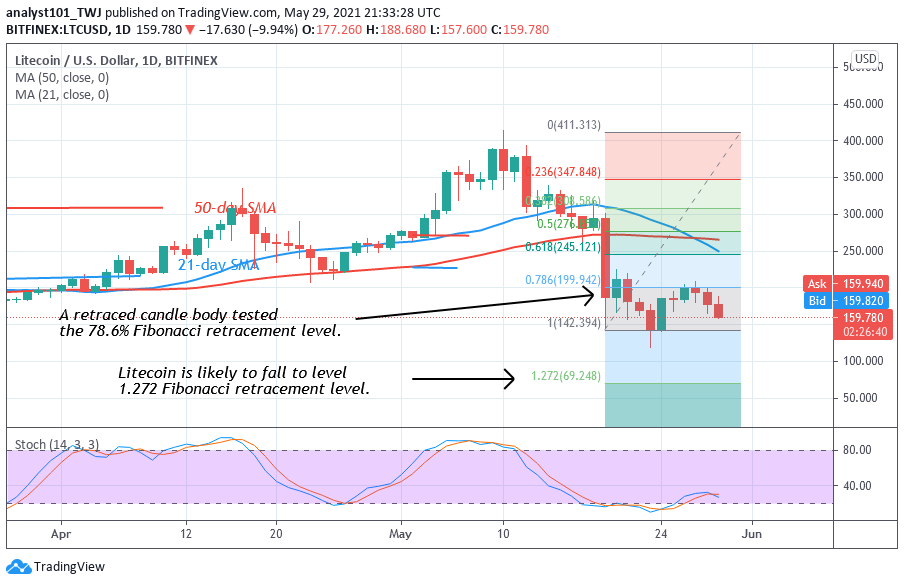
However, if sellers succeed in breaking below the $120 support, the selling pressure will resume. The market will decline to the low of $80. On May 19 downtrend; a retraced candle body tested the 78.6% Fibonacci retracement level. The retracement indicates that Litecoin is likely to fall to level 1.272 Fibonacci retracement or level $69.24.
LINK /USD Major Trend: Bearish
Chainlink has continued its bearish run as the altcoin faces rejection at the $35 high. The downtrend resumed after the bulls retested the recent high. Chainlink’s uptrend was short-lived as price dropped from $35 to $28 low. However, buyers defended the support for two days before it was breached.
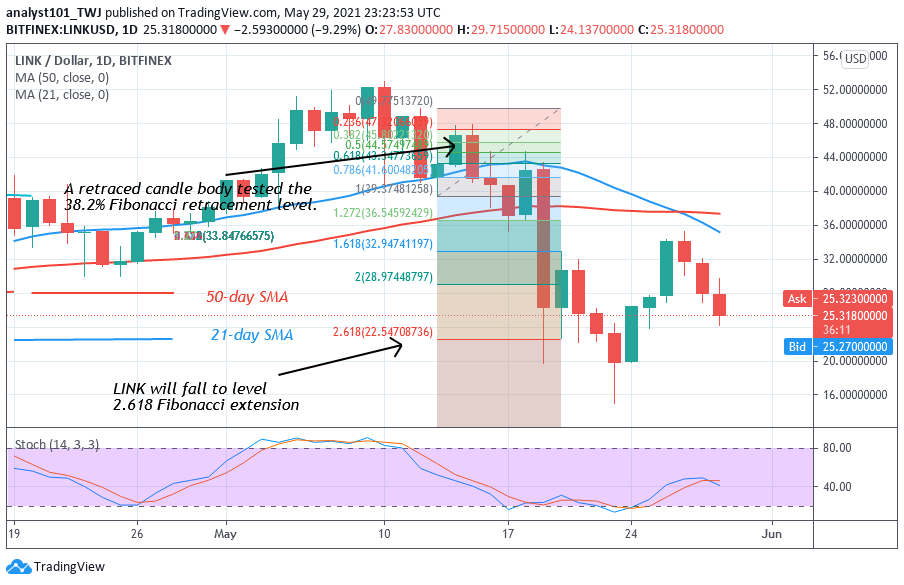
Sellers are most likely to revisit the previous low at $24 as price falls. The selling will resume when the bears break the $24 support, the market will decline to the previous low at $15.04. Presently, the LINK price is trading at $25.48 at the time of writing.On May 13 down, a retraced candle body tested the 38.2% Fibonacci retracement level. The retracement indicates that the LINK price will fall to level 2.618 Fibonacci extension.