South Carolina has important regulations to protect and conserve its water resources. This article should provide producers with a better understanding of state water quantity regulations that potentially impact their operation, estimating their farm water use, and helping them avoid possible penalties. The flowcharts and tables included assist producers in understanding relevant regulations and for estimating water usage.
Introduction
On average, South Carolina experiences between forty-five to fifty-five inches of rainfall annually.1 Even with such abundant rainfall, the state will still sustain dry periods with sporadic rainfall, especially during the summer months. During these times, agricultural producers may rely on irrigation to maintain adequate soil moisture and promote crop growth. Depending on the amount of water applied, surface water or groundwater users can strain the state’s water resources. Beginning in 1962, concerns of overuse and resource degradation led to a legislative declaration of state water regulation policy. The declaration states, “The General Assembly declares that the general welfare and public interest require that the groundwater resources of the State be put to beneficial use to the fullest extent to which they are capable, subject to reasonable regulation, in order to conserve and protect these resources, prevent waste, and to provide and maintain conditions which are conducive to the development and use of water resources,” and gave regulating authority to the SC Department of Health and Environmental Control (SCDHEC).2 Since this declaration, the state has enacted several regulations to promote wiser water use. These regulations have a broad impact, and proper understanding of the regulation scope and framework can help agricultural water users make sure they are within compliance with the regulations.
Background
Water use in South Carolina is an important and complex issue. Currently, the primary consumptive water uses by volume include residential, power production, and irrigation. SCDHEC separates the primary consumptive uses into the following categories:
- Aquaculture
- Golf course irrigation
- Hydroelectric power production
- Industrial uses
- Agricultural irrigation
- Mining
- Nuclear power production
- Thermoelectric power production
- General water supply use3
Since enacting the 1962 Groundwater Use Reporting Act, South Carolina’s first water quantity regulation, the state has continually strengthened water resource conservation efforts. Protecting and conserving the state’s water resources ensures environmental and economic benefits such as ecosystem resilience, a quality drinking water supply, and tourism.
Any agriculture water user in South Carolina withdrawing more than three million gallons in any single month (> 3 MGM) is required to either register the withdrawal or obtain a permit, depending on the operation’s geographic location and whether the withdrawal is from a surface water or groundwater source.3
A significant volume of the state’s water use results from agricultural irrigation and comes from ground and surface water withdrawals. Most producers use a center pivot, traveling gun, linear move, or similar irrigation systems. According to the 2018 SCDHEC Water Use Report, agricultural irrigation use exceeded 54 billion gallons for the reporting period and accounted for 14% of the state’s total reported water use (power production excluded) (figure 1).3
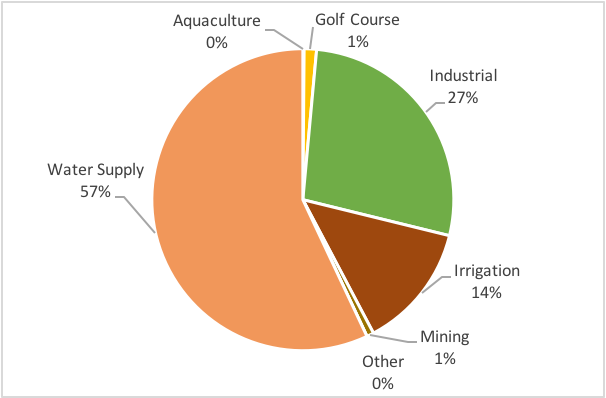
Figure 1. South Carolina reported consumptive water use for 2018 (power production not included).3 Image credit: Ethan Barnette, Clemson University.
Additionally, both the volume and the number of reporting facilities withdrawing water for agricultural irrigation purposes have increased over the last five years (figure 2). The growth in the number of registered agricultural water users includes an increase of 46.7% for groundwater withdrawals and 6.5% for surface water withdrawals.3,4
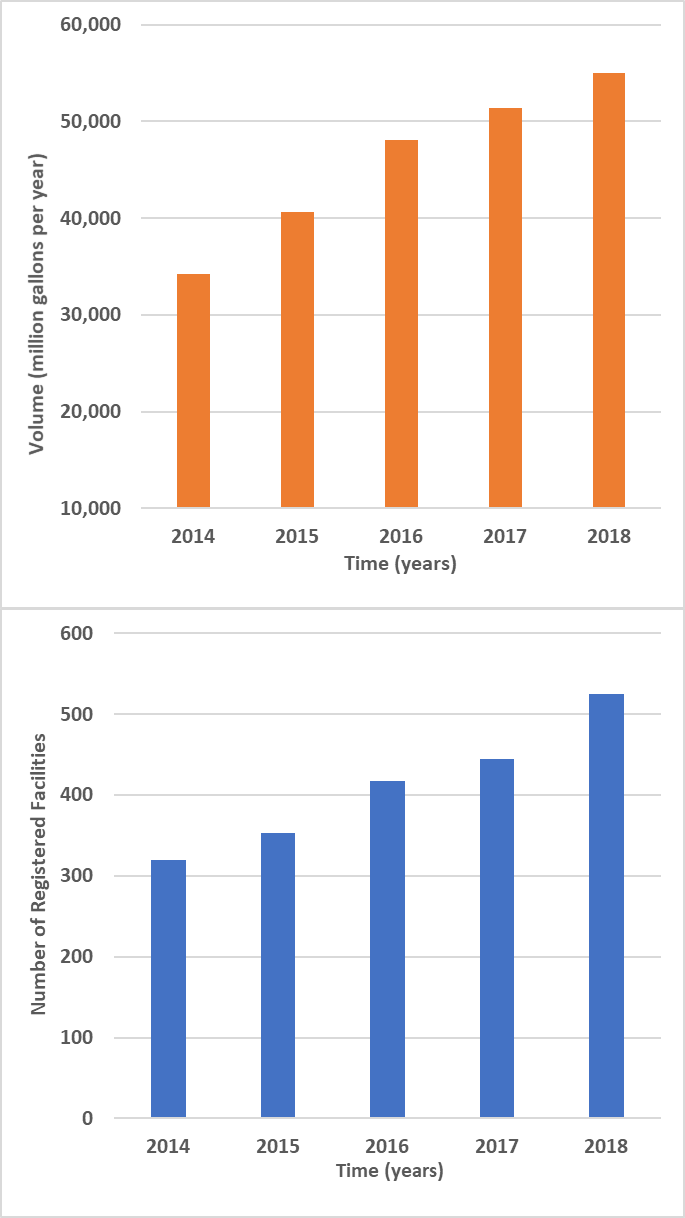
Figure 2. Agricultural irrigation water use trend from 2014–2018 for (top) the volume of water used for agricultural purposes and (bottom) the number of agricultural facilities withdrawing water.3-7 Image credit: Ethan Barnette, Clemson University.
Regulatory Environment
Groundwater Regulations
Groundwater withdrawal capacity varies throughout the state and is largely based on underlying soil composition. Soils in the Piedmont tend to be less permeable, contain underlying bedrock, and require finding fractures in the bedrock to access larger volumes of groundwater easily. Such soil conditions generally make Southern Piedmont soils unsuitable for high capacity wells. Soils of the Midlands and Coastal Plain of the state (such as Meggett, Rains, and Norfolk) have higher permeability since they are typically comprised of a higher percentage of sand.8 The Midlands and Upper Coastal Plain regions are typically characterized by shallower, more accessible underlying aquifers that contain little bedrock, making them more suitable for high capacity wells. The common factor separating these areas is the state’s fall line. This line signifies the geologic shift in soil types from the Piedmont region to the Coastal Plain region and runs southwest to northeast, approximately following Interstate Twenty (I-20). An approximation of the fall line overlaid on figure 3 provides a visual representation of where geologic change occurs. The necessity to obtain a withdrawal permit or register use will depend on both the well’s geographic location and volume of monthly use. Groundwater in South Carolina is regulated through areas designated as “capacity use” (figure 3). According to SCDHEC, a Capacity Use Area is “an area where excessive groundwater withdrawal presents potential adverse effects to the natural resource or poses a threat to public health, safety, or economic welfare or where conditions pose a significant threat to the long-term integrity of a groundwater source, including saltwater intrusion.”9 The Board of SCDHEC creates a Capacity Use Area in a region of the state where groundwater withdrawal volume is large and without monitoring and regulation, the groundwater resources have a high potential to become degraded and their use unsustainable. If a user plans to withdraw more than 3 MGM of groundwater in a capacity use area, they must apply for and obtain a groundwater withdrawal permit from SCDHEC.9 The full registration and permitting process is detailed in SCDHEC Regulation 61-113.
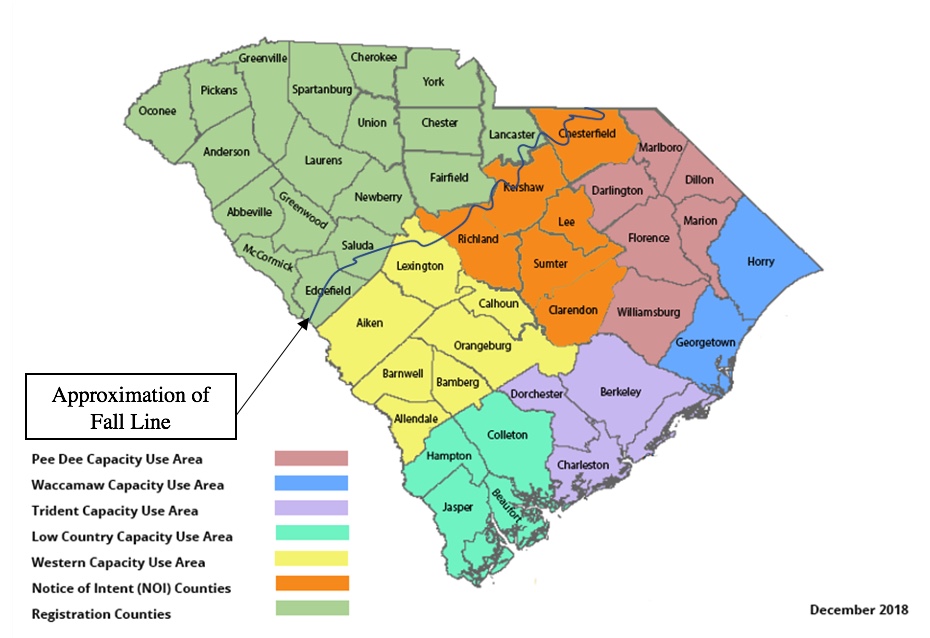
Figure 3. Map of South Carolina groundwater capacity use areas.12 Image credit: SC Department of Health and Environmental Control.
If a user is constructing a new well or replacing an existing well for drinking water or irrigation, a general permit must be obtained before the work may commence.10 This permitting process involves submitting a Notice of Intent (NOI) to SCDHEC for their review and approval or denial, which must come within forty-eight hours. The permittee must also give notice of the location, time, and date of the well construction, forty-eight hours prior to construction.10 The full process for applying and obtaining a well installation or replacement permit is found in SCDHEC Regulation 61-44. Users requiring registration or a permit must submit an annual water use report to SCDHEC. Penalties for violating this law and regulation include a $1,000 per day fine for each day of violation and potential for a criminal misdemeanor charge.11
Complete versions of these regulations can be found by searching Water Regulations on SCDHEC’s website or using the URLs in the citations at the end of the article. Producers can use the flowchart in figure 4 to understand the groundwater regulation process and how it might affect their operation. The flowchart helps guide users in determining if their withdrawals are in compliance with SCDHEC regulations and direct them to the specific regulatory documents for any questions.
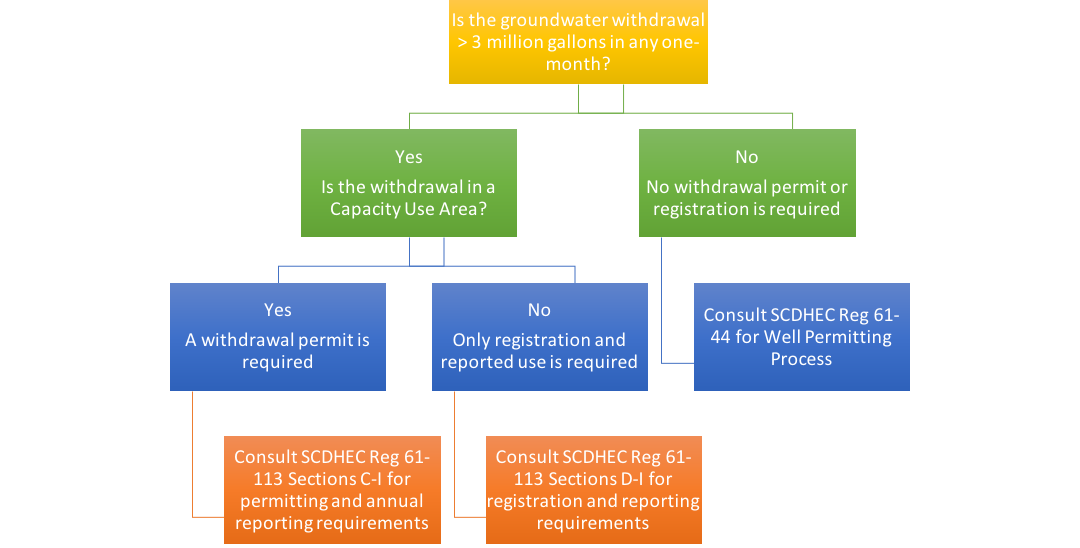
Figure 4. Flowchart detailing the groundwater regulation process and when to consult SCDHEC regarding registration and permitting. Image credit: Ethan Barnette, Clemson University.
Surface Water Regulations
Many agricultural producers in South Carolina withdraw and irrigate from surface water sources. Withdrawing surface water requires a different registration process; this process is outlined in SCDHEC Regulation 61-119, which can be found on SCDHEC’s website or by using the URL in the citation at the end of the article. This regulation is derived from the South Carolina Surface Water Withdrawal, Permitting, Use and Reporting Act [§49-4-10]. The surface water and groundwater withdrawal volume thresholds are the same (>3 MGM). Those exceeding this level of surface water withdrawal for agricultural uses are required to register and report their use to SCDHEC.13 If the withdrawal volume was reported before January 1, 2011, the user is considered registered and can continue withdrawing up to the greatest level previously reported or to the intake’s design capacity.12 If the surface withdrawal is new or is an expansion, the user must file the registration application with SCDHEC. The requirements for the application are found in SCDHEC Regulation 61-119, section L-4.
If the surface water withdrawal is only for “agricultural purposes” and (1) originates from a farm pond owned or leased by the user or (2) if the pond is on private property across multiple parcels and all owners agree to the water use, then the withdrawal is exempt from registration and reporting requirements.12
An annual quantity use report must be submitted to SCDHEC no later than the February 1 of each year by all non-exempted registered agricultural surface water withdrawals.12 The report must detail the quantity of water withdrawn and describe how the quantity withdrawn was determined. Approved methods can be found in Regulation 61-119, section N-2. Penalties for violating this law and regulation include a $10,000 per day fine for each day of violation and possibly a criminal misdemeanor charge.13 Producers can use the flowchart in figure 5 to understand the surface water regulation process and how it might affect their operation. The flowchart will guide the user in determining if their withdrawals are in compliance with SCDHEC regulations and direct them to the specific regulatory documents for more information.
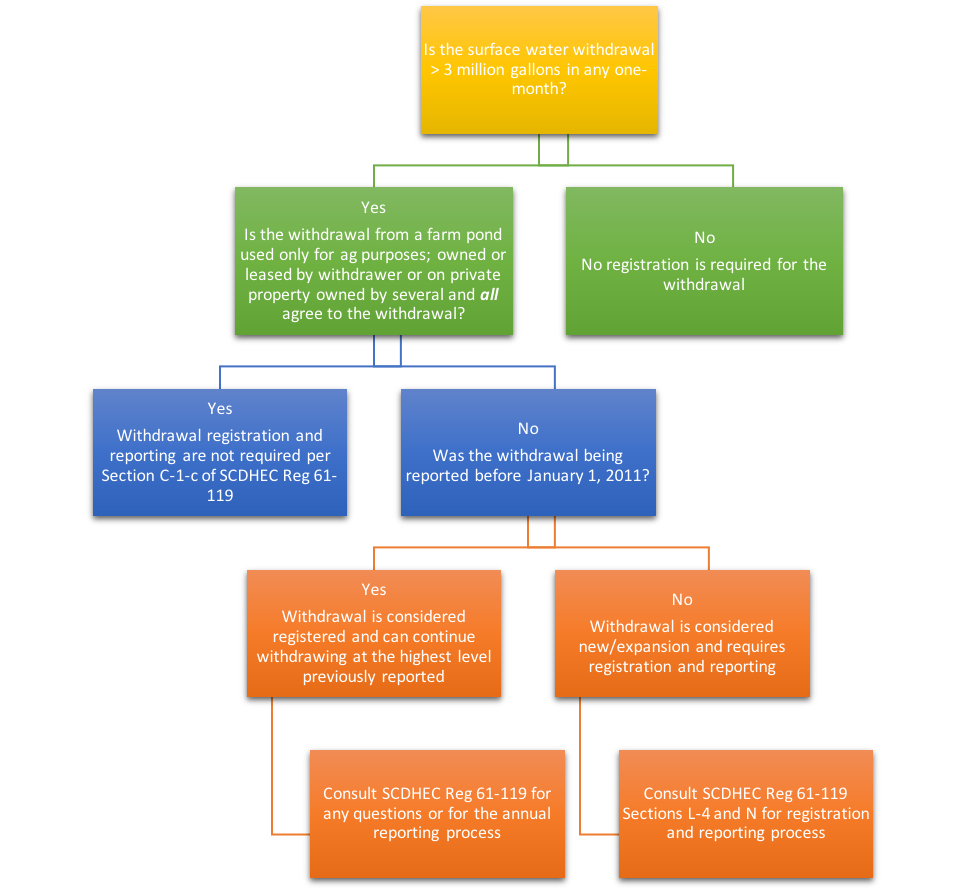
Figure 5. Flow chart detailing the surface water regulation process and when to consult SCDHEC regarding the registration and reporting process. Image credit: Ethan Barnette, Clemson University.
Determining Water Use
All water users in the state should strive to comply with relevant regulations. To help determine if agricultural water usage is in compliance at an operation, use the tables below. The tables provide information to help producers understand if irrigation applications may exceed SCDHEC threshold volumes (tables 1 and 2) by visualizing the > 3 MGM threshold across different acreage using varying application rates.
Table 1. Water usage application guide in inches applied per one-month basis. The y signifies that water usage is less than the 3 MGM threshold (no permit or registration required). The x represents water usage that exceeds the 3 MGM threshold (a permit or registration is required).
| Irrigation Application Threshold Table | |||||||||||||
| Applied Water (inches per month) | |||||||||||||
| Acreage | 0.5 | 1.0 | 2.0 | 3.0 | 4.0 | 5.0 | 6.0 | 7.0 | 8.0 | 9.0 | 10.0 | 11.0 | 12.0 |
| 5 | y | y | y | y | y | y | y | y | y | y | y | y | y |
| 10 | y | y | y | y | y | y | y | y | y | y | y | x | x |
| 15 | y | y | y | y | y | y | y | y | x | x | x | x | x |
| 20 | y | y | y | y | y | y | x | x | x | x | x | x | x |
| 25 | y | y | y | y | y | x | x | x | x | x | x | x | x |
| 50 | y | y | y | x | x | x | x | x | x | x | x | x | x |
| 75 | y | y | x | x | x | x | x | x | x | x | x | x | x |
| 100 | y | x | x | x | x | x | x | x | x | x | x | x | x |
| 125 | y | x | x | x | x | x | x | x | x | x | x | x | x |
| 150 | y | x | x | x | x | x | x | x | x | x | x | x | x |
| 175 | y | x | x | x | x | x | x | x | x | x | x | x | x |
| 200 | x | x | x | x | x | x | x | x | x | x | x | x | x |
Table 2. Water usage application guide in inches applied per one-week basis. The y signifies that water usage is less than the 3 MGM threshold (no permit or registration required). The x represents water usage that exceeds the 3 MGM threshold (a permit or registration is required).
| Irrigation Application Threshold Table | |||||||||||||
| Applied Water (inches per week) | |||||||||||||
| Acreage | 0.05 | 0.10 | 0.25 | 0.50 | 0.75 | 1.00 | 1.25 | 1.50 | 1.75 | 2.00 | 2.25 | 2.50 | 2.75 |
| 5 | y | y | y | y | y | y | y | y | y | y | y | y | y |
| 10 | y | y | y | y | y | y | y | y | y | y | y | y | y |
| 15 | y | y | y | y | y | y | y | y | y | x | x | x | x |
| 20 | y | y | y | y | y | y | y | x | x | x | x | x | x |
| 25 | y | y | y | y | y | y | x | x | x | x | x | x | x |
| 50 | y | y | y | y | x | x | x | x | x | x | x | x | x |
| 75 | y | y | y | x | x | x | x | x | x | x | x | x | x |
| 100 | y | y | y | x | x | x | x | x | x | x | x | x | x |
| 125 | y | y | x | x | x | x | x | x | x | x | x | x | x |
| 150 | y | y | x | x | x | x | x | x | x | x | x | x | x |
| 175 | y | y | x | x | x | x | x | x | x | x | x | x | x |
| 200 | y | y | x | x | x | x | x | x | x | x | x | x | x |
Conclusion
At first glance, exceeding the 3 MGM withdrawal limit may seem unreachable for many agricultural users. However, the 3 MGM volume is quickly attainable, and users may exceed the threshold without even being aware of any regulatory ramifications. For example, common agronomic crops grown and irrigated in South Carolina are corn, cotton, and soybeans. To optimize yield, each of these crops would require 0.3 inches of water per day per acre during their peak growth period.14 If a grower irrigated at this daily rate or at the equivalent application rate of 2.1 inches per week for one month, across just fifteen acres, they would exceed the monthly threshold and trigger either the registration or permitting requirements set forth in the regulations. By helping agricultural producers understand and comply with relevant regulations, more informed conservation plans can be established, and South Carolina’s water resources can be safeguarded for future use.
References
- Runkle J, Kunkel K, Stevens L, Frankson R, Stewart BC, Sweet W. South Carolina state climate summary. Asheville (NC): National Centers for Environmental Information. https://statesummaries.ncics.org/chapter/sc/.
- S.C. Code Ann. §49-5-20. 1962.
- South Carolina Water Use Report 2018 Summary. Columbia (SC): SC Department of Health and Environmental Control (SCDHEC); 2019. https://www.scdhec.gov/sites/default/files/media/document/Water Use Report Summary 2018.pdf.
- South Carolina Water Use Report 2014. Columbia (SC): SC Department of Health and Environmental Control (SCDHEC); 2015. https://www.scdhec.gov/sites/default/files/media/document/2014 Reported Water Use.pdf.
- South Carolina Water Use Report 2015. Columbia (SC): SC Department of Health and Environmental Control (SCDHEC); 2016. https://scdhec.gov/sites/default/files/media/document/2015%20Reported%20Water%20Use.pdf.
- South Carolina Water Use Report 2016. Columbia (SC): SC Department of Health and Environmental Control (SCDHEC); 2017. https://scdhec.gov/sites/default/files/media/document/2016%20Reported%20Water%20Use.pdf.
- South Carolina Water Use Report 2017 Summary. Columbia (SC): SC Department of Health and Environmental Control (SCDHEC); 2018. https://www.scdhec.gov/sites/default/files/media/document/Water Use Report Summary 2017.pdf.
- Samadi S, Tufford DL, Carbone GJ. Assessing parameter uncertainty of semi-distributed hydrology model for a shallow aquifer dominated environmental system. Journal of the American Water Resources Association (JAWRA). 2017 Dec [accessed 2020 Aug 14];53(06):1368–1389. doi:10.1111/1752-1688.12596.
- Regulation 61-113 Groundwater Use and Reporting. Columbia (SC): SC Department of Health and Environmental Control (SCDHEC). https://www.scdhec.gov/sites/default/files/media/document/R.61-113.pdf#page=3
- Regulation 61-44 Individual Residential Well and Irrigation Well Permitting. Columbia (SC): SC Department of Health and Environmental Control (SCDHEC). https://www.scdhec.gov/sites/default/files/media/document/R.61-44.pdf#page=3.
- S.C Code Ann. §49-5-120. 1962.
- SCDHEC. Groundwater withdrawal permitting & capacity use areas. 2018 Dec [accessed 2020 Feb 17]. https://scdhec.gov/environment/bureau-water/groundwater-use-reporting/groundwater-management-planning/groundwater-0.
- Regulation 61-119 Surface Water Withdrawal, Permitting, Use and Reporting. Columbia (SC): SC Department of Health and Environmental Control (SCDHEC). https://www.scdhec.gov/sites/default/files/media/document/R.61-119.pdf#page=5.
- S.C Code Ann. §49-4-180. 1982.
- South Carolina Irrigation Guide. Washington (DC): United States Department of Agriculture (USDA); 1987 [accessed 2020 Aug 13]. https://archive.org/details/southcarolinairr023327mbp.