

This research was funded by the Walton Family Foundation.
In a Nutshell:
- Kellie and A.J. Blair are aiming to fine-tune the nitrogen fertilization regime for their food-grade oat enterprise. The objective of this trial was to compare oat yields and profitability between treatments receiving 0 lb N/ac and 50 lb N/ac.
- The Blairs hypothesized oat yields and profitability would be greatest in the treatment receiving 50 lb N/ac compared to the treatment receiving 0 lb N/ac.
Key Findings:
- Oat yield in the strips receiving 50 lb N/ac was statistically greater than in the control strips.
- The return on investment in the strips receiving 50 lb N/ac was $56.72 greater than in the control strips.
- The Blairs plan to repeat the trial with different nitrogen rates and compare oat test weights in addition to oat yields.
Background
In an effort to diversify their corn-soy rotation, A.J. and Kellie Blair began growing food-grade (i.e. ‘milling’) oats in 2018. To sell oats as food-grade, most food companies require test weights no less than 38 lb/bu before applying dockage.[1] Balanced fertility is essential for achieving high test weights, and too much or too little nitrogen will reduce test weight.[2,3] After hearing conflicting fertility recommendations from others, the Blairs grew keen to determine an optimum fertility regime for their operation. They heard from many people that no nitrogen was needed for oats preceded by soybeans but observed outstanding oat yields at the ISU Northeast Research Farm in Nashua where 30 lb N/ac was applied for a multi-site oat variety trial.[4] Because the Blairs are new to food-grade oat production, they wanted to conduct strip trials to home in on the best nitrogen rate for their operation.
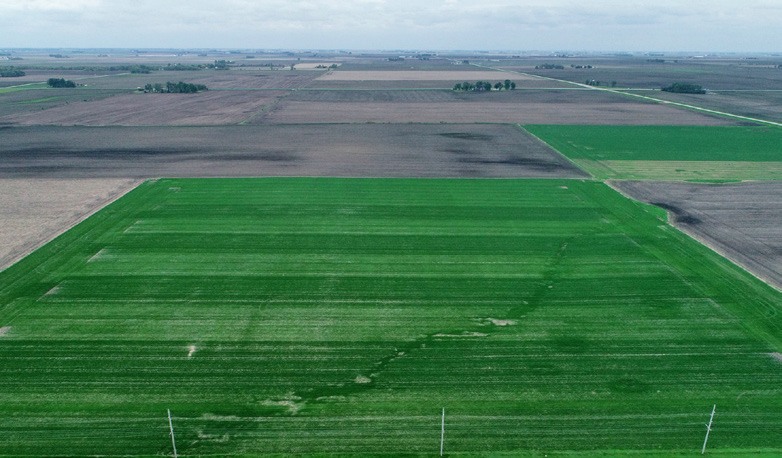
The darker green strips indicate where 50 lb N/ac was applied while the lighter green strips indicate where 0 lb N/ac was applied. In addition to color differences, the Blairs observed oats that received 50 lb N/ac were taller. Photo taken June 1, 2020.
The objective of this trial was to determine the effect of increasing nitrogen fertilizer rate from 0 lb/ac to 50 lb/ac on yield and profitability of food-grade oats preceded by soybean. In the words of A.J. Blair, “As we move to more small grain production – a crop with which we currently have little experience – we want to ground truth some of the questions we have about the best way to grow them.”
Methods
Design
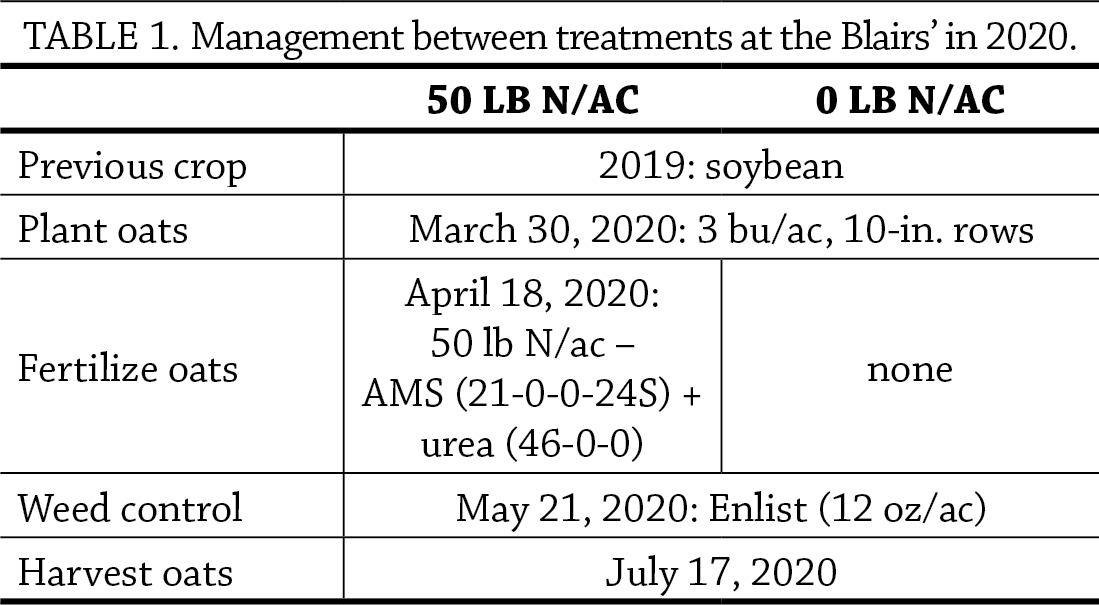
Kellie and A.J. Blair drilled Reins variety oats on March 30, 2020, into a field preceded by soybean (Table 1). The oat seeding rate was 3 bu/ac with 10-in. row spacing. To determine the need for nitrogen fertilization, the Blairs compared two fertilizer-rate treatments in their oats:
- 0 lb N/ac (control)
- 50 lb N/ac
The Blairs established treatments on Apr. 18 by applying 50 lb N/ac in the form of AMS (75 lb/ac, 21-0-0-24S) and urea (75 lb/ac, 46-0-0) to oats in strips measuring 120 ft wide by 850 ft long. Next to each fertilized strip they left a strip of equal length and width to which no fertilizer was applied (control). Each treatment was replicated 4 times for a total of 8 strips (Figure A1). On May 21, the Blairs applied Enlist (12 oz/ac) for weed control.
Measurements
The Blairs harvested oats from the middle 80 ft of each strip and recorded yields from each individual strip on July 17. Yields were adjusted to standard moisture (14%).
Data analysis
To evaluate the effect of N rate on oat yield and profitability, we calculated the least significant difference (LSD) at the 95% confidence level using a t-test for the oat yield measurement. If the difference in average yield between the two N rate treatments was greater than the LSD, we would expect such a difference to occur 95 times out of 100 under the same conditions – we refer to this as a statistically significant effect. On the other hand, if the difference resulting from the two N rate treatments was less than the LSD, we consider the results to be statistically similar. We could make these statistical calculations because the Blair’s experimental design involved replication of the two treatments (Figure A1).
Results and Discussion
Oat yield
Oat yield in the strips receiving 50 lb N/ac was statistically greater than oat yield in the control strips (Figure 1). In the month following oat planting (March 30), total rainfall accumulated to less than 1/4 the historical average (Figure A2). While providing oats 50 lb N/ac provided a benefit to yield, it is possible the full benefit was not realized due to low moisture that may have delayed N mineralization. The Blairs did not measure test weight in each strip but confirmed that all their oats made test weight at 39 to 40 lb/bu.

FIGURE 1. Oat yields in both treatments at the Blair farm. Columns represent yields for each individual strip. The average yield is indicated above each group of columns. Because the difference between averages is greater than the least significant difference (LSD = 2 bu/ac), the treatment yields are considered statistically different at the 95% confidence level. Averages are followed by different letter-rankings to indicate a statistically significant difference.
Economic considerations
The return on investment in the 50 lb N/ac treatment was $56.72 greater than in the 0 lb N/ac treatment (Table 2).

Conclusions and Next Steps
Through conducting this on-farm research, the Blairs were able to confirm their hypothesis that applying 50 lb N/ac to their food-grade oat crop would improve yields and profitability compared to applying 0 lb N/ac. In remarks made about this trial during their 2020 PFI virtual field day, the Blairs stated that oats receiving 50 lb N/ac were taller than oats that received 0 lb N/ac and there was no lodging.[6] They voiced a mixture of curiosity and uncertainty over what would come of testing 75 lb N/ac. The Blairs plan to trial different nitrogen rates in the future to further home in on the best rate for their operation. In addition to comparing yields, they will also evaluate any effects on oat quality (food-grade marketability) by comparing oat test weights.
Appendix – Trial Design and Weather Conditions
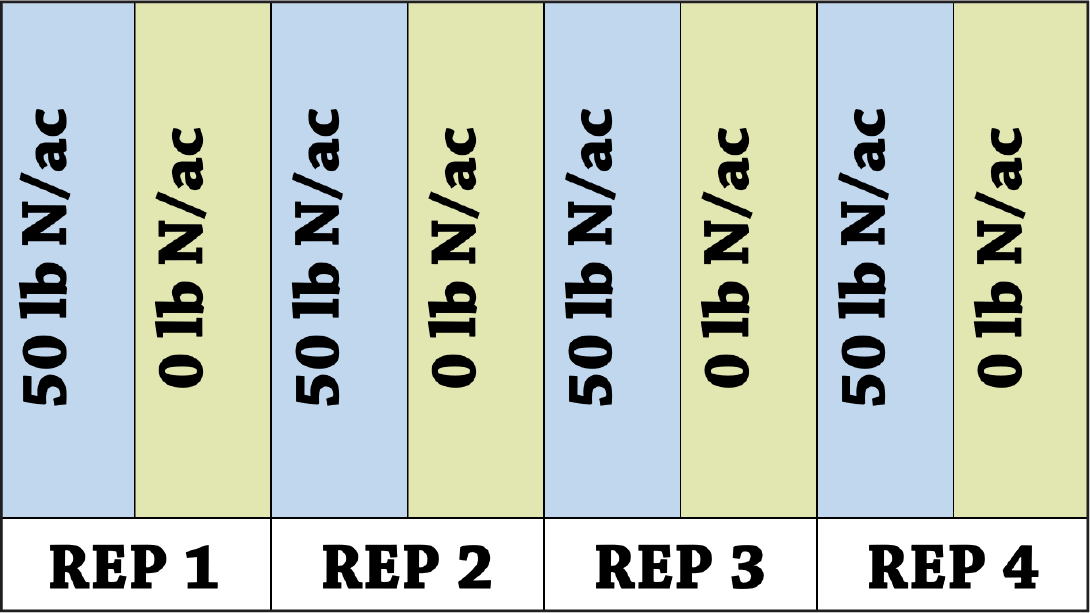
FIGURE A1. Kellie & A.J. Blair’s experimental design consists of four replications of both treatments. This design allows for statistical analysis of the data.

FIGURE A2. Mean monthly temperature and rainfall during the trial period and the long-term averages at Webster City the nearest weather station to the Blair farm (about 19 miles away)[7].
References
- Ransom, J., M.S. McMullen and A. Friskop. 2018. Oat Production in North Dakota. A891. North Dakota State University Extension. https://www.ag.ndsu.edu/publications/crops/oat-production-in-north-dakota (accessed September 2020).
- Isleib, J. 2012. Test weight in small grains. Michigan State University Extension. https://www.canr.msu.edu/news/test_weight_in_small_grains (accessed September 2020).
- DeBlieck, E. and L. Weinbender. 2018. The Growth of Oats: A Production Handbook. Grain Millers, Inc. https://www.grainmillers.com/suppliers-circle/crop-sciences/ (accessed September 2020).
- Gailans, S., S. Carlson, M. Schnabel, K. Pecinovsky, W. Koehler, M. Smith and A. Robertson. 2019. Oat Variety Trial 2019. Practical Farmers of Iowa Cooperators’ Program. https://practicalfarmers.org/research/oat-variety-trial-2019/ (accessed October 2020).
- Plastina, A., A. Johanns and O. Massman. 2020. 2020 Iowa Farm Custom Rate Survey. FM1 1698. Ag Decision Maker. Iowa State University Extension and Outreach. https://www.extension.iastate.edu/agdm/crops/html/a3-10.html (accessed November 2020).
- Practical Farmers or Iowa, Kellie Blair and A.J. Blair. 2020. Growing High-Quality Food-Grade Oats. Practical Farmers or Iowa. https://practicalfarmers.org/events/field-days/growing-high-quality-food-grade-oats/ (accessed January 2021).
- Iowa Environmental Mesonet. 2021. IEM “Climodat” Reports. Iowa State University Department of Agronomy. https://mesonet.agron.iastate.edu/climodat/ (accessed January 2021).