The crash of 2002
Peter Hensman
Experienced investment professional skilled in investing and client communication
This series of articles takes a look back at past financial market events to help investors understand the context of current markets. This first note examines the sharp downturn in 2002.
Everyone involved in investing has heard of the Tech, or TMT (Technology, Media and Telecoms), boom of the late 90s. They also know about the Tech Wreck that followed. Much less is said about the market crash of 2002. While this was part of the bigger Millennium hangover, for equities beyond the TMT sectors, this was actually the bigger part of that bear market.
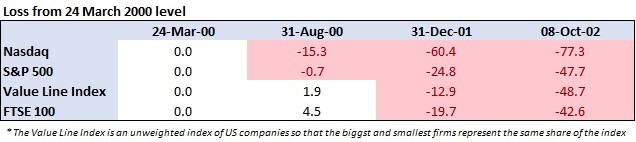
The table below shows the percentage value lost for a selection of equity indices, relative to their prices on 24 March 2000. This was the day that the NASDAQ index peaked with a closing price of 4,963.

The reason for selecting the end of August 2000 for the first comparison is that although tech heavy NASDAQ index peaked on 24 March, many economically sensitive equities made new highs over the summer as the economy boomed. Despite these new highs, the ‘tech wreck’ in the TMT sectors had already begun. As the table demonstrates, the NASDAQ index was already more than 15% below the March high.
While 2001 was far from a good year for equities, an outcome that was not helped by the 9/11 attacks, for many equities the worst was still to come.
2002 was economically uneventful in the large economies. In markets and policy setting it was extraordinary. Despite markets rallying in the early part of the year in response to the looser monetary policy that followed the 9/11 attacks, this positive momentum fell away by the middle of the year. The table shows that to the low point in early October 2002 the typical equity listed in the US, lost a further 35% of the value it had on 24 March 2000 (as measured by the Value Line Geometric Index). Both the S&P and FTSE 100 indices lost nearly another quarter of their March 2000 values.
Corporate excess
The challenge the world faced was the collapse of the corporate bond market as the excesses of the boom years became clear. Unsurprisingly, few wanted to lend to over extended companies as growth slowed. The poster children of the this excess were the scandals at Enron and WorldCom. The unethical behaviour of executives at these and other companies gave rise to the Sarbanes-Oxley Act on corporate accountability and responsibility.
Though central banks had slashed interest rates in response to the slowing economy and market turmoil, corporate borrowing costs did not respond - especially for lower quality borrowers.
The chart below highlights these trends. It plots the Federal Funds Target Rate, 10-year US Treasury yields, the High Yield spread and the implied total borrowing cost for these higher risk corporate borrowers. This spread is the difference between the cost of borrowing demanded by investors for High Yield companies and what the US government has to pay to borrow for the same length of time. A higher spread shows investors are more cautious about lending to riskier names.

Despite the efforts of the Federal Reserve (the Fed) to ease financial conditions through what were dramatic interest rate cuts at that time, the high yield market did not respond. By early 2002, the difference between the two borrowing rates was already large at 8%. Though corporate borrowing costs dropped in response to the interest rate cuts that followed the 9/11 attacks, as with the upturn in equity prices, the improvement proved to be temporary. As with pain killers wearing off when the source of pain has not disappeared, as the short-term positives of the interest rate cuts passed the adage ‘sell in May and go away’ held true. Widening High Yield spreads coincided with the severe equity downturns highlighted earlier, running from May 2002 through to the autumn.
Helicopter Ben to the rescue?
A significant event over the summer was appointment of a new Deputy Chair at the Fed, Ben Bernanke. Dr Bernanke had headed the Department of Economics at Princeton University and was renowned as an expert on the Great Depression. Appointed as a potential successor to the long-standing Chairman of the Board Alan Greenspan, his mandate was to ensure that the approaching ‘zero bound’, the apparent lower limit of 0% on interest rates, did not challenge the ability of the central bank to boost the economy.
In November, Dr Bernanke gave a speech titled “Deflation, Making sure ‘it’ doesn’t happen here”. This speech gave the Fed Deputy Chair the nickname, “Helicopter Ben” for his reference to effectively dropping bags of money on the economy. More significantly, the promise that the Fed might take the extraordinary step of squashing corporate borrowing costs more directly than cutting interest rates helped to break the log jam in the corporate bond market. Corporate borrowing costs began to normalise as spreads finally began to drop from their highs. The seeds for stabilising the market had been sown.
Not only did the speech kick-start the stalled corporate bond market, it also lay the framework for much of the central bank intervention that has become necessary since (and for some it sowed the seeds of the increasingly wild financial booms and busts experienced ever since).