United States
Mapped: The World’s Top Countries for Military Spending
Mapped: The World’s Top Countries for Military Spending
By practically any measure, the world today is more peaceful and less war-torn on a global scale, relative to the past.
For instance, declarations of war between nations and soldier casualties have both dropped drastically since the 20th century. Yet, military spending has not followed this trend.
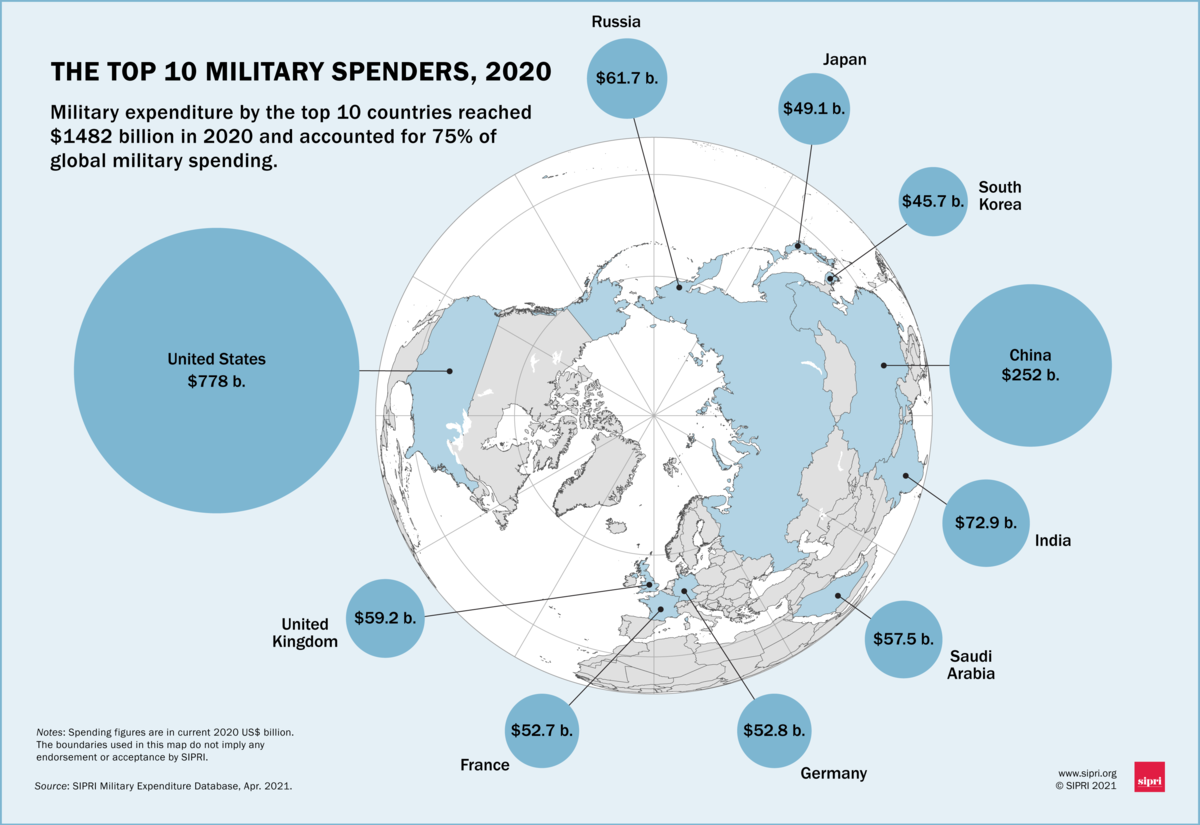
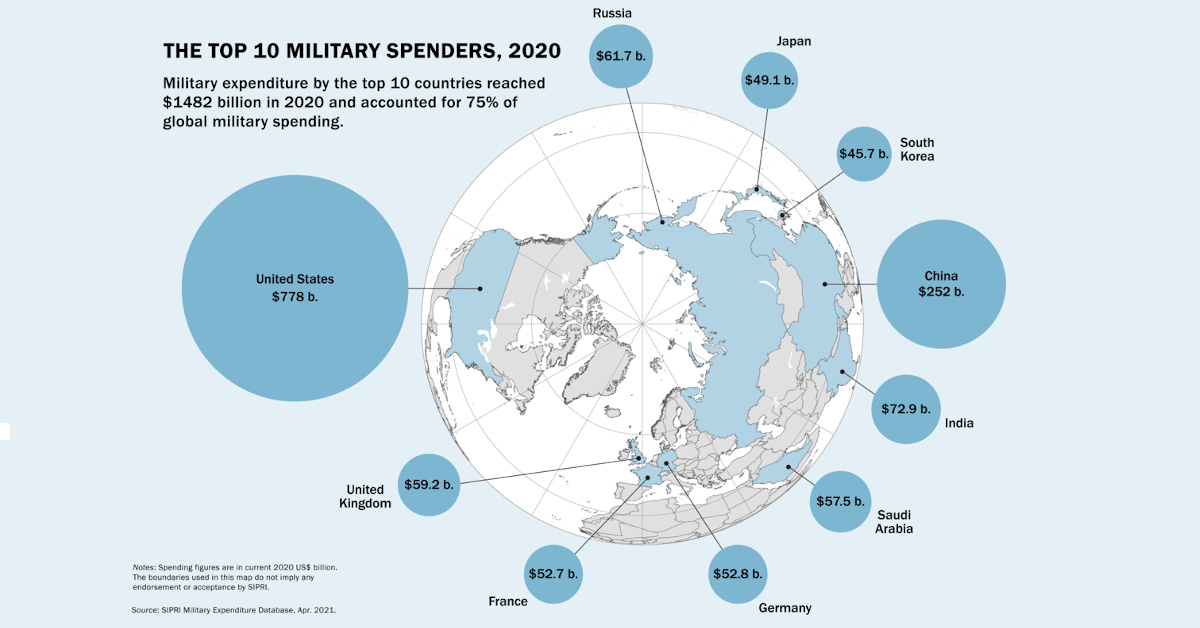
The Top 10 Military Spenders
According to SIPRI, global military spend reached almost $2 trillion in 2020. The top 10 countries represent roughly 75% of this figure, and have increased their spending by $51 billion since the year prior.
Here’s how the worlds top 10 military spenders compare to each other:
| Rank | Country | Military Spend 2020 ($B) | % Change | Military Spend 2019 ($B) |
|---|---|---|---|---|
| #1 | 🇺🇸 United States | $778.0 | +6.2% | $732.0 |
| #2 | 🇨🇳 China | $252.0 | -3.4% | $261.0 |
| #3 | 🇮🇳 India | $72.9 | +2.5% | $71.1 |
| #4 | 🇷🇺 Russia | $61.7 | -5.2% | $65.1 |
| #5 | 🇬🇧 United Kingdom | $59.2 | +21.5% | $48.7 |
| #6 | 🇸🇦 Saudi Arabia | $57.5 | -7.1% | $61.9 |
| #7 | 🇩🇪 Germany | $52.8 | +7.1% | $61.9 |
| #8 | 🇫🇷 France | $52.7 | +5.1% | $50.1 |
| #9 | 🇯🇵 Japan | $49.1 | +3.1% | $47.6 |
| #10 | 🇰🇷 South Korea | $45.7 | +4.1% | $43.9 |
| Total | $1,481.6 | +3.5% | $1,430.7 |
The U.S. isn’t labeled as a global superpower for nothing. The country is by far the largest military spender, and its $778 billion budget trumps the remainder of the list’s collective $703.6 billion. On its own, the U.S. represents just under 40% of global military spending.
This year, Saudi Arabia has lost out on a top five seat to the UK, after a 7.1% decline in spending compared to a 21.5% increase for the UK.
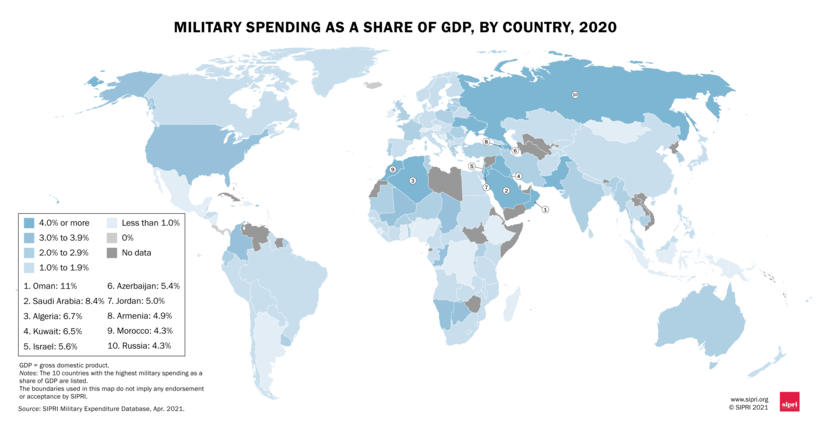
Military Spend as a Percentage of GDP
Military expenditures as a percentage of GDP can be used to compare military spending relative to the size of a country’s economy.
Click here to view a high-resolution version of this image.
When looking at things this way, many of the top spenders above do not appear. This may be an indication of their economic prowess or a demonstration that the money might be used for other vital areas such as education, healthcare, or infrastructure.
| Rank | Country | Region | Spend as a % of GDP (2020) |
|---|---|---|---|
| #1 | 🇴🇲 Oman | Middle East | 11.0% |
| #2 | 🇸🇦 Saudi Arabia | Middle East | 8.4% |
| #3 | 🇩🇿 Algeria | North Africa | 6.7% |
| #4 | 🇰🇼 Kuwait | Middle East | 6.5% |
| #5 | 🇮🇱 Israel | Middle East | 5.6% |
| #6 | 🇷🇺 Russia | Europe/Asia | 4.3% |
| #7 | 🇲🇦 Morocco | North Africa | 4.3% |
| #8 | 🇮🇶 Iraq | Middle East | 4.1% |
| #9 | 🇺🇦 Ukraine | Europe | 4.1% |
| #10 | 🇵🇰 Pakistan | South Asia | 4.0% |
It’s pretty rare for countries to reach double digits for military spending as a percentage of GDP. In this case, Oman is an outlier, as the Middle Eastern country’s spending relative to GDP grew from 8.8% last year, to 11% in 2020.
Many of the countries with the highest military spending to GDP are located in the Middle East—a reflection of the escalating conflicts that have persisted in the region for well over two decades.
It’s worth noting that some data for the Middle Eastern region are estimates, due to the aforementioned regional instability.
More Spending to Come?
Global military spending figures are at a 32-year high, despite the pandemic’s effect on shrinking economic output.
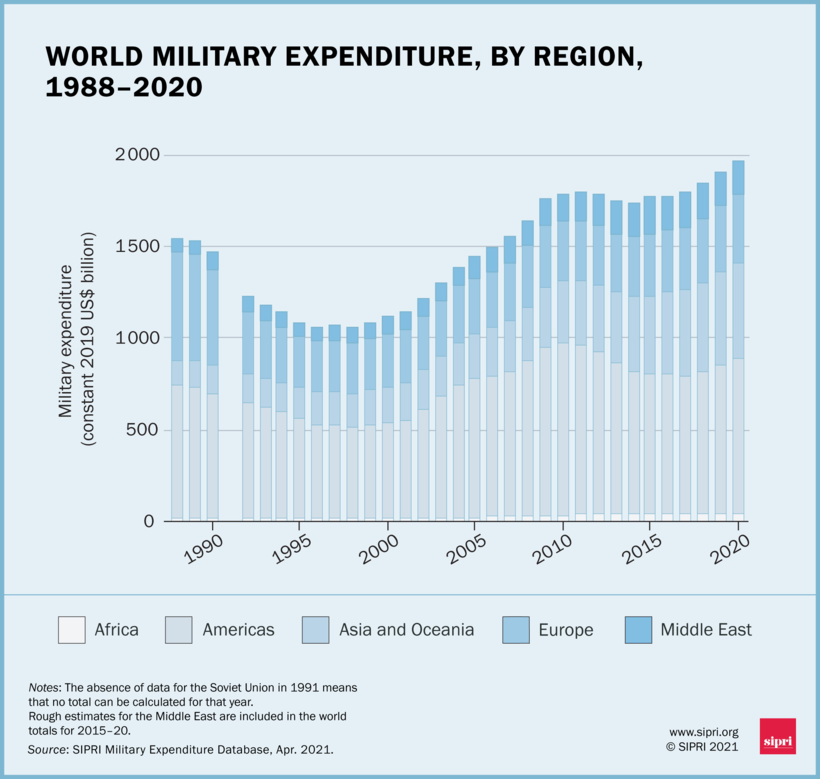
Although a major war hasn’t occurred in some time, it’s not to say the geopolitical mood hasn’t been tense.
The last 12 months or so have witnessed some nail-biting moments including:
- Border disputes between China and India
- Heightening tensions between China and Taiwan
- Russia’s military presence in eastern Ukraine
- The hacking of SolarWinds, a Texas-based company, by Russia
- The ongoing Yemen crisis
- An Israel-Iran feud
Will 2021 extend the trend of peace, or will rising military spending mean even higher tensions?


United States
Ranked: The Largest U.S. Corporations by Number of Employees
We visualized the top U.S. companies by employees, revealing the massive scale of retailers like Walmart, Target, and Home Depot.


The Largest U.S. Corporations by Number of Employees
This was originally posted on our Voronoi app. Download the app for free on Apple or Android and discover incredible data-driven charts from a variety of trusted sources.
Revenue and profit are common measures for measuring the size of a business, but what about employee headcount?
To see how big companies have become from a human perspective, we’ve visualized the top U.S. companies by employees. These figures come from companiesmarketcap.com, and were accessed in March 2024. Note that this ranking includes publicly-traded companies only.
Data and Highlights
The data we used to create this list of largest U.S. corporations by number of employees can be found in the table below.
| Company | Sector | Number of Employees |
|---|---|---|
| Walmart | Consumer Staples | 2,100,000 |
| Amazon | Consumer Discretionary | 1,500,000 |
| UPS | Industrials | 500,000 |
| Home Depot | Consumer Discretionary | 470,000 |
| Concentrix | Information Technology | 440,000 |
| Target | Consumer Staples | 440,000 |
| Kroger | Consumer Staples | 430,000 |
| UnitedHealth | Health Care | 400,000 |
| Berkshire Hathaway | Financials | 383,000 |
| Starbucks | Consumer Discretionary | 381,000 |
| Marriott International | Consumer Discretionary | 377,000 |
| Cognizant | Information Technology | 346,600 |
Retail and Logistics Top the List
Companies like Walmart, Target, and Kroger have a massive headcount due to having many locations spread across the country, which require everything from cashiers to IT professionals.
Moving goods around the world is also highly labor intensive, explaining why UPS has half a million employees globally.
Below the Radar?
Two companies that rank among the largest U.S. corporations by employees which may be less familiar to the public include Concentrix and Cognizant. Both of these companies are B2B brands, meaning they primarily work with other companies rather than consumers. This contrasts with brands like Amazon or Home Depot, which are much more visible among average consumers.
A Note on Berkshire Hathaway
Warren Buffett’s company doesn’t directly employ 383,000 people. This headcount actually includes the employees of the firm’s many subsidiaries, such as GEICO (insurance), Dairy Queen (retail), and Duracell (batteries).
If you’re curious to see how Buffett’s empire has grown over the years, check out this animated graphic that visualizes the growth of Berkshire Hathaway’s portfolio from 1994 to 2022.

-

 Markets1 week ago
U.S. Debt Interest Payments Reach $1 Trillion
-

 Markets2 weeks ago
Ranked: The Most Valuable Housing Markets in America
-

 Money2 weeks ago
Which States Have the Highest Minimum Wage in America?
-

 AI2 weeks ago
Ranked: Semiconductor Companies by Industry Revenue Share
-

 Markets2 weeks ago
Ranked: The World’s Top Flight Routes, by Revenue
-

 Countries2 weeks ago
Population Projections: The World’s 6 Largest Countries in 2075
-

 Markets2 weeks ago
The Top 10 States by Real GDP Growth in 2023
-

 Money2 weeks ago
The Smallest Gender Wage Gaps in OECD Countries