The distribution of South Africa’s population groups reveals the country’s history.
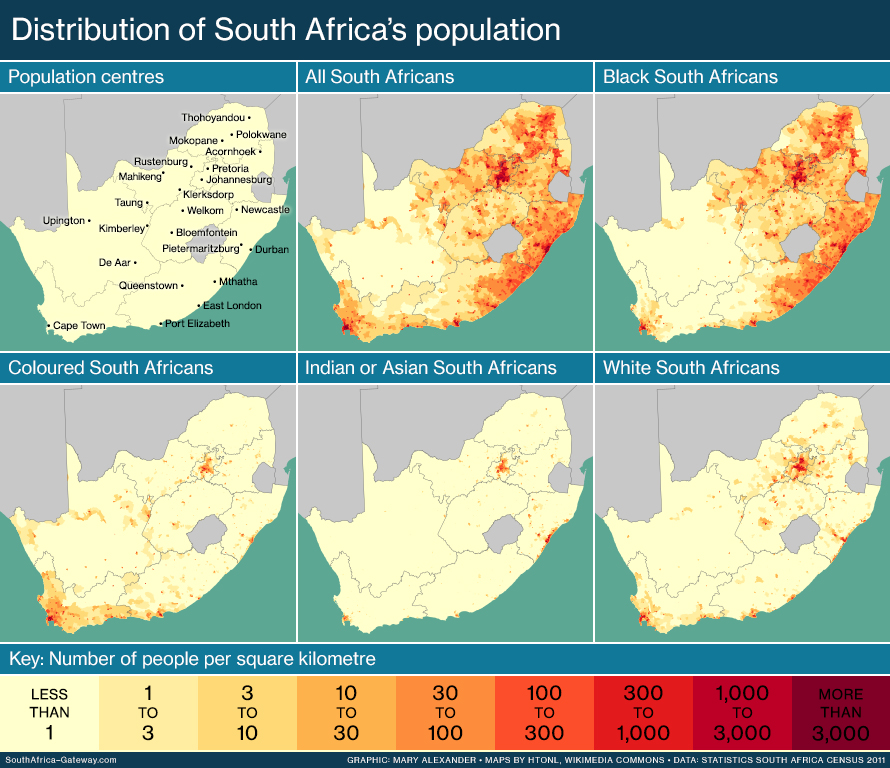
These maps are based on the 2011 census of the population.
READ MORE: South Africa’s population
According to the census, black South Africans are the majority at 79% of the population, and live both in the cities and across the poorer rural areas.
Indian South Africans, by contrast, are the smallest minority – just 2.5% of the population. They are concentrated in the city of Durban, and to a lesser extent in Cape Town and the urban areas of Gauteng. The first Indians were brought to Cape Town as slaves in 1684, during the Dutch colonial era. But today’s South African Indians are mainly descended from indentured labourers and free “passenger” immigrants who arrived in Durban between 1860 and 1914.
Coloured and white South Africans both make up around 9% of the population, according to the 2011 census. Yet whites are concentrated in the cities, while coloureds are scattered from the cities to the rural areas – a legacy of apartheid.
For generations white South Africans enjoyed better educational and economic opportunities than any other population group. They were also never subject to any law that restricted where they were allowed to live. So, today, white people still live where the higher-paying jobs are.
Coloured people are descended from the Khoi and San, from slaves brought to the Cape Colony from 1658 onwards, and from a mixture of all the people of the Cape – African, European and more – before racial classification was a thing. Today most coloured people live in the Western Cape, the Northern Cape and the eastern regions of the Eastern Cape.
All South Africans concentrate in Gauteng, the economic heart of the country. Over a quarter of the population lives in this small province.
Updated 8 July 2021
More infographics
 |
 |
 |
 |
 |
 |
Categories: Infographics, People
You must be logged in to post a comment.