

Abstract
Winters in snow-covered regions have warmed, likely shifting the timing and magnitude of nutrient export, leading to unquantified changes in water quality. Intermittent, seasonal, and permanent snow covers more than half of the global land surface. Warming has reduced the cold conditions that limit winter runoff and nutrient transport, while cold season snowmelt, the amount of winter precipitation falling as rain, and rain-on-snow have increased. We used existing geospatial datasets (rain-on-snow frequency overlain on nitrogen and phosphorous inventories) to identify areas of the contiguous United States (US) where water quality could be threatened by this change. Next, to illustrate the potential export impacts of these events, we examined flow and turbidity data from a large regional rain-on-snow event in the United States' largest river basin, the Mississippi River Basin. We show that rain-on-snow, a major flood-generating mechanism for large areas of the globe (Berghuijs et al 2019 Water Resour. Res. 55 4582–93; Berghuijs et al 2016 Geophys. Res. Lett. 43 4382–90), affects 53% of the contiguous US and puts 50% of US nitrogen and phosphorus pools (43% of the contiguous US) at risk of export to groundwater and surface water. Further, the 2019 rain-on-snow event in the Mississippi River Basin demonstrates that these events could have large, cascading impacts on winter nutrient transport. We suggest that the assumption of low wintertime discharge and nutrient transport in historically snow-covered regions no longer holds. Critically, however, we lack sufficient data to accurately measure and predict these episodic and potentially large wintertime nutrient export events at regional to continental scales.
Export citation and abstract BibTeX RIS

Original content from this work may be used under the terms of the Creative Commons Attribution 4.0 license. Any further distribution of this work must maintain attribution to the author(s) and the title of the work, journal citation and DOI.
1. Introduction
Winters have warmed—the cold and snow that historically reduced wintertime runoff and nutrient transport are now punctuated by runoff- and flood-producing snowmelt, rainfall, and rain-on-snow events [1–6]. These altered winter dynamics have global implications: areas with intermittent, seasonal, and permanent snowpack occupy more than 60% of the land surface [7] and areas impacted by snowmelt runoff encompass much of the global population [8]. In the United States (US) and Europe, for example, watersheds with historically persistent sub-freezing conditions and limited nutrient transport from the terrestrial landscape to receiving waters in winter (i.e. soils are hydrologically disconnected from downstream rivers, lakes, or groundwater; figure 1(a); Scenario 1, S1) are now exposed to multiple large-scale events that produce substantial runoff or flooding, such as midwinter snowmelt, rainfall, or rain-on-snow [9–12]. Runoff from such midwinter events was historically infrequent, but these increasingly common winter flushing events can interact with nutrient-rich landscapes to export large pulses of nutrients from soils to receiving waters, with potentially detrimental, but largely unknown, impacts on downstream water quality [13].
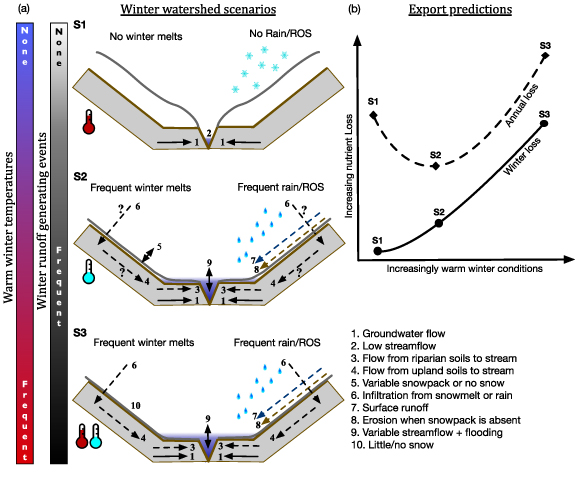
Figure 1. Conceptual model of hypothetical impacts of increasingly frequent winter runoff-generating events (snowmelt, rain, and rain-on-snow) and warming temperatures. Single-headed arrows indicate water and nutrient flows. Solid arrows are constant flows. Dashed arrows are intermittent flows. Question marks indicate uncertainty around infiltration and soil-stream connectivity. Double-headed arrows indicate variable snow or stream depth. Thermometers indicate frozen soils (blue) or soils warm enough for microbial activity (red). (a) In scenario 1 (S1), the historical conceptual model of winter, winters are cold with no or infrequent winter events. Soils are isolated, with low or no hillslope-stream connectivity. Snowpack-insulated soils are warm enough to accumulate nutrients from microbial activity (in addition to pre-winter anthropogenic inputs). Most annual nutrient transport is during spring snowmelt, when accumulated nutrients are flushed from soils. Scenario 2 (S2) has frequent winter events, intermittent snowpack, and cold temperatures with cold/frozen soils that limit microbial activity and nutrient accumulation. Unlike during spring and growing season runoff events, frozen soils limit infiltration and increase runoff, thereby reducing soil nutrient export. As events become more common and soil ice content increases, exported nutrients will be primarily from snow and eroded sediment (bare soil erosion or freeze-thaw streambank destabilization). In S2, winter nutrient export increases, but limited microbial activity reduces annual export vs. S1 (panel (b)). Scenario 3 (S3) has frequent runoff-generating events and warm temperatures that enhance microbial activity and soil nutrient accumulation vs. S1 or S2. Warm soils allow hillslope-stream connectivity and soil nutrient export. As in S2, bare soil and freeze-thaw cycles increase sediment transport. S3 will have greater winter and annual export than S1 or S2 (panel (b)). (b) Export predictions for winter and annual nutrient export from S1–3. Note that panel (a) figures represent generic watersheds, rather than a specific topography. After Pacific et al (2010).
Download figure:
Standard image High-resolution imageHumans have added vast quantities of nitrogen and phosphorus to landscapes. Annually, humans add an estimated 22–26 Tg of phosphorus as fertilizer, 183 Tg of nitrogen as fertilizer and from nitrogen-fixation by legumes, and 25–33 Tg of nitrogen via atmospheric deposition from fossil fuel combustion [14]. These massive nutrient additions augment existing soil nitrogen and phosphorus pools [15, 16] which, when mobilized and transported in dissolved, particulate, or sediment-bound forms, can impair groundwater and surface water quality and cause harmful algal blooms and hypoxic dead zones in water bodies [17–19]. Such nutrient-rich landscapes are now experiencing more frequent winter runoff events [6, 12, 20–25], with potentially detrimental consequences for societally and economically important, yet fragile, aquatic ecosystems.
Snowmelt, rain-on-snow, and rainfall onto soils with little or no storage capacity (e.g. saturated or frozen) are major flood-generating mechanisms [26, 27] driving winter flood events [28–31]. Midwinter snowmelt and rain (vs. snow) have become more frequent and are projected to increase as the climate warms [6, 12, 20–25]. Rain-on-snow events combine snowmelt and rainfall to cause substantial and potentially devastating floods, such as the costly June 2013 flood in Alberta, Canada, and the February 2017 near-failure of the Oroville Dam in California [29]. In seasonally snow-covered regions of the Northern Hemisphere, rain-on-snow events occur up to 30 times per winter [32] (figure 2(a)). Rain-on-snow events are most commonly projected to increase at high elevations and latitudes, as precipitation shifts from snow to rain, and decrease at low elevations and latitudes as snow cover declines [29, 33]. While there is uncertainty in these predictions, a warming climate has led us to a time where snowmelt, rainfall, and rain-on-snow events are driving increases in winter streamflow and flooding. Yet, a lack of winter data and our limited conceptual understanding of winter nutrient transport leaves us largely unable to predict the water quality impacts of these changes.

Figure 2. Spatial co-occurrence of rain-on-snow events and nitrogen and phosphorus pools in the contiguous US. (a) The historical frequency of rain-on-snow events (October 2003–September 2019) varies across the US, but is highest in the northeastern and northcentral US, and in mountainous regions of the western US (see orange and red colors); (b) Maps of potential nitrogen sources (the sum of total soil nitrogen, atmospheric deposition, and manure and fertilizer application) vs. rain-on-snow frequency and (c) potential phosphorus sources (the sum of soil phosphorus, and manure and fertilizer application) vs. rain-on-snow event frequency highlight regions of the US characterized by elevated nutrient pools that are also prone to frequent rain-on-snow (warm colors); and (d) The co-occurrence of large nitrogen pools (over 4.8 tons ha−1) and phosphorus pools (greater than 0.3 tons ha−1) in regions with rain-on-snow frequency of at least 0.25 events yr−1 show that a large, semi-continuous swath of the country are at risk of frequent, large wintertime nutrient export pulses which may ultimately increase annual nutrient loads to downstream waterbodies (regions colored in red). The numerical values in each quadrant of the legend in panel (d) represent the percent of the contiguous US that falls within that category and has a rain-on-snow frequency at least 0.25 events yr−1. The black outline in panels (a)–(d) delineates the Mississippi River watershed.
Download figure:
Standard image High-resolution imageIn the traditional view of winter for watersheds with seasonal snow cover (i.e. the non-growing season prior to spring melt), low air temperatures and snow accumulation result in low river discharge and limited nutrient transport from soils to aquatic ecosystems [34] (i.e. low soil-stream connectivity). Instead, streamflow and nutrients are derived from deep groundwater [35] (S1; figure 1(a)). Accumulated snowpack insulates soil [36], allowing microbial activity and nutrient accumulation [34, 36–38], and keeps water and nutrients locked in snow and soils until significant nutrient export resumes during spring snowmelt [3, 39–41]. Historically, spring snowmelt controlled the timing and magnitude of annual nutrient export, accounting for up to 50%–80% of annual nitrogen and phosphorus export from forested and agricultural watersheds [42–45]. This spring nutrient flux coincided with and was tempered by springtime plant growth and resulting plant nutrient uptake [34, 46–52]. The synchrony of spring nutrient availability and plant uptake is clearly important in natural systems, but is also important for agricultural systems that are perennial (e.g. hayfields, pasture), cover cropped [48, 53, 54], or separated from surface waters by natural land buffers [55–57]. Additionally, during the growing season, aquatic ecosystems can retain a significant portion of the nutrients delivered from the terrestrial environment [58–61]. Conversely, runoff-producing events occurring in the absence of terrestrial plant and aquatic nutrient uptake may have substantial impacts on both nutrient losses from terrestrial systems and transport of nutrients to fragile aquatic systems.
Given current and future winter climates, our conceptual model of winter water and nutrient transport must change (figure 1). In contrast to historical patterns (S1; figure 1(a)), emerging research indicates that winter snowmelt, but particularly rainfall and rain-on-snow, can generate large floods [29, 30] and substantial nutrient transport [1, 13, 62, 63]. With frequent winter snowmelt, rain, and rain-on-snow, snowpacks will thin or disappear (Scenarios 2–3, S2 and S3; figure 1). Without insulating snowpacks, soil temperature, freezing depth, and freeze-thaw frequency will likely control the magnitude of nutrient transport during runoff events. When snowpack is low or absent and air temperatures are sub-freezing, cold or frozen soils will reduce winter microbial activity and nutrient accumulation [34, 64, 65] (S2; figure 1(a)) relative to S1. Frozen soils can also prevent infiltration of snowmelt or rainwater into soils and promote flooding by increasing overland runoff (particularly 'concrete' soil freezing) [45, 66, 67]. Thus, frozen soils will reduce soil-stream connectivity as runoff bypasses long- and short-term nutrient storage reservoirs and denitrification hot spots in watershed soils [45, 66–68]. Uninsulated and bare soils are also vulnerable to erosion from freeze-thaw cycles (e.g. streambank sloughing) [69] or with runoff during rain events [70, 71]. Thus, in S2, erosion will increase winter transport, but limited winter microbial activity and nutrient accumulation will decrease annual transport (figure 1(b)).
Alternatively, when snowpack is low or absent and air temperatures are frequently above freezing, soils will be warm enough to support microbial activity, nutrient accumulation, and soil-stream connectivity (S3; figure 1(a)). Indeed, when soils are unfrozen and moisture is high from previous rainfall or snowmelt, low evaporation, and low-to-no plant water uptake [13, 72], rainfall or rain-on-snow can transport soil nutrients across large distances within the watershed [13]. This transport is of particular concern in agricultural watersheds, where nutrient sources are plentiful and uniformly distributed [73]. Further, bare soils subjected to frequent freeze-thaw cycles and rain events will enhance soluble nutrient losses [74] and erosion [70, 71]. Thus, in S3, both winter and annual nutrient export will be high (figure 1(b)). Overall, in our conceptual model, winter nutrient export increases as temperatures warm and winter runoff-generating events become more frequent, producing winter floods with high sediment and nutrient loads (figure 1(b)).
Our conceptual model (figure 1) describes the likely impacts of winter runoff-producing events, but we currently lack sufficient data to comprehensively test this model. We highlight the need for these data by examining where across the contiguous US water quality may be impacted by winter runoff-producing events. As an example of the potential importance of these events, we focus on the impact of one winter flood-generating event, rain-on-snow, in the contiguous US. We assess the potential for rain-on-snow to impact water quality by collecting and combining datasets on topsoil nitrogen and phosphorus pools [75, 76], annual nutrient inputs from fertilizer [77] and atmospheric deposition [78], and the historical daily frequency of heavy rainfall on snow-cover defined as a large rain-on-snow event [79]. We use these continental-scale data to assess the spatial co-occurrence of rain-on-snow and nutrient-rich areas in the US. Finally, we review the March 2019 Midwestern US rain-on-snow flood, which highlights some of the risks identified in our conceptual model and rain-on-snow analysis. Our assessment reveals a substantial risk of winter nutrient transport from nutrient-rich landscapes during rain-on-snow events, with potentially detrimental, unquantified impacts on downstream water quality.
2. Methods
2.1. Identifying areas of the contiguous US at risk of nutrient transport from rain-on-snow
To quantify the spatial co-occurrence of large rain-on-snow events (2003–2019) and large pools of nutrients, we amassed previously published contiguous US-scale nutrient data for nitrogen (figure S1) and phosphorus (figure S2) and identified regions with large pools of nitrogen and phosphorus that have frequent large rain-on-snow events (figures 2 and S3).
2.1.1. Rain-on-snow frequency
We estimated historical daily rain-on-snow frequency for the US using output from the snow data assimilation model system (SNODAS) [80] operated by the National Operational Hydrologic Remote Sensing Center, part of the National Weather Service and the National Oceanic and Atmospheric Administration. We define a large rain-on-snow event as at least 10 mm d−1 of rain falling on a snowpack of at least 10 mm snow water equivalent [79]. Following classifications of extreme precipitation [81], the 10 mm d−1 rainfall rate threshold, classified as heavy rainfall, is more conservative than metrics used in previous rain-on-snow studies (e.g. 3 mm over six days [28], 1 mm d−1 [82]). Our more conservative definition lends confidence that an identified rain-on-snow event has the potential to mobilize substantial rainfall and meltwater to the soil system [29]. We calculated the average daily rain-on-snow frequency for sixteen hydrologic years of SNODAS record (October 2003–September 2019; figure S3). The spatial resolution of the rain-on-snow frequency product is ∼923 m. The SNODAS data extent was cropped to that of the nutrient data products described below.
2.1.2. Total nitrogen pools
To create a map of total nitrogen pools across the contiguous US, we combined historical wet inorganic nitrogen deposition [78], fertilizer and manure nitrogen application [77], and topsoil nitrogen [75, 83] maps. For total soil nitrogen pools, we used total Kjeldahl nitrogen (0–50 cm; kg N ha−1) in raster (1 km) format [75, 83] (figure S1(a)). We estimated annual wet deposition inorganic nitrogen input (figure S1(b)) as the average of annual inorganic nitrate (kg NO3-N ha−1 yr−1) plus ammonium (kg NH4-N ha−1 yr−1) in wet deposition from 2003 to 2017 (figure S4; National Atmospheric Deposition Program) [78]. We obtained estimates of fertilizer and manure nitrogen inputs (kg N ha−1) from the International Plant Nutrition Institute (IPNI) Nutrient Use Geographic Information System (NuGIS) [77]. To match our data's time frame, we used available data for 2007 and 2010–2014 at the county level in kg N ha−1 (figures S5 and S6) and averaged across years to obtain mean annual nitrogen input from fertilizer and manure (figures S1(c) and (d); see S1—supplemental methods for more detail).
We estimated total soil nitrogen (Nsoil) as:

where Ntopsoil is topsoil N (kg N ha−1; 0–50 cm), Ndep is inorganic N from wet deposition (kg N ha−1 yr−1), Nfert is fertilizer N (kg N ha−1 yr−1), and Nmanure is manure N (kg N ha−1 yr−1). Total soil N estimates represent the average soil N pool for a representative year during the period 2003–2017. This simplified mass balance approach combines topsoil nitrogen estimates with average annual inorganic N inputs from wet deposition, fertilizer, and manure over the period 2003–2017 and represents the maximum amount of nitrogen available for mobilization on an annual scale. As such, we do not make any assumptions about how much of each individual nitrogen input (deposition, fertilizer, or manure) may accumulate over time (including annual retention versus export via gas or water fluxes or in crops). We recognize that, while our estimate may somewhat over- or underestimate existing total nitrogen stocks, it is a reasonable approximation for assessing broad spatial patterns and the relative risk of nutrient export from areas across the contiguous United States.
2.1.3. Total phosphorus pools
We combined maps of fertilizer and manure phosphorus application [77] and topsoil phosphorus [76] to create a map of total phosphorus pools across the contiguous US. We estimated topsoil phosphorus (0–5 cm; kg P ha−1) using US Geological Survey (USGS) total soil phosphorus concentration (mg P kg soil−1) [76] and soil bulk density data [84] (kg ha−1; figures S2(a) and (b); See S1 and figure S7 for details on estimating Ptopsoil). We obtained estimates of fertilizer and manure phosphorus inputs from IPNI NuGIS [77]. We used data for 2007, 2010–2014 at the county level in kg P ha−1 (figures S8 and S9) and averaged annual data to obtain a mean annual phosphorus input from fertilizer and manure (figures S2(c) and (d); see S1 for more detail).
We estimated total soil phosphorus (Psoil) as:

where Ptopsoil is topsoil phosphorus (equation (S1); kg P ha−1; 0–5 cm), Pfert is fertilizer phosphorus (kg P ha−1 yr−1), and Pmanure is manure phosphorus (kg P ha−1 yr−1). Total soil P estimates represent the average soil phosphorus pool for a representative year during 2003–2017. This simplified mass balance approach combined topsoil phosphorus estimates with the average annual phosphorus inputs from fertilizer and manure to represent the maximum amount of phosphorus (dissolved and particulate) available for mobilization on an annual scale. As for nitrogen we make no assumptions about how phosphorus accumulates over time.
2.1.4. Identifying hotspots of water quality risk
We combined rain-on-snow and nutrient source maps to identify regions of the contiguous US at high risk of rain-on-snow-induced nutrient export. We selected a minimum rain-on-snow frequency threshold of 1 event in four years (0.25 events yr−1) to capture spatial locations that experience large, relatively frequent, rain-on-snow events, based on emerging research [1, 13, 62, 63] and preliminary data from the Hungerford Brook watershed in Vermont (figure S10) showing that initial, relatively infrequent (within a year) rain-on-snow events have disproportionately high nitrate fluxes relative to subsequent spring snowmelt pulses. Next, we identified areas susceptible to rain-on-snow with nitrogen pools >4.8 tons ha−1 and/or phosphorus pools >0.3 tons ha−1. These threshold values represent the median nitrogen and phosphorus pool values based on histogram analyses of the total nutrient pool maps (figures 2(b) and (c)). We designated these areas as 'high N' and 'high P' for the purposes of classifying at-risk areas with large nutrient pools.
2.2. Case study—2019 rain-on-snow flooding in the US Mississippi River watershed
Because our spatial analysis identified the Mississippi River as the largest US watershed impacted by rain-on-snow, we examined the impacts of the March 2019 rain-on-snow flood event (approximately 8–14 March) in this watershed (black outlines, figure 2) using flow, turbidity, and nitrate data from three USGS monitoring locations within the watershed : (a) the lower Mississippi River at Baton Rouge, Louisiana; (b) the upper Mississippi River at Clinton, Iowa; and (c) the lower Missouri River at Hermann, Missouri (table 1). Nitrate data contained many missing values (table 1), specifically around the March 2019 event, and so were not a focus of our analysis and discussion of this event (but see figure S11). However, to investigate the capacity of this event to transport sediment, we examined turbidity concentration-discharge relationships [73, 85] for the Lower Missouri and Upper Mississippi Rivers (see S1 for more detail).
Table 1. Location, information, and date ranges (with percent missing data) for data from the three USGS gage locations within the Mississippi River watershed.
| Gage location (Lat, Long) | Gage # | Discharge range in years (% missing data) | Turbidity range in years (% missing data) | Nitrate range in years (% missing data) |
|---|---|---|---|---|
| Lower Missouri at Hermann, MO (38.701°, −91.439°) | 06934500 | 1928–2019 (0%) | 2006–2019 (18%) | 2015–2019 (27%) |
| Upper Mississippi at Clinton, IA (41.781°, −90.252°) | 05420500 | 1928–2019 (0%) | 2015–2019 (20%) | 2017–2019 (28%) |
| Lower Mississippi at Baton Rouge, LA (30.446°, −91.192) | 07374000 | 2004–2019 (<1%) | 2011–2019 (32%) | 2011–2019 (19%) |
3. Results and discussion
Overall, we show that one type of winter runoff event, rain-on-snow, increases the risk of large winter nutrient exports to downstream waters. Because our results highlight how little we know about the impacts of winter events, we discuss the urgent need to quantify the risks and impacts of winter runoff on nutrient transport and water quality.
3.1. More than 40% of the contiguous US at risk of nutrient export from rain-on-snow
We found that half of the nitrogen and phosphorus pools in the contiguous US are in areas with historically large, relatively frequent rain-on-snow events, and thus are vulnerable to export during winter months (table 2). In total, 4.1 million km2, or 53%, of the contiguous US experiences rain-on-snow events capable of generating floods (figure 2(a), table 2). Importantly, as rain-on-snow is only one type of winter runoff event, and winter rainfall is also capable of generating large floods and nutrient transport [13, 30], this is likely a conservative estimate of the full potential of winter runoff events to impact nutrient transport and water quality. While rain-on-snow events broadly affect the US across diverse land use, land cover, and topography, rain-on-snow events are most frequent (>3 yr−1) in the northeastern US and western mountains (red colors; figure 2(a)). Across the north-central US and Mississippi River watershed (red and orange areas within black outline; figure 2(d)), large rain-on-snow events are relatively common, occurring every 1–4 yrs (figure 2(a)). The widespread occurrence of rain-on-snow events across diverse US landscapes is consistent with datasets from around the world [11, 32, 82] and winter rainfall and runoff have increased in seasonally snow-covered regions in the US and around the globe [1, 10, 11, 72].
Table 2. Percent of land area with rain-on-snow (ROS) frequency greater than a given critical threshold, and the corresponding percent of total nitrogen (TN), total phosphorus (TP), and total nitrogen and phosphorus pools located within that land area.
| ROS frequency (days yr−1) threshold | % of land area | % of TN sources | % of TP sources | % of TN and TP sources |
|---|---|---|---|---|
| 0.1 | 72.79 | 77.8 | 76.69 | 77.72 |
| 0.25 | 52.83 | 59.31 | 56.67 | 59.14 |
| 0.5 | 33.59 | 38.49 | 36.61 | 38.36 |
| 1 | 16.29 | 18.9 | 16.55 | 18.74 |
| 3 | 5.05 | 5.62 | 4.71 | 5.56 |
| 5 | 2.44 | 2.73 | 2.35 | 2.71 |
| 8 | 0.97 | 1.16 | 0.96 | 1.15 |
| 12 | 0.46 | 0.6 | 0.4 | 0.59 |
| 16 | 0.24 | 0.31 | 0.17 | 0.3 |
| 36 | 0 | 0 | 0 | 0 |
Overlaying rain-on-snow frequencies (figure 2(a)) on potential sources of nitrogen and phosphorus (figures 2(b) and (c)) revealed that over 80% (3.3 million km2) of the continental US that experiences large rain-on-snow events has substantial nitrogen (>4.8 tons N ha−1) and/or phosphorus (>0.3 tons P ha−1) reservoirs (43% of the contiguous US; figure 2(d)). The overlap between large rain-on-snow events and substantial nitrogen or phosphorous pools covers 32% and 29% of the contiguous US, respectively. Specifically, areas receiving large rain-on-snow events overlap with large nitrogen pools in the northeastern and north-central US and areas of the mountainous western US (figure 2(b), orange and brown colors). Large rain-on-snow events co-occur with substantial phosphorus pools in the north-central US and areas of the western US (figure 2(c), orange and brown colors).
The overlap between large rain-on-snow events and nutrient-rich soils is increasingly troubling, as mounting evidence suggests that rain-on-snow and winter rainfall transport large amounts of dissolved and sediment-bound nitrogen and phosphorus. Research in small, forested watersheds suggests that nutrient and sediment export during winter rainfall and rain-on-snow events can be very high—accounting for up to 25% of annual nitrate export and exporting as much or more sediment-bound nutrients than large summer runoff events [1, 62, 63]. Further, research in agricultural and forested watersheds found that winter rainfall and snowmelt exported the highest nitrate concentrations and loads of the year and export was consistently high, both within and between events, suggesting that nitrate transport to streams was not limited by terrestrial nitrate supplies [13]. Additionally, snowmelt, rainfall, and rain-on-snow events across the US, Canada, Europe, and Sweden have recently been found to drive nitrogen and phosphorus export from agricultural lands via runoff and subsurface drainage [13, 45, 72]. Furthermore, research using high-frequency sensors in temperate, but snow-free, watersheds often find nutrient concentrations and/or export is highest during winter, citing high soil moisture combined with reduced plant water and nutrient uptake and stream processing as potential reasons for elevated losses [86–90].
Our analyses reveal that climate, soils, atmospheric pollution, land use, and land cover interact to produce a large, semi-continuous swath of the country at high risk of wintertime nutrient export (figure 2(d)). Nearly half of the land area in the contiguous US is vulnerable to large wintertime export via rain-on-snow (figures 2(b) and (c); table 2). Combining potential nitrogen (figure 2(b)) and phosphorus (figure 2(c)) source maps allows for the delineation of areas that are most vulnerable to nutrient losses during large rain-on-snow events (figure 2(d), red areas). Water quality may be particularly vulnerable where agricultural nutrient inputs are high and rain-on-snow events are relatively frequent, such as in the north-central US and portions of the northeastern US (figure 2(d), warm colors). The Mississippi River watershed, the largest river system in the US, which drains 40% of the contiguous US and includes some of the nation's most productive farmland, is of particular concern with respect to runoff and water quality. Approximately 65% of the Mississippi River watershed is prone to large rain-on-snow events. Of this area, 43% also has large soil nutrient pools (23% of the watershed; figure 2(d)). This exposure represents an ongoing, but unquantified threat to water quality within the Mississippi River system and Gulf of Mexico, ecosystems already vulnerable to nutrient pollution. Even in undeveloped montane regions in the northeastern and western US (figure 2(d)), rain-on-snow events may impact nutrient inputs to streams and rivers that are heavily relied upon for downstream water resources by mobilizing atmospherically deposited nitrogen sources from soils with low nutrient holding ability [91] (figure S1(b)). These mountain regions include source waters for some of the nation's largest metropolitan areas and agricultural industries.
3.2. The 2019 rain-on-snow flooding in the US Mississippi River watershed
A March 2019 rain-on-snow flood event in the Mississippi River watershed (black outline, figure 2) provides a poignant example of how shifting winter dynamics and rain-on-snow can have widespread cascading environmental impacts (figure 3, S12), as suggested by our conceptual model (figure 1) and spatial analysis (section 3.1). Between 8–14 March 2019, much of the 3.2 million km2 watershed experienced heavy rain and snowmelt (figure S13), which led to economically and environmentally devastating flooding [92]. In particular, eastern Nebraska, western Iowa, and southeastern South Dakota suffered devastating floods that destroyed roads, bridges, and dams [93]. Yet the impact of this event was wide-reaching—river flows for the Missouri and upper and lower Mississippi Rivers were some of the highest on record (figures 3(a)–(c)).
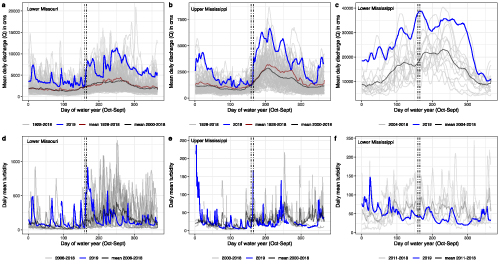
Figure 3. Mean daily discharge and turbidity historically and during the 2019 water year for three locations in the Mississippi watershed: the lower Missouri (USGS Gage 06934500; discharge in panel (a), turbidity in panel (d)), the upper Mississippi above the confluence with the Missouri (USGS Gage 05420500; discharge in panel (b), turbidity in panel (e)), and the Mississippi near its outlet at Baton Rouge, Louisiana (USGS Gage 07374000; discharge in panel (c), turbidity in panel (f)). The dark gray lines (one per panel) show the historical mean daily or cumulative discharge. Dashed vertical lines show the beginning and end of the March 2019 rain-on-snow event. Note that the hardest hit areas (eastern Nebraska, western Iowa, and southeastern South Dakota) were in the Missouri River watershed. Line breaks in the turbidity data (e.g. in the blue line just after the rain-on-snow event in panel (e)) indicate missing data.
Download figure:
Standard image High-resolution imageThe flood-prone region impacted by this event has soils with large amounts of nitrogen and phosphorus (figures 2(b)–(d)) that can be flushed from nutrient rich hotspots or eroded with soils during runoff events and exported to downstream surface waters, including the Gulf of Mexico. Turbidity data indicate that a large quantity of sediment was mobilized by this event (figures 3(d) and (e)), although this sediment may not have reached the outlet of the Mississippi until later in the year (figure 3(f)). Furthermore, turbidity concentration-discharge relationships suggest that streamflow during the 2019 rain-on-snow event was particularly enriched in sediment compared to long-term average flows (i.e. the turbidity concentration-discharge slope increased during the event relative to long-term average slopes; figure 4). This sediment transport is likely coupled with nitrogen and phosphorus transport. The nitrate time series (figures S11(a) and (b)), although incomplete during the rain-on-snow event, suggests elevated nitrate transport, and particle-bound phosphorus export in agricultural watersheds typically tracks patterns in sediment transport [94]. Overall, this highlights the potential for rain-on-snow to export nutrients and sediment at disproportionally high rates.

Figure 4. Turbidity-discharge relationships for the Lower Missouri and Upper Mississippi rivers show that the slope of this relationship was steeper during the March 2019 rain-on-snow (ROS) event than for historical data. Panels show log10 transformed mean daily turbidity concentrations plotted against log10 transformed mean daily discharge (Q) in cubic meters per second (cms). Data from the Lower Missouri River is shown in panels (a) and (c), with linear regressions for (a) all data (2006–2019 water years, gray points, black solid line) compared to the 2019 rain-on-snow event (black points, black dashed line) and (c) all data by season (gray points, gray lines) compared to the 2019 rain-on-snow event (black squares, black dashed line). Data from the upper Mississippi River is shown in panels (b) and (d), with linear regressions for (b) all data (2015–2019 water years; gray points; black solid line) compared to the 2019 rain-on-snow event (black points; black dashed line) and (d) all data by season (gray points, gray lines) compared to the 2019 rain-on-snow event (black squares, black dashed line). Shaded areas are 95% confidence intervals. To develop the 2019 event relationship, we included data from the first rising and first falling limbs of the hydrograph for the Lower Missouri (8–23 March) and the Upper Mississippi (10–18 March) around the rain-on-snow event.
Download figure:
Standard image High-resolution imageNutrients transported by the Mississippi River during the March 2019 rain-on-snow event likely impacted water quality. By August 2019, the Gulf of Mexico hypoxic 'dead zone'—a region where algal blooms, triggered by nutrient enrichment, results in oxygen levels too low to support many aquatic species [95]—was the eighth largest on record [96]. While there were likely many factors that contributed to the formation of this large dead zone, such as a buildup of soil nutrients within the watershed due to nitrogen-fertilization surpluses and growing season droughts [97, 98], consistent increases in winter floods, runoff, and winter discharge (figure 5) were also likely contributors. While the available turbidity data align with our conceptual model (figure 1) and spatial analysis of nutrient transport risk (figure 2(d)) by suggesting that winter runoff-generating events such as this one transport large pulses of nutrients with important downstream impacts, we lack sufficient data (e.g. missing nitrate data in figure S11) to quantitatively understand or predict how winter events alter nutrient transport and downstream water quality.

Figure 5. Increasing cumulative winter discharge (1 November–31 March), from 1928 to 2021 for (a) the lower Missouri at Herman, Missouri (USGS Gage 06934500) and (b) the upper Mississippi above the confluence with the Missouri at Clinton, Iowa (USGS Gage 05420500). Shaded areas are 95% confidence intervals.
Download figure:
Standard image High-resolution image
4. Conclusions and critical needs
We show that over 40% of the contiguous US is at risk of nutrient export from large rain-on-snow events. Importantly, our results are a conservative estimate of risk, as other types of winter runoff-generating events are also capable of generating floods and nutrient export [13, 30]. Further, data from the 2019 Mississippi River rain-on-snow event suggests these events transport large quantities of sediment and nutrients. Thus, we provide a conceptual framework for winter nutrient transport with testable hypotheses (figure 1), to serve as a starting point for developing a mechanistic, predictive understanding of winter nutrient transport and its impacts on water quality.
Wintertime runoff-producing events pose an ongoing and increasing [99] risk to water quality in snow-covered regions, but we lack sufficient measurements to accurately monitor and characterize nutrient sources, pathways, and total winter nutrient transport. Further, modeling [45, 100, 101] of winter hydrology remains inadequate. There is a critical need for data and modeling tools to test new frameworks (e.g. figure 1) for accurate prediction and management of watershed- to continental-scale winter flooding, nutrient transport, and water quality.
First, to measure and predict the impacts of winter events, we need coincident, watershed-scale monitoring of precipitation magnitude and phase (i.e. rain versus snow), snow water equivalent and event-induced snowmelt, soil temperature, soil moisture, and soil nutrient concentrations, streamflow, and stream water chemistry. We need these data from watersheds spanning land uses/land covers (particularly agricultural and urban, which are often underrepresented). Traditional aquatic sampling systems or sensor networks are designed to capture ice-free conditions and are often unable to monitor cold and frozen winter dynamics, leaving winter nutrient fluxes under-documented. Year-round observation networks are critical to inform and verify model-based simulations of the coupled physical systems.
Second, we must better monitor and understand downstream impacts of winter nutrient inputs on the biogeochemistry and ecology of aquatic and terrestrial ecosystems. Because the timing of nutrient inputs regulates terrestrial and aquatic plant productivity [102, 103], the ecological implications of shifting nutrient transport from spring to winter is likely large and varied across land use and land cover types. Furthermore, ecological and water quality impacts likely vary with receiving water properties, including trophic state, thermal stratification, fresh vs. salt water, and watershed:lake area ratio, and position of receiving waters within the watershed (e.g. mid-watershed vs. terminus) [2, 104, 105].
Finally, our lack of knowledge about winter event nutrient export may result in biased predictions of watershed exports [45]. Nutrient transport models often rely on empirical concentration-discharge relationships developed from data collected during the snow-free season [106] and are thus unlikely to provide accurate estimates of wintertime nutrient transport (e.g. figure 4). Winter nutrient sources, sinks, and the flowpaths between them are likely different than during the growing season, when plant and microbial uptake are substantial nutrient sinks [34, 107, 108]. In winter, vegetation is dormant and agricultural lands may be unvegetated, but active microbes can still produce mobile nutrients for transport to aquatic systems [34, 109]. Furthermore, the depth and spatial extent of frozen soil impacts infiltration of snowmelt and rainfall runoff to streams [66, 67], and the timing of soil-thawing relative to rainfall can determine the magnitude of sediment fluxes [63] Thus, watershed models developed for the growing season may be inaccurately predicting winter nutrient transport to downstream aquatic systems.
The assumption that discharge and nutrient transport remains low during the winter months no longer holds [4, 12]. Winter flood events, like the March 2019 US flood in the Mississippi watershed, are having large, but often unmeasured impacts, now and are becoming more common [79]. Given that snow covered zones provide water resources for much of the world, the potentially disproportionate importance of winter events on nutrient transport necessitates that we expand watershed research to develop a comprehensive and quantitative understanding of the impacts of midwinter runoff events on nutrient transport and water quality.
Acknowledgments
This material is based upon work supported by the National Science Foundation under VT EPSCoR Grant No. NSF OIA 1556770. This research was also supported by the US EPA under an assistance agreement (LC00A00695-0) to NEIWPCC in partnership with the Lake Champlain Basin Program, NSF Award Number EAR2012080, NSF Award Number EAR2012123, and NOAA Award Number NA19OAR4310280. Thanks to Dr William Hargrove for generously providing the spatial total soil nitrogen data. We also thank Dr Robert Sabo and anonymous reviewers for providing thoughtful feedback to improve this manuscript.
Data availability statement
The data that support the findings of this study are openly available at the following URL/DOI: https://portal-s.edirepository.org/nis/metadataviewer?packageid=edi.636.1 [110].
Code availability
All code used for data analysis and figure generation is available at: https://portal-s.edirepository.org/nis/metadataviewer?packageid=edi.636.1.
Conflict of interest
The authors declare no competing interests.
Supplementary data (2.8 MB PDF)