The Mangrove Forests Change and Impacts from Tropical Cyclones in the Philippines Using Time Series Satellite Imagery


1
Institute of Space and Earth Information Science, The Chinese University of Hong Kong, Shatin, N.T. 999077, Hong Kong
2
Philippine Council for Industry, Energy and Emerging Technology Research and Development (PCIEERD), DOST Compound, Taguig 1631, Philippines
3
Shenzhen Research Institute, The Chinese University of Hong Kong, Shenzhen 518057, China
4
School of Geography and Environment, Jiangxi Normal University, Nanchang 330022, China
*
Author to whom correspondence should be addressed.
Remote Sens. 2019, 11(6), 688; https://doi.org/10.3390/rs11060688
Submission received: 3 February 2019
/
Revised: 19 March 2019
/
Accepted: 20 March 2019
/
Published: 22 March 2019
(This article belongs to the Special Issue Advances of Multi-Temporal Remote Sensing in Vegetation and Agriculture Research)
Abstract
:The Philippines is rich in mangrove forests, containing 50% of the total mangrove species of the world. However, the vast mangrove areas of the country have declined to about half of its cover in the past century. In the 1970s, action was taken to protect the remaining mangrove forests under a government initiative, recognizing the ecological benefits mangrove forests can bring. Here, we examine two mangrove areas in the Philippines—Coron in Palawan and Balangiga-Lawaan in Eastern Samar over a 30-year period. Sets of Landsat images from 1987 to 2016 were classified and spatially analyzed using four landscape metrics. Additional analyses of the mangrove areas’ spatiotemporal dynamics were conducted. The impact of typhoon landfall on the mangrove areas was also analyzed in a qualitative manner. Spatiotemporal changes indicate that both the Coron and Balangiga-Lawaan mangrove forests, though declared as protected areas, are still suffering from mangrove area loss. Mangrove areal shrinkage and expansion can be attributed to both typhoon occurrence and management practices. Overall, our study reveals which mangrove forests need more responsive action, and provides a different perspective in understanding the spatiotemporal dynamics of these mangrove areas.
1. Introduction
Mangroves are an assemblage of tropical and sub-tropical halophytic (i.e., salt tolerant) woody plants. Mangrove forests are recognized as one the most productive forest ecosystems in the world and unique in linking terrestrial and marine systems through the intertidal zone [1]. It also provides different ecological services such as shelter for marine fauna and protection from strong waves during tsunamis and storm surges. Mangroves are one of the most carbon-rich forests in the tropical ecosystem, more so than tropical rainforests [2]. However, economic development and climate change poses an eminent threat of destruction to many mangrove forests, hence, monitoring of the remaining mangrove forest cover is now more critical than ever.
Natural disasters such as earthquakes, tsunamis, storm surges and typhoons can contribute to widespread destruction in many parts of the world. In the Philippines, one of the most frequent major natural disasters are tropical cyclones. The country is known as a gateway for tropical cyclones coming from the Pacific Ocean. In recent decades, the intensities of tropical cyclones that have made landfall in the country have increased. About 20 tropical cyclones enters the Philippine Area of Responsibility (PAR) annually, nine of which traverse the country [3]. Many study on the observed trends and impacts of tropical cyclones in the Philippines reveal that extreme tropical cyclones are becoming more frequent [3]. Typhoon events in the Philippines annually causes severe impacts and economic losses, damage to property, death and environmental degradation. Super typhoon Haiyan in 2013 devastated the Philippines, leaving behind massive damage and loss of [4]. It also caused significant damage to the mangrove forests of the country. The storm surge triggered by Typhoon Haiyan uprooted many mangrove trees as the typhoon traversed the central islands of the Philippines.
Anthropogenic impacts to mangrove forests, while not immediate and tangible like natural disasters, are nonetheless significant when compounded over time. From the early 1950s to the 1970s, the Philippine government boosted its fisheries sector by encouraging the establishment of aquaculture or fish ponds all over the country [5]. Alongside the expansion of these aquaculture areas have been the diminishment of the mangrove cover. Primavera conducted a correlation analysis of the decline of the Philippine mangroves with the increase of fish pond development from 1976 to 1994, showing that the main reason for the destruction of the mangroves is the construction of fishpond structures [6]. The development of the fishponds is not the only reason behind the destruction to the mangrove forest; the cutting and harvesting of mangrove trees for charcoal production and house construction is also significant. Human activities can indeed be a major contributor to the loss of mangrove forests, but there are also policy initiatives to recover the damages, as well as programs and projects that will protect and conserve the mangrove forests. In the later part of the 1970s, the Philippine government shifted its attention to protect the remaining mangrove forest cover of the country [7]. Following this, numerous policies and development programs were established that promoted the restoration of the mangrove forests from abandoned and underused fishponds areas and continuous efforts of mangrove reforestation projects that are still active today.
Remote sensing is a widely used tool for environmental studies since it can provide geospatial information and several characteristics that can be useful to better understand the spatial dynamics of the environment. There are different satellite images that can be freely accessed at a wide range of resolutions and time scales. Time series of satellite images are useful for spatiotemporal analyses that can provide significant observations of the land use and land cover changes of a certain environment over time. The use of satellite remote sensing to map mangroves has become widespread as it can provide accurate, efficient, and repeatable assessments [1]. There are several major advantages of remote sensing monitoring of mangrove forests. First, remote sensing is able to obtain the mangrove distribution at a large scale, from tens of hectare to millions of hectares [8,9]. Second, the cost of satellite remote sensing over mangrove forests is much lower than a traditional field survey, especially when an increasing number of satellites are making observations with freely accessible data. Third, it is possible to discriminate different species of mangroves using various high resolution remote sensing images [10,11,12]. Fourth, using long term observations from satellites since 1972, remote sensing is able to analyze the historical changes over recent decades. Finally, with the rapid development of both optical and SAR remote sensing from space borne and air borne platforms, it is becoming more and more feasible to use remote sensing to estimate the mangrove biomass. Overall, different remote sensing tools and techniques can provide good estimates of the areal extent of mangrove forests and can observe changes by using spatiotemporal Landsat datasets.
Remote sensing technology provides an opportunity to conduct investigations of the long-term changes in mangroves forests. In this study, we present an analysis of the long-term changes of the Philippine mangrove forests. Our study intends to (1) investigate the long-term spatial characteristics of two typical mangrove areas in the Philippines—Coron in Palawan and Balangiga-Lawaan in Eastern Samar using remote sensing technology, and (2) investigate the possible reasons of these changes from the impacts of tropical cyclones in a qualitative manner.
2. Materials and Methods
2.1. Study Areas and Data Set
2.1.1. Study Areas
The Philippines, located in Southeast Asia, is an archipelagic country which is comprised of more than seven thousand islands. The country has a lush biodiversity, among 17 megadiverse countries of the world [13]. With an extensive coastline over 36,289 km long, the Philippines ranks 5th among the countries with the longest coastline in the world [6,7]. Mangroves along these coastlines provide various coastal resources that provide food and livelihood to many Filipinos. At least fifty percent of the world’s approximately 65 mangrove species are in the Philippines [6]. Moreover, based on the 2010 global mangrove forests distribution, Philippines ranks 15th of the most mangrove-rich countries in the world (6th in Asia). [8].
The earliest estimate of the Philippine mangroves was in 1920s when the country had as much as 400,000 to 500,000 hectares. This area had declined by 1994, to an estimated 120,000 ha [5,6]. An estimate by the Forest Management Bureau in 2007 reported a substantial increase of the mangrove cover to as much as 247,362 ha. Remote sensing was applied for appraisal of the mangrove areas of the country and made comparison to other published references [14]. The trend generally showed a significant decrease of the mangrove forest cover over time. The main contributors to the decrease of the mangrove forest cover in the Philippines were found to be due to both the natural and man-made causes. Threats to the Philippine mangroves are: aquaculture expansion, urban development, conversion to agriculture, overharvesting for industrial uses such as timber and charcoal, and climate change [6,15].
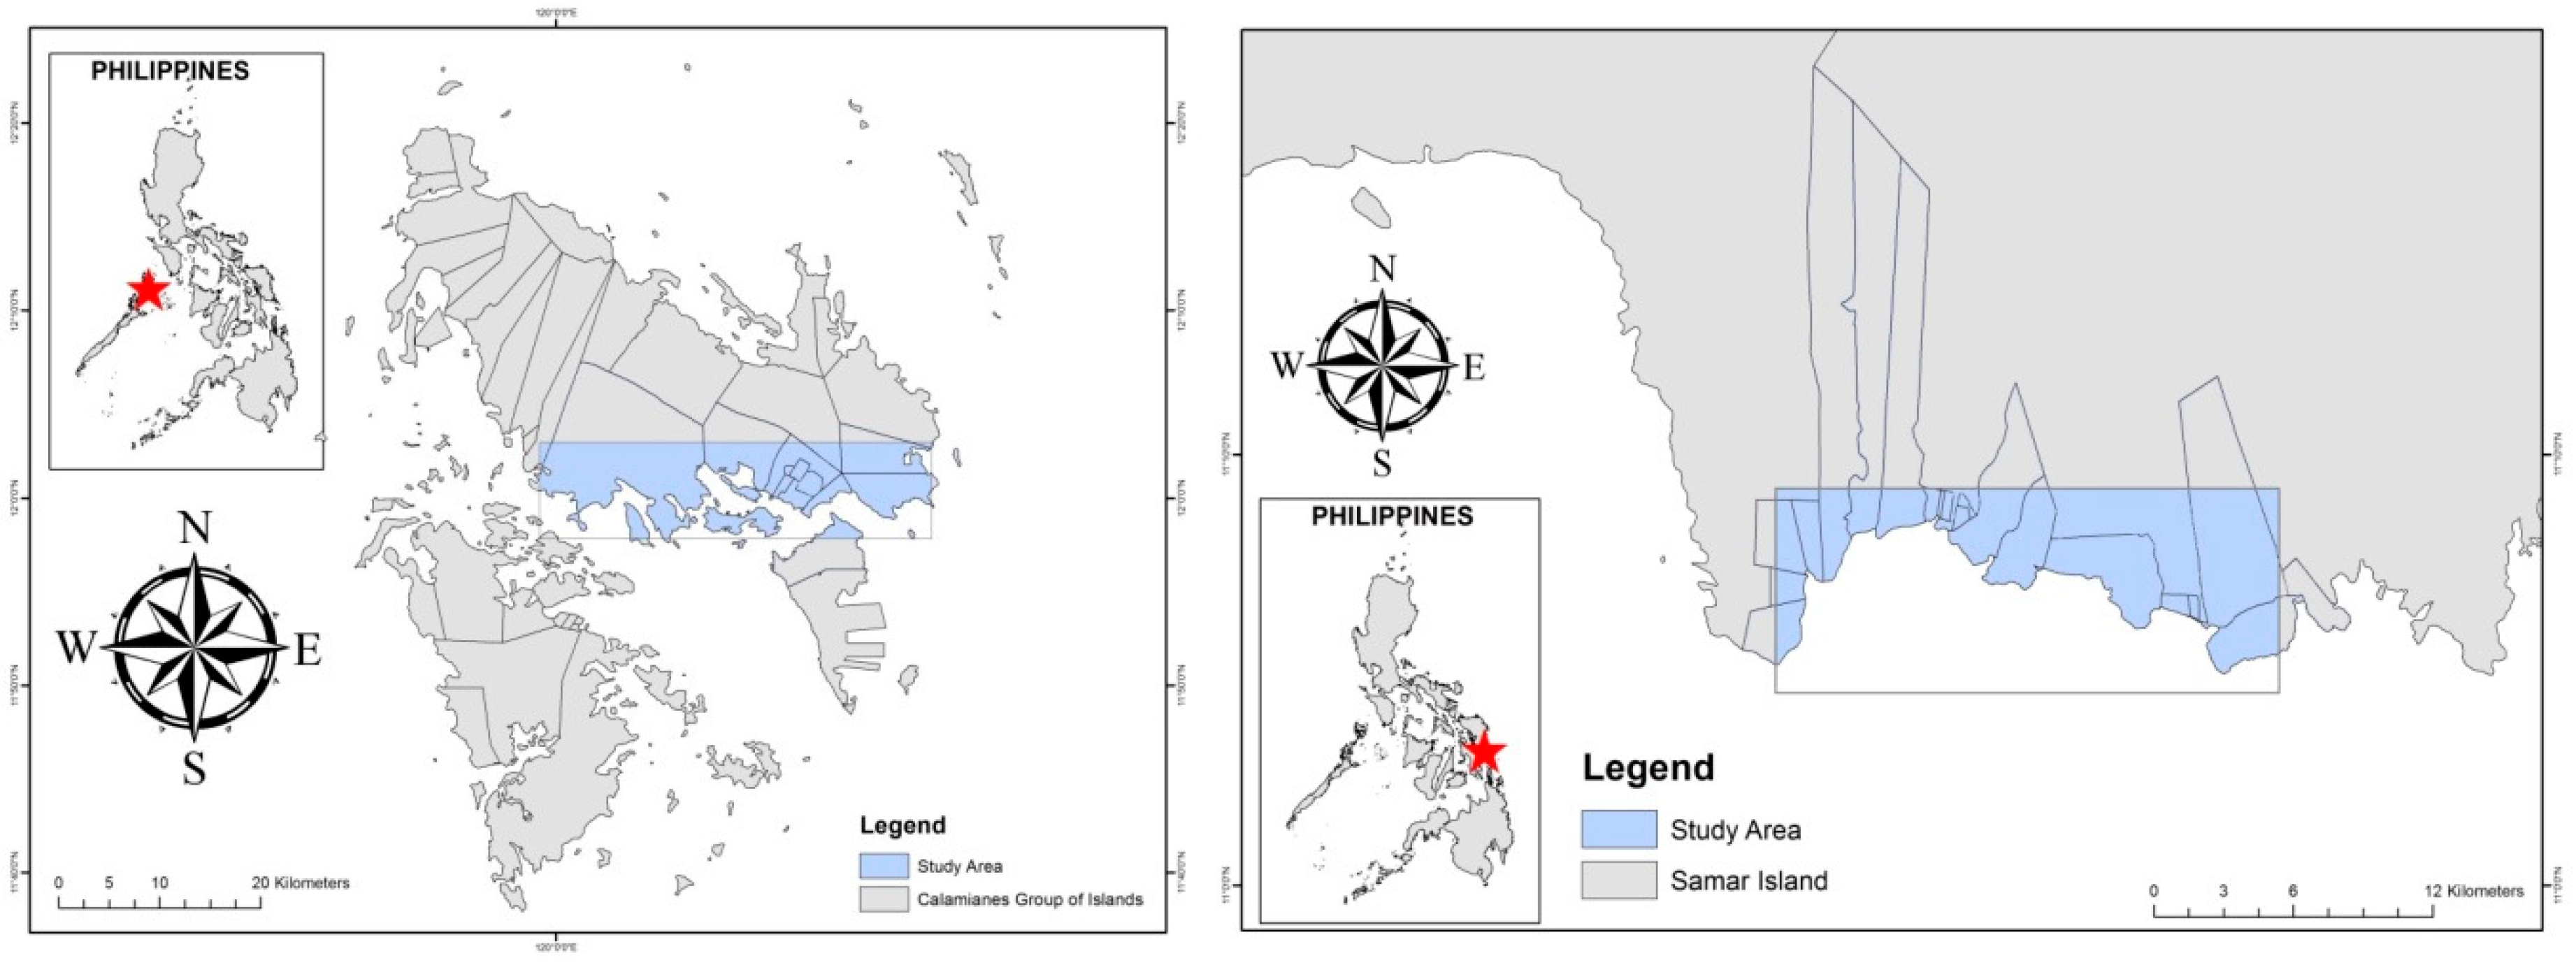
In this study, we examine the long-term changes of mangroves forest in the Philippines using a long-term series of clear-sky Landsat images over the mangroves areas. However, Philippine is in a tropical region which encounters a lot of clouds annually. Therefore, we carefully searched the Landsat database over the Philippines to determine the areas with the best and clearest Landsat images. Another important constraint for our site selection is to explain the impacts of tropical cyclones to mangrove forests. Detailed information about tropical cyclones is typically not made public from the local government; however, we have had some previous collaboration with the local government department of the Climatology and Agrometeorology Division (CAD) of the Philippine Atmospheric, Geophysical and Astronomical Services Administration (PAGASA), who were able to provide us detailed records about tropical cyclones over some areas. We therefore choose two areas in which to perform a comparative study. Each study area possesses unique qualities that are useful for comparison. Figure 1 shows the geographic location of the two study areas in the Philippines. The provinces of Palawan and Eastern Samar lie on the western and eastern side of the Philippines, respectively.
The climate in Coron has two pronounced seasons–dry from November to April and wet during the rest of the year, based on the Modified Coronas Classification used by PAGASA [16]. Coron’s topography features a rugged and mountainous terrain with a generally moderate slope of 8–15%. Its coastal areas are generally less than 50 m in elevation. An in-depth survey reported in 2006 found 24 true and 28 associate mangrove species in the Busuanga Island, wherein 4 species each are commonly observed in the seaward and middleward zones including: Rhizophora mucronata, Sonneratia alba, Rhizophora stylosa and Sonneratia caseolaris (seaward), Rhizophora apiculata, Bruguiera gymnorrhiza, Bruguiera cylindrical and Bruguiera sexangula (middleward). Landward zone species include Xylocarpus granatum, Heritiera littorea, Ceriops decandra, Lumnitzera littorea, Ceriops tagal, Bruguiera parviflora and Excoecaria agallocha. Furthermore, the average mean diameter of the mangrove forest is 22.80 cm, while average mean height is 9.65 m [17].
Eastern Samar, on the other hand, experiences no dry season. There is a very pronounced maximum rain period from December to February, and a minimum rainfall period occurring during March to May [16]. Mangroves in this area are fringing and predominantly located along shoreline and river banks. Species present are Rhizophora apiculata, Rhizophora mucronata, Sonneratia alba, Xylocarpus granatum, Scyphiphora hydrophyllacea, Nypa fruticans, Ceriops species, and Brugeriera species [18,19].
2.1.2. Satellite Data and Preprocessing
The mangrove areal extents were determined using sets of Landsat images from the United States Geological Survey (USGS) in a 30-year period from 1987 to 2016. There is a difference in the number of images used which is mainly due to the availability of the cloud-free images for each site. ENVI ver. 4.8 software (Exelis Visual Information Solutions) was used for the supervised image classification and the classified images were validated using Google Earth images. In Google Earth, historical very high resolution satellite images were employed to produce reference data for validation. The Keyhole Markup Language (KML) file format was used to prepare the Landsat images to be overlaid on Google Earth. In this manner, the mangrove and non-mangrove areas were able to be identified through high resolution images in Google Earth. This allows the selection of reference data using the polygon function in Google Earth for different classes, which will be exported as KML files and used for the classification in ENVI.
Pre-processing was done in preparation for image classification. The different Landsat images came from different sensors, therefore, various radiometric corrections and geometric corrections were applied [20]. However, atmospheric corrections were not applied to the time-series images in this study, since we employed a post-classification change analysis strategy where the atmospheric differences of different sensors at different times can be reduced after the classification of each image [20]. Images from Landsat 8 OLI were stacked in layers followed by the creation of subsets for each image. Ground control points (GCP) were collected manually for all the time-series images to conduct co-registration to make sure all the images at different time were under the same georeferenced system [20,21]. However, clouds were not removed in this study due to technical difficulty, instead, we identify clouds as a special class during the classification. Cloud contamination in Landsat images still remains a challenging issue, especially in a tropical region of the Philippines [22]. Therefore, we tried to select those images without clouds in our study areas. There were still some small areas of clouds in our selected images, but mostly they are not covering the mangrove forests, which can be seen in Figure 2 and Figure 3. These clouds only occurred over the non-mangrove areas.
2.1.3. Tropical Cyclone Data and Preprocessing
The historical data of tropical cyclones that affected the provinces of Palawan (specifically Busuanga Island) and Eastern Samar from 1987 to 2016 were used to assess their influence on the of mangrove forests. All available historical data during this period were obtained from the Climate and Agromet Data Section (CADS)—Climatology and Agrometeorology Division (CAD) of the Philippine Atmospheric, Geophysical and Astronomical Services Administration (PAGASA). The tropical cyclones considered for the study are those that made landfall on the two mangrove areas and those tropical cyclones that may have no direct landfall on the municipalities under study but still affected the regions of interest.
2.2. Mangroves Classification
Several methods have been proposed and applied to the classification of mangrove forests at both community and species levels [1,23,24,25]. Among all existing methods, the support vector machine (SVM) technique, a linear supervised non-parametric learning algorithm, is among the best methods due to its effective use of limited numbers of training data sets [9,12,23,26]. Therefore, SVM was employed as the classifier in this research and two key parameters, the Gamma of the kernel function, (e.g., radial basis function) and the penalty parameter for non-linear cases, were optimized with a cross-validation strategy according to previous studies [9,10]. The series of Landsat images were classified into four categories: mangroves, non-mangroves land cover, sea water and clouds. A random sampling with a minimum of 200 pixels created for each class for each image was applied to assess the accuracy of the classification results. The overall accuracy, kappa coefficient, and both producer’s and user’s accuracy were derived. Mangrove area coverage derived from the class statistics of each year were plotted to visualize the trends of increase and decrease of the mangrove areas.
2.3. Spatial and Temporal Analysis of Mangrove Change
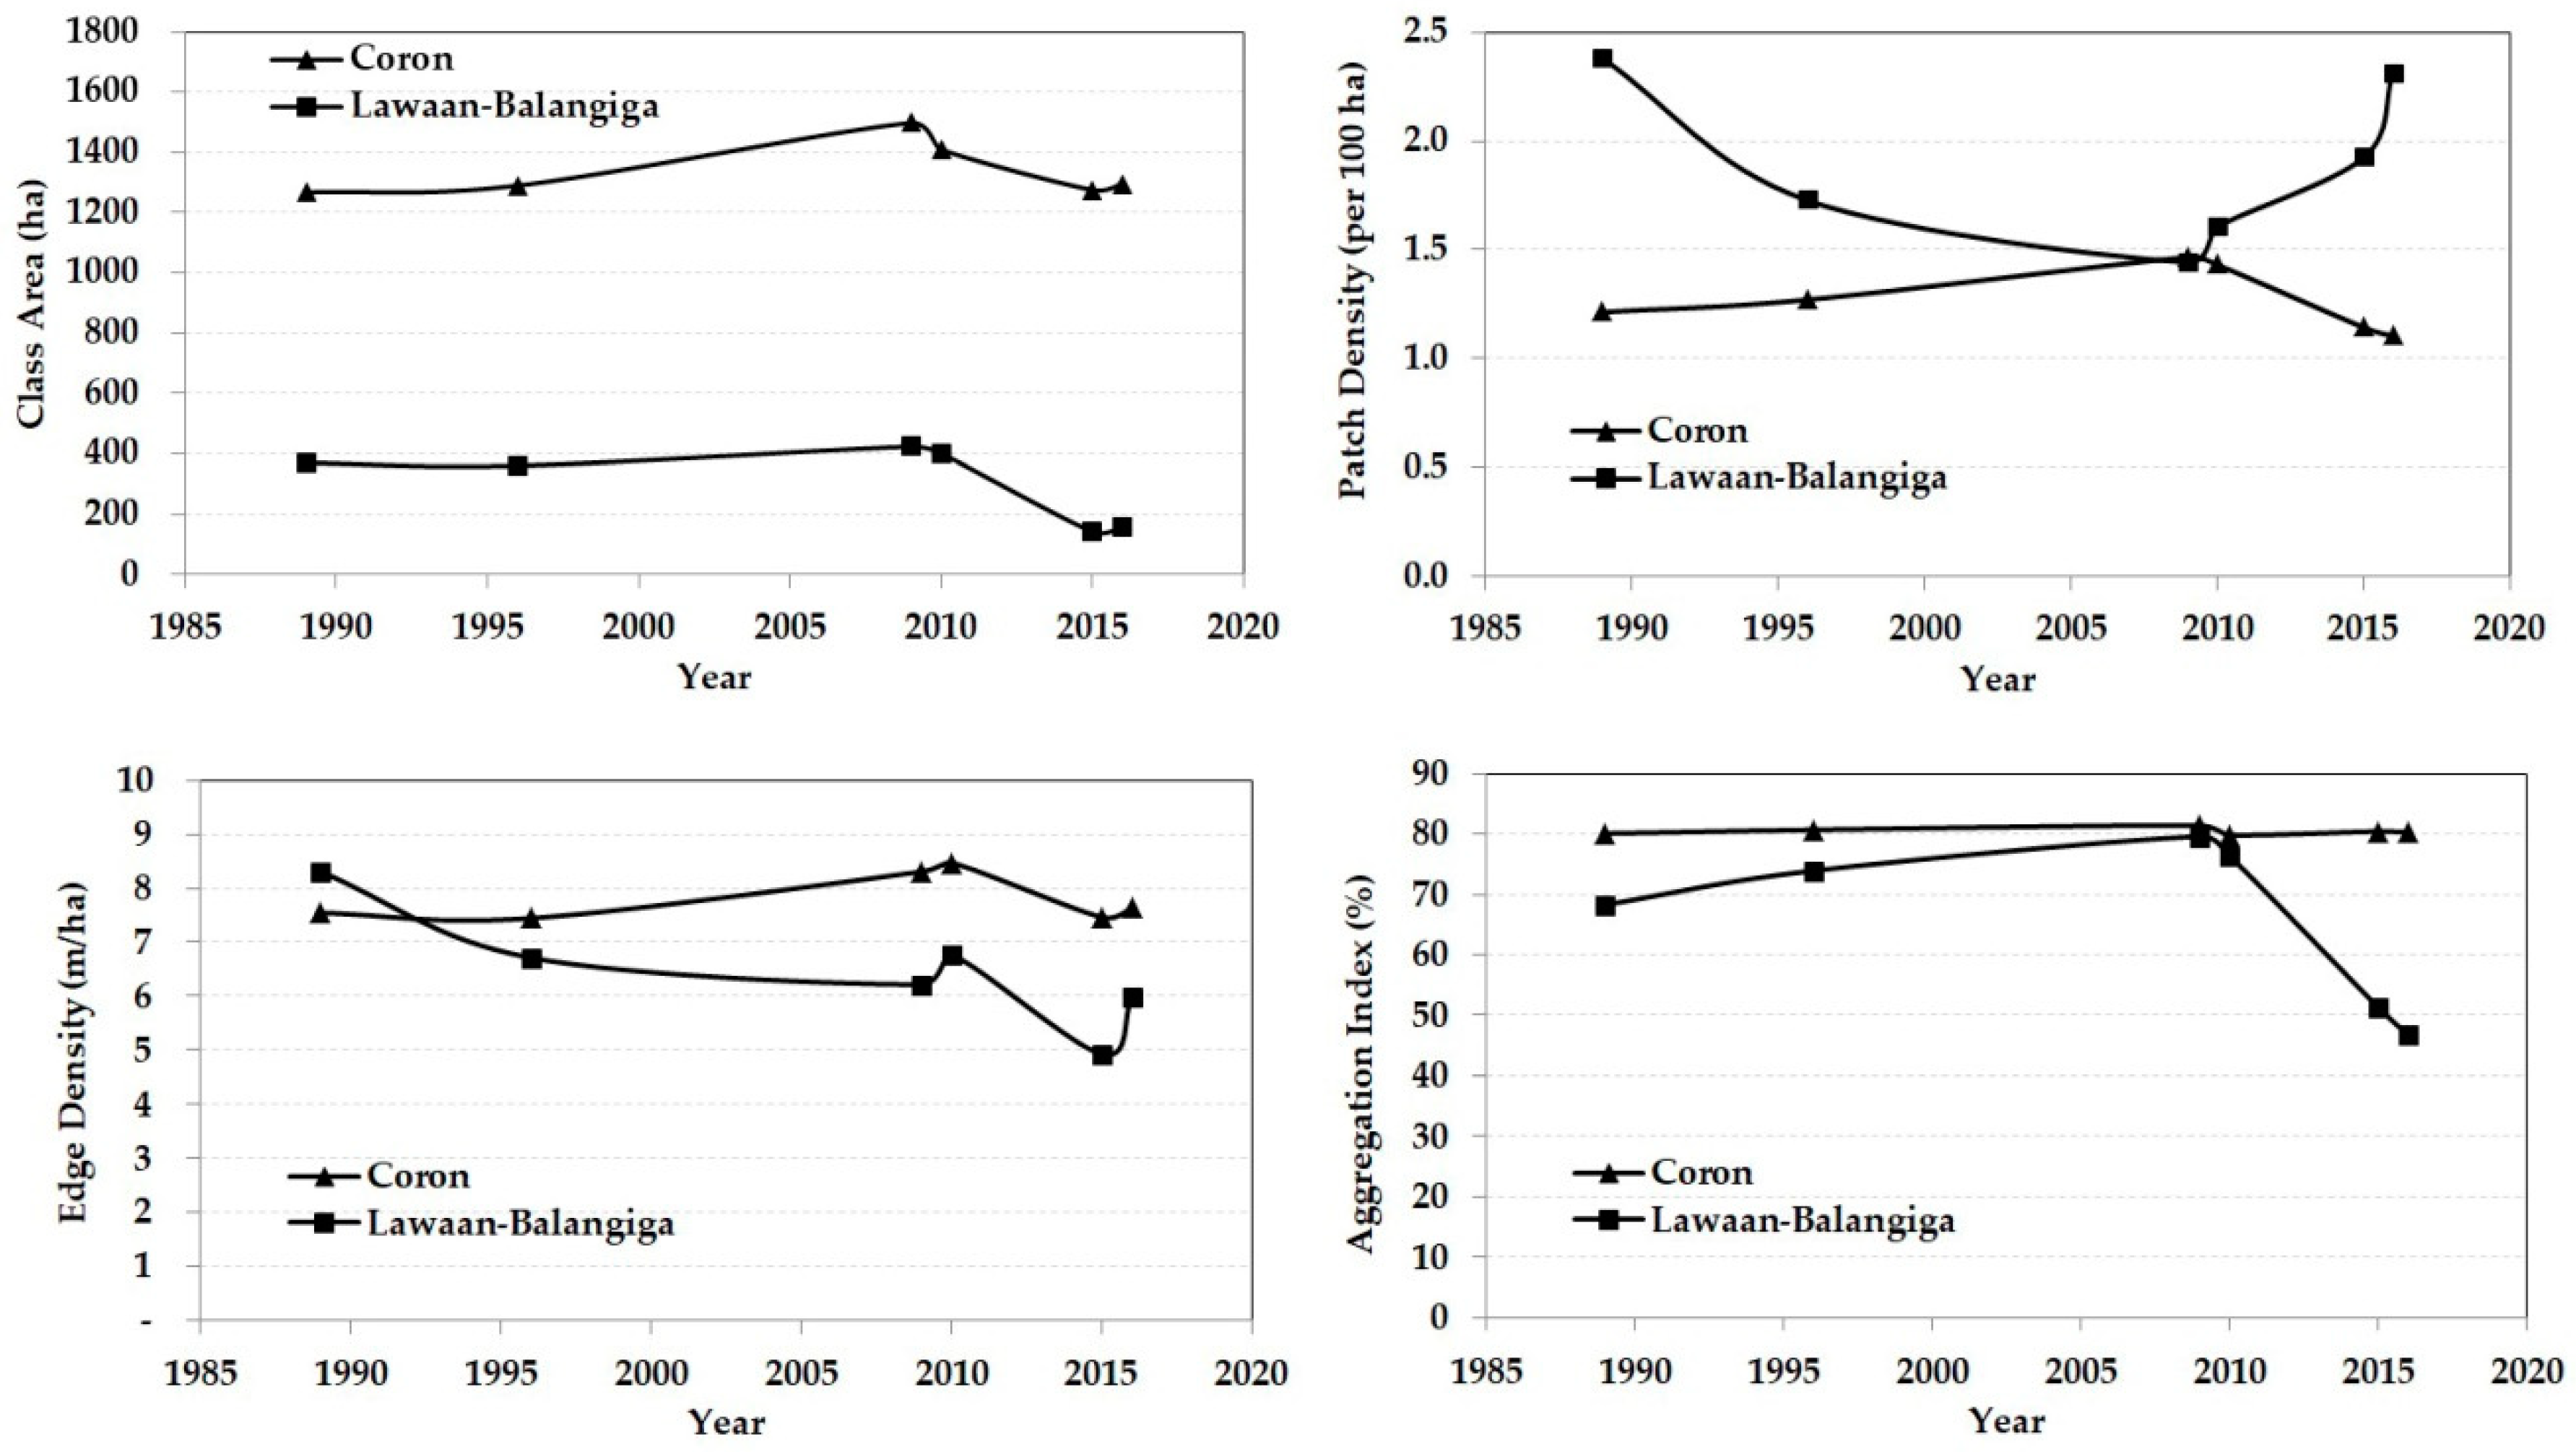
First, change detection analyses divided in three decades were compared. Change detection was applied in three time periods for the study areas: (1) Coron—1987–1996, 1996–2006 and 2006–2016; and (2) Balangiga-Lawaan—1989–1996, 1996–2004 and 2004–2016. Second, landscape metrics are often used for landscape ecology studies to better understand the ecosystem dynamics in a certain study area. For this study, four landscape metrics, Class Area (CA), Patch Density (PD), Edge Density (ED) and Aggregation Index (AI), are used to further examine and quantify the dynamic changes of the two mangrove areas over time [27]. CA calculates the area in hectares per classes on a landscape. It also provides information on the areal extent changes of the mangrove classes for Coron and Balangiga-Lawaan. PD provides information of how many patches contained per 100 hectare of mangrove areas. ED computes the number of meters per hectare (m/ha). Edges of the mangrove cover tend to be the most vulnerable part of the landscape as it directly faces the disturbances from natural and human causes. Since many organisms and rural communities are dependent on the natural resources of the mangrove forests, edge effects and fragmentation due to disturbances can be possible indicators of future impacts. AI provides information about the possible growth behavior of mangrove areas. Values are given as a percentage, where 100% means that the mangrove area is highly aggregated. For this study, calculation of the following landscape metrics was done by using the Fragstats 4.2 software [28]. These calculations were done for the years that were common for both study areas—1989, 1996, 2009, 2010, 2015 and 2016.
3. Results
3.1. Classification and Accuracy Assessment
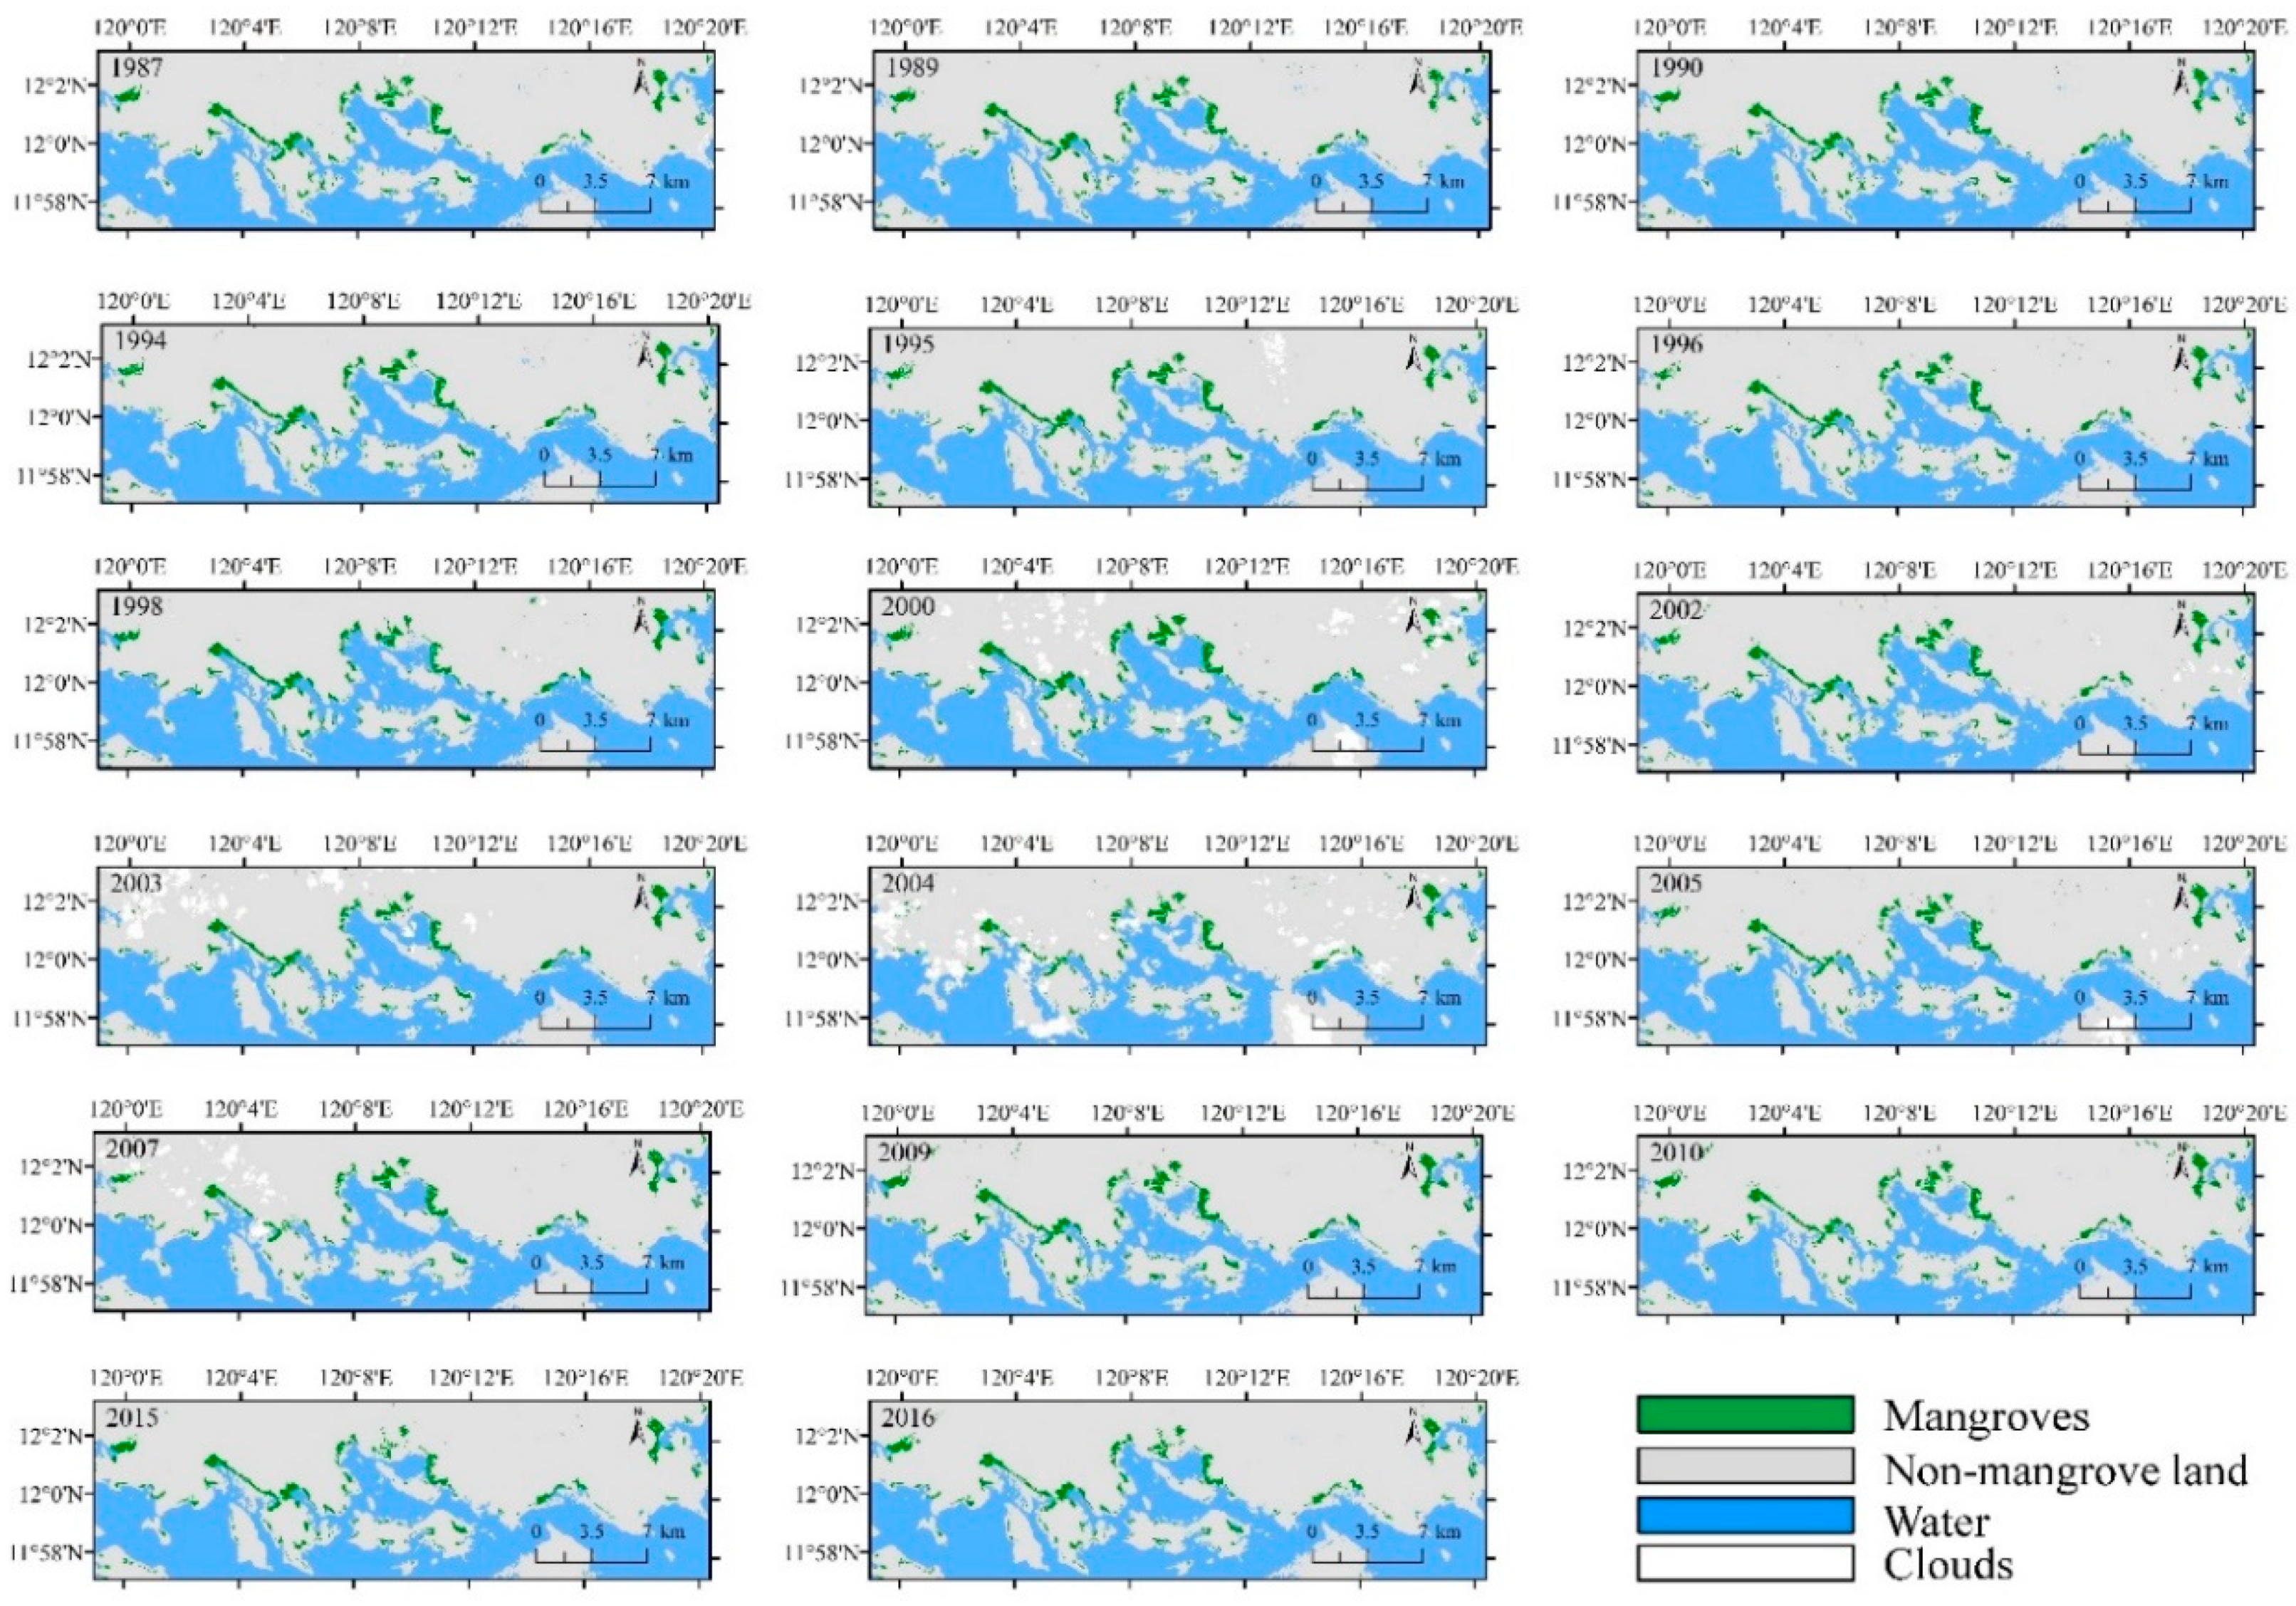
Figure 2 and Figure 3 show the classification results of the two mangrove study areas within the years 1987–2016. It can be seen that the Coron region has broader mangrove area cover than the Balangiga-Lawaan region. The Coron mangrove area did not seem to show obvious changes in the images. Conversely, in Balangiga-Lawaan, a significant reduction in the mangrove area classified in 2015 and 2016 is evident as compared to the previous years. However, with further examination of the images, both Coron and Balangiga-Lawaan mangroves manifested a decrease in mangrove cover. Changes in the mangrove area were not only reduced on the edges but were also seen within the interior of the forests as patches of open canopies. Accuracy assessment provided information of the reliability of the classification results. Overall accuracy is generally higher than 84.37%.
3.2. Temporal and Spatial Changes of Mangroves
3.2.1. Areal Extent Changes
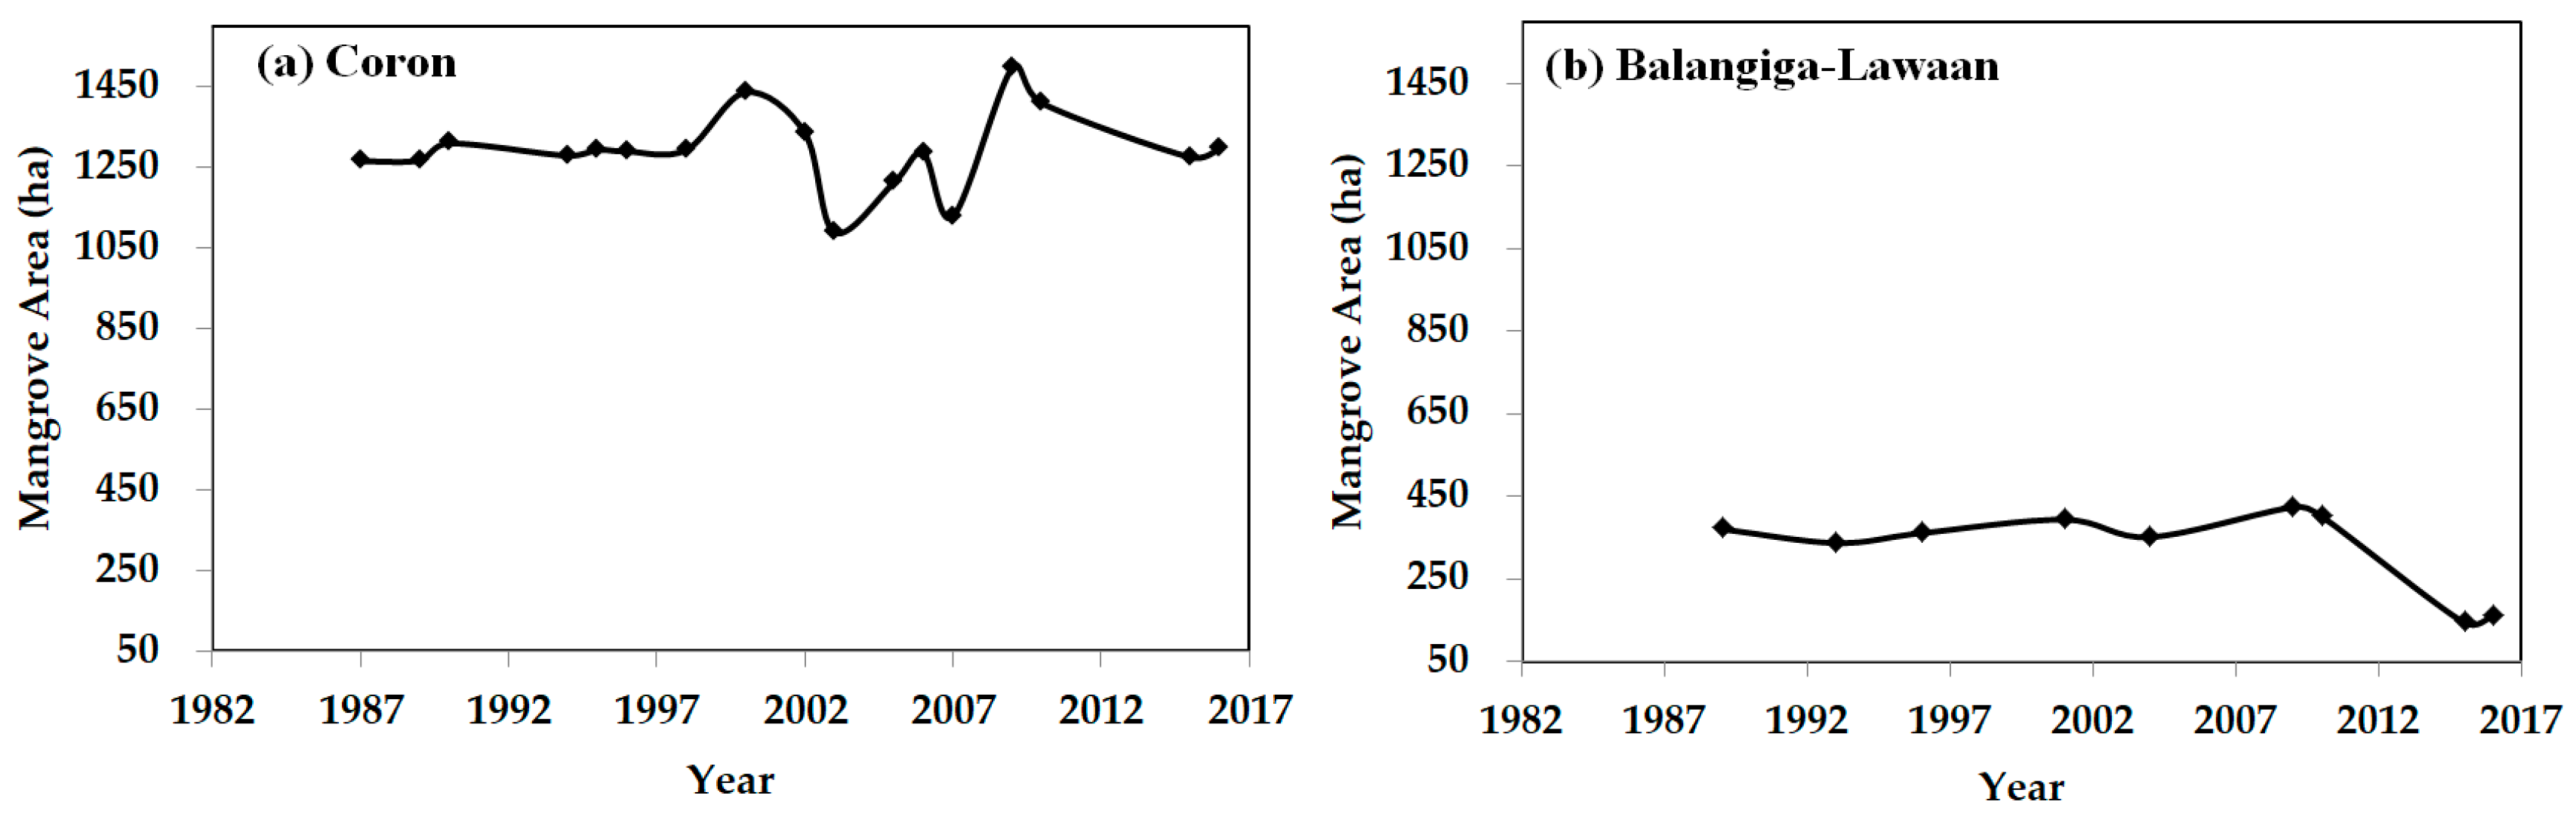
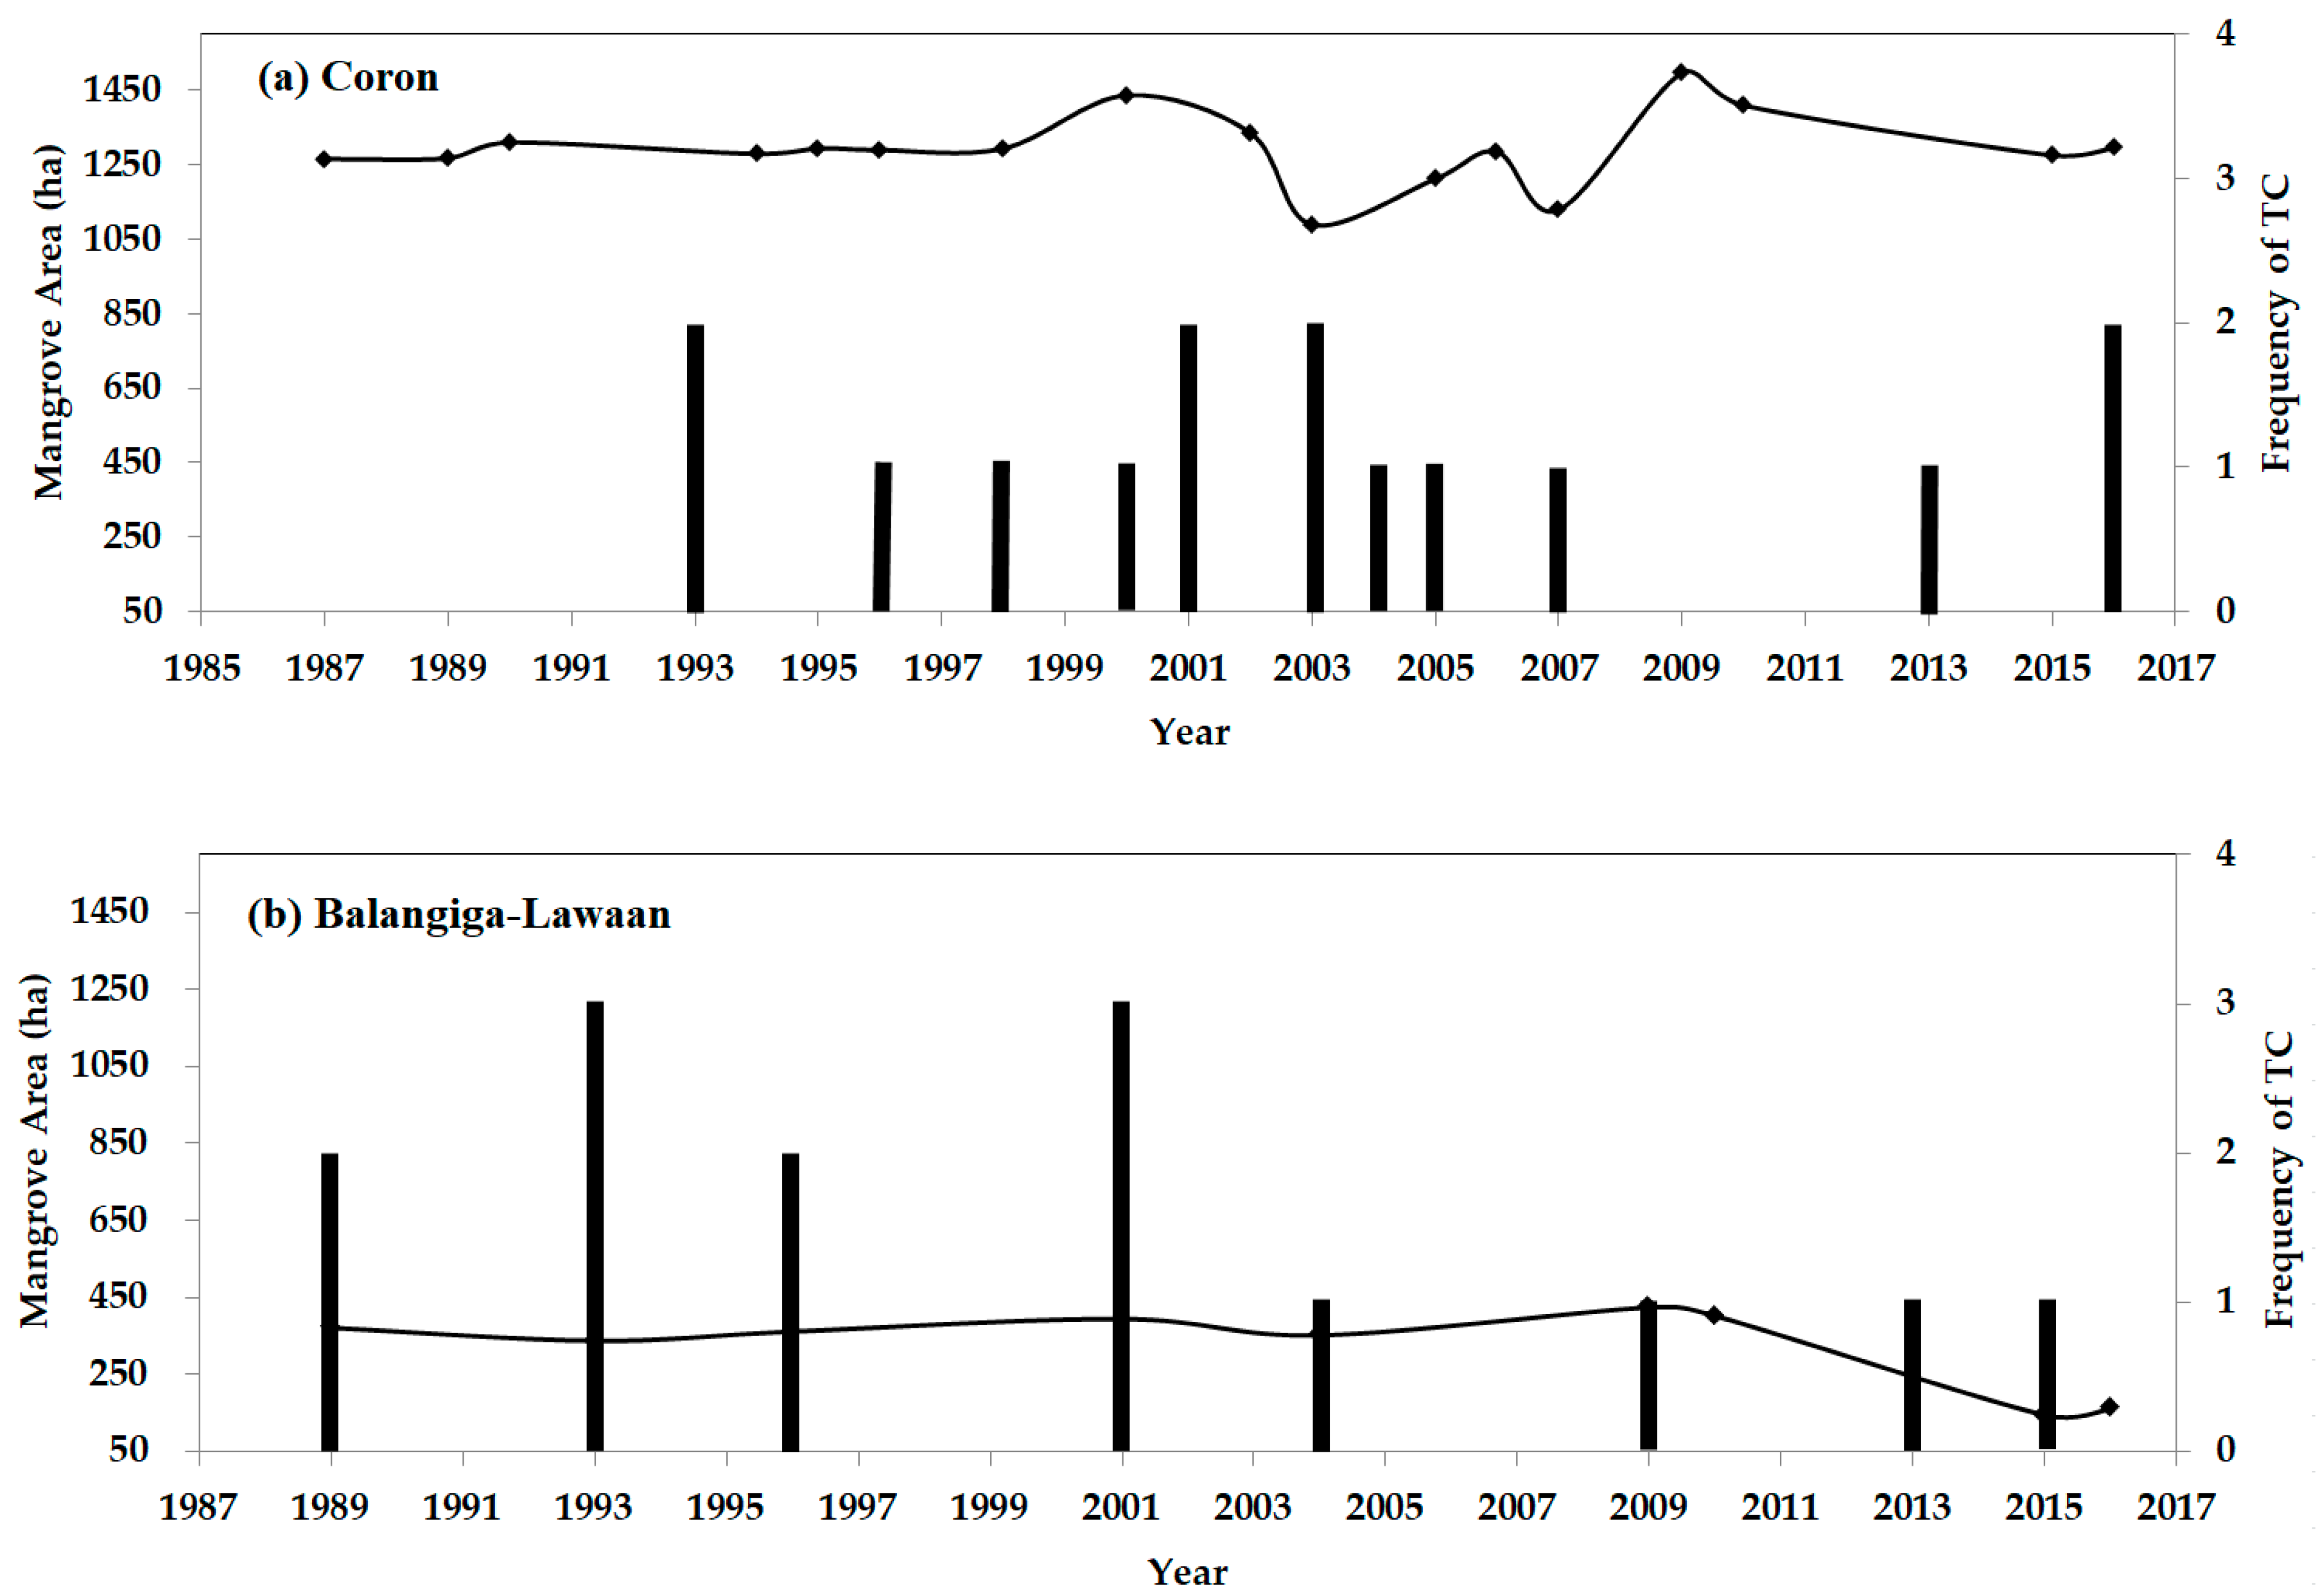
Area extent changes show the expansion or shrinkage of the mangrove areas for Coron and Balangiga-Lawaan (Figure 4). Years where the expansion and shrinkage can be identified can help explain the magnitude of the mangrove areal extent changes. Both the occurrences of typhoons and policies implemented during these periods were cross-checked with the observed areal extent changes.
In Figure 4, it can be observed that frequent fluctuations of mangrove area occurred in the two selected sites. The major driving forces are complicated and different at the two sites during different periods. A discussion of these factors is given below. Generally, the increase of mangroves is due to conservation and reforestation efforts of the local government, while the decreases are due to the damage from human activities such as urbanization and agriculture, and to the damage from tropical cyclones. For instance, in Balangiga-Lawaan, the mangrove forests were reduced mainly by tropical cyclones and human activities such as urbanization. When affected by tropical cyclones, mangrove areas were transformed to mudflat. If affected by urbanization, the mangroves were changed to urban areas.
Further analysis analyzed the expansion and shrinkage trends of the mangrove area coverage of the two study areas. The growth rate per year was calculated between the years 1989 to 2010 when the positive trend was relatively consistent, while the reduction rate was from 2010 to 2016 as both mangrove areas showed significant decline during this time. The growth rate at Coron was 6.18 ha per year, while the rate at Balangiga-Lawaan was 1.47 ha per year. Conversely, the reduction rates were −19.02 ha per year and −40.22 ha per year, respectively. These results suggest that the Coron mangrove areas expanded more than the Balangiga-Lawaan mangroves over the same epoch. The reduction rates indicate that the Coron mangroves are more resistant from disturbances than the Balangiga-Lawaan mangroves. Coron has a more diverse species composition as compared to Balangiga-Lawaan. Coron’s mangrove zonation may have been better than that of the fringing mangroves of Balangiga-Lawaan. A recent study reported that there were mangrove plantations in the Eastern Samar coastal municipalities, mostly Rhizophora species planted seaward that were severely damaged. Hence, the resistance from strong winds and waves may be relatively low [18].
3.2.2. Decadal Change Detection
Change detection analyses provide the areal extent differences in a certain period as well as information on the expansion and shrinkage rates of the area under study. Change detection is usually observed by comparing multiple years, usually in a discrete interval (e.g., 5-year gap, 10-year gap).
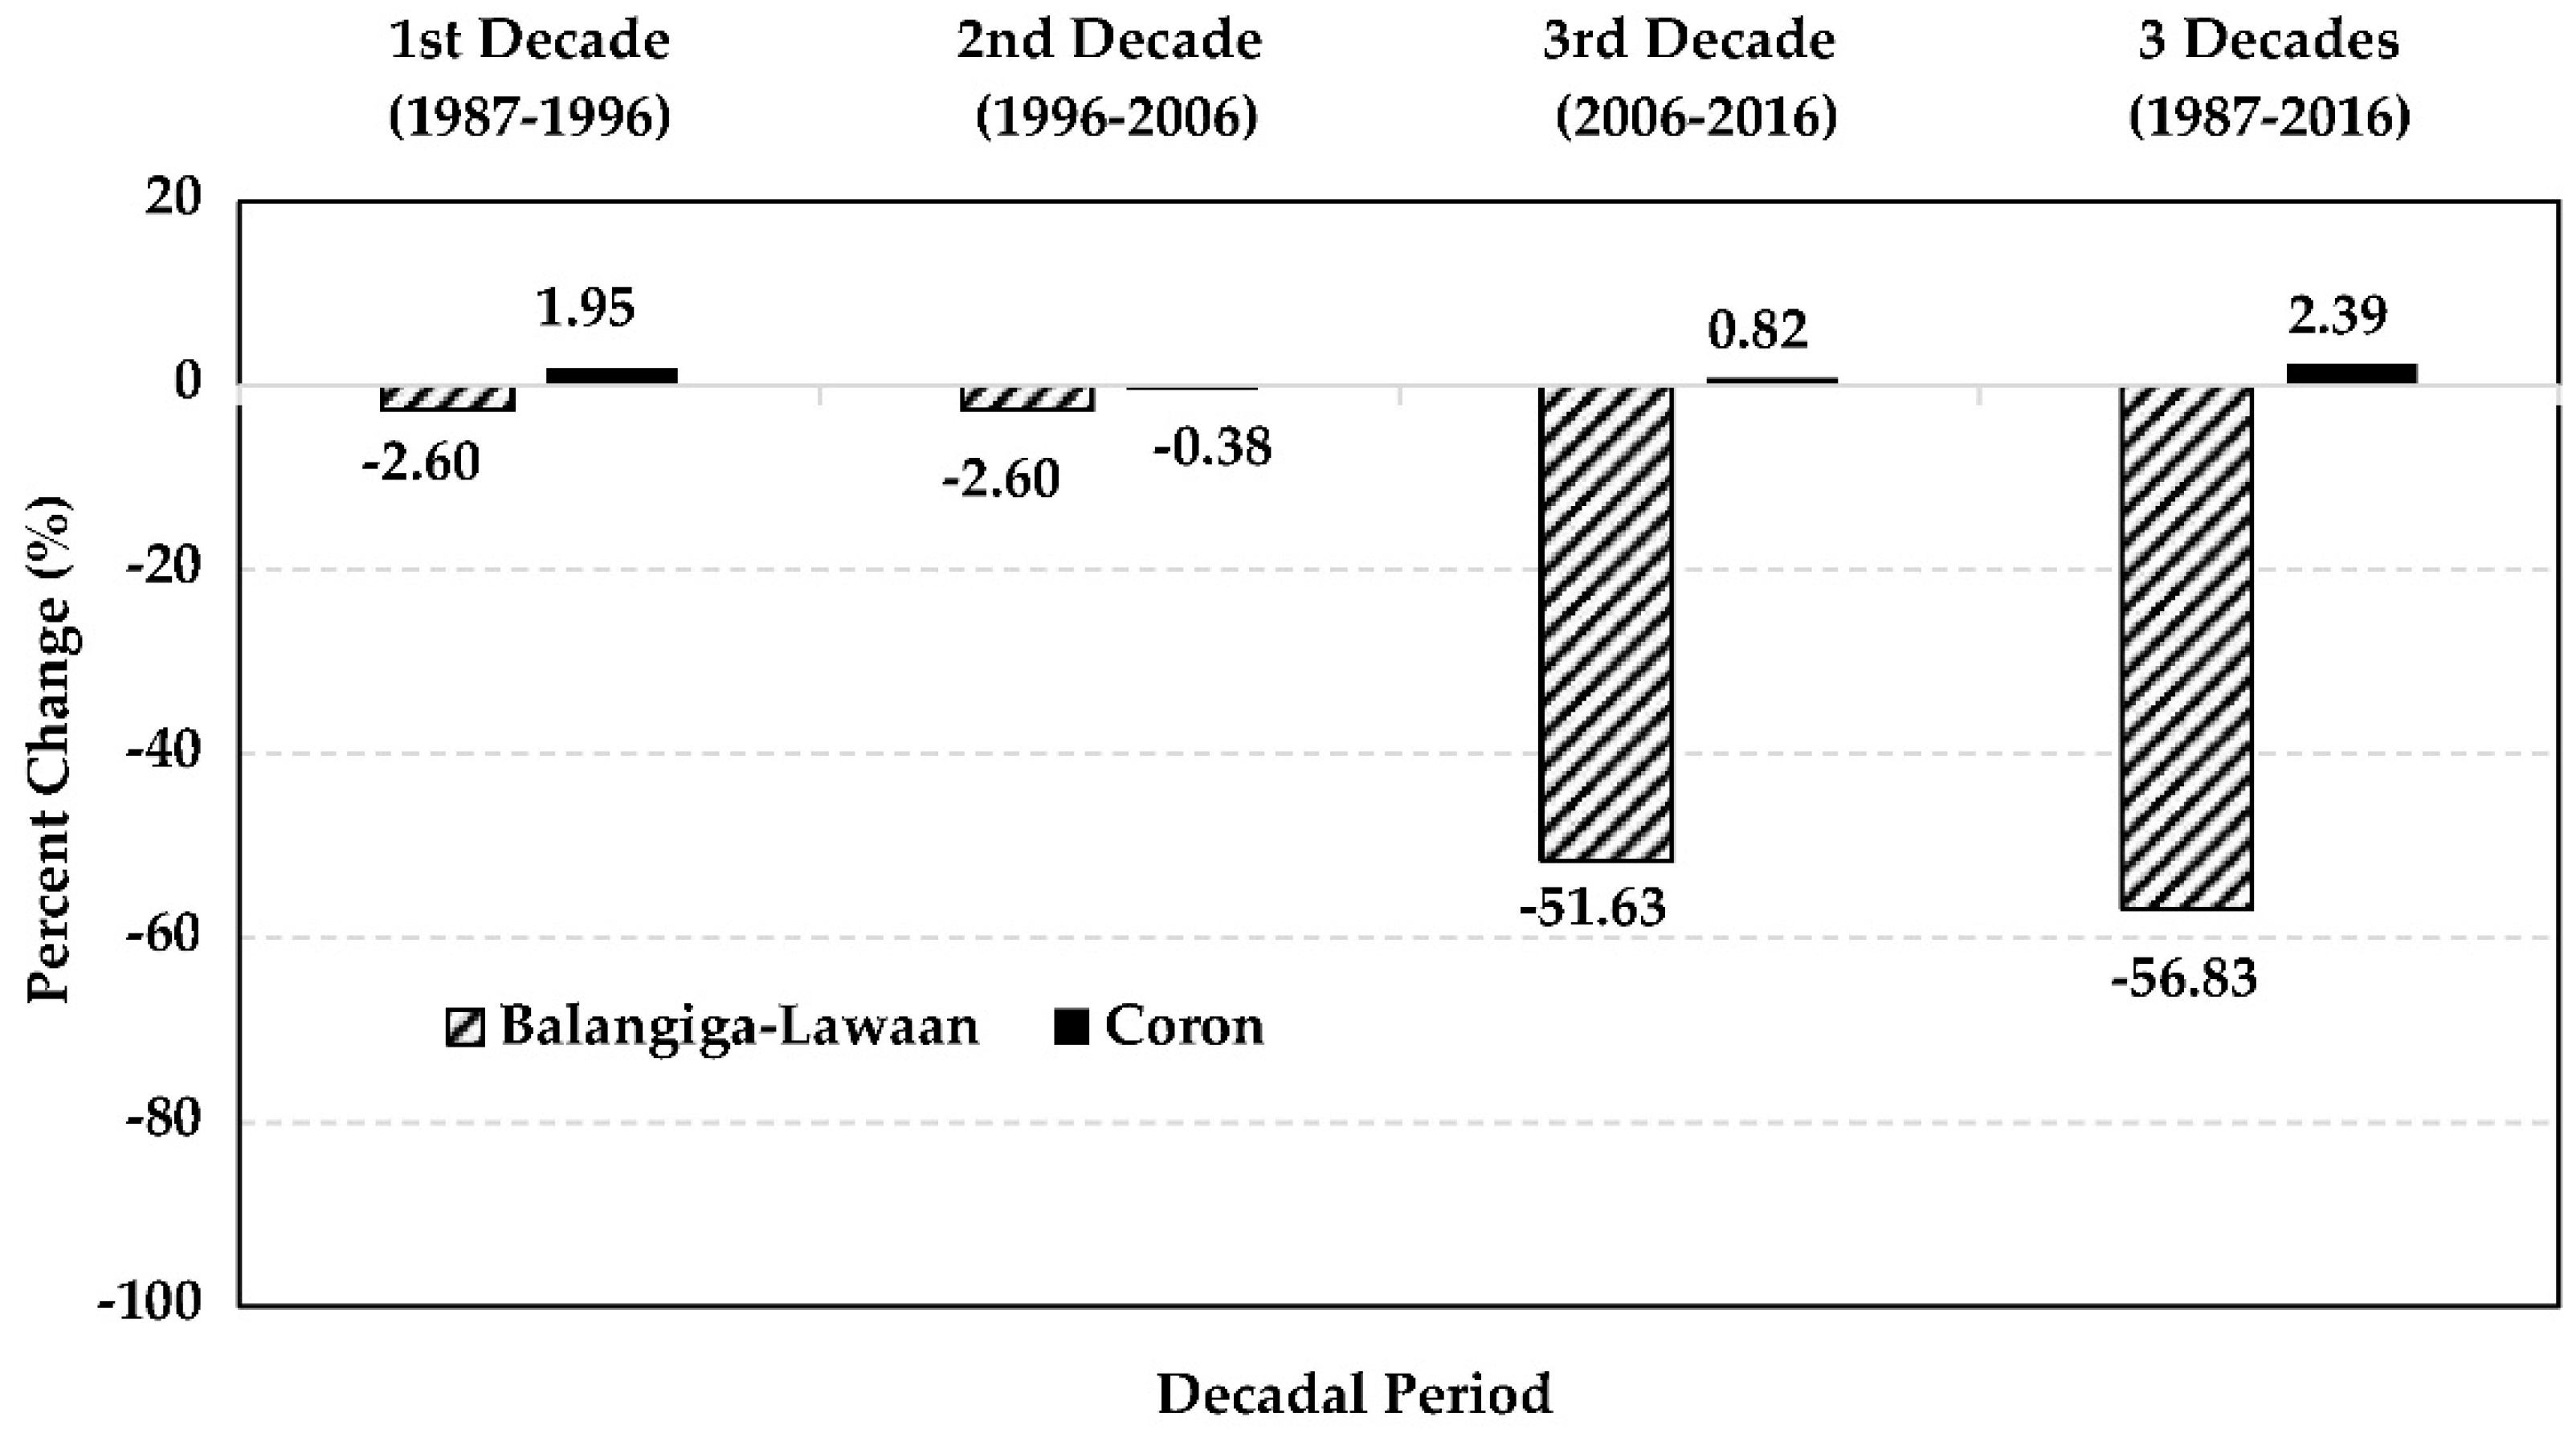
Figure 5 shows the results of the change detection statistics considering threee periods: 1987–1996, 1996–2006 and 2006–2016. Although fluctuations were observed in Figure 4, especially for Coron, the changes at the decadal time scale in the two study areas indicate a different temporal pattern compared to that of the annual scale. Generally, the Coron mangroves showed an increase in areal extent while the Balangiga-Lawaan mangroves areal extent decreased in all three time periods. It can be noted that although the Coron mangrove area expansion is slow, the mangroves in these areas are relatively stable amidst disturbances that occurred in the past 30 years. However, Balangiga-Lawaan continued to decline, aggravated by tropical cyclone disturbances in the later period. The difference in the geographic location of the two study sites may also further explain the level of vulnerabilities against tropical cyclones. Balangiga-Lawaan lies on the open Pacific Ocean, where the majority of typhoons form, and have a higher chance of making landfall on the eastern boarder of the Philippines. While Coron is situated on the western side of the Philippines, typhoons that come from the eastern side usually do not have sustained winds to further impact the islands at the western side of the country.
3.2.3. Landscape Pattern Changes
Landscape change detection involves the observation of the areal changes in terms of its shape and presence of fragmentation. This is useful to further investigate the changes in areal extent as well as the potential areal losses within a mangrove cover. Shape and fragmentation may give further explanation how human activities such as logging or felled trees due to strong winds affects the overall landscape of the mangrove areas. Each landscape metric, CA, PD, ED and AI, are compared and discussed in detail below:
First, the changes of CA at the two compared sites are shown on Figure 6. From 1989 to 2009, the Coron mangroves expanded, showing a gradual increase between 1996 and 2009After 2009, declining trends can be observed, consistent with the results in Figure 5. Between 2015 and 2016, there is a slight increase in the mangrove area. In Balangiga-Lawaan, mangrove areas typically showed a slowly declining trend since 1989 but with a more significant drop of the mangrove area coverage between 2010 and 2015. This was mainly due to the super typhoon Haiyan in 2013. Second, the Balangiga-Lawaan mangroves showed higher PD values than Coron. The trend suggests that the former have had more fragmented mangrove cover than the latter. However, it can be noticed that in 2009, both mangrove areas had an almost equal PD value. Third, ED is crucial in understanding the areal changes of the mangrove cover. In 1989, the Balangiga-Lawaan mangroves used to have denser edges as compared to Coron; however, through time, a significant decline is evident as shown in Figure 6. Coron mangroves showed a stable ED increase. Between 2010 and 2015, both mangrove areas showed significant decrease but manifesting recovery of the edge density from 2015 to 2016. Although Balangiga-Lawaan showed a sharper decrease of edge density in 2010–2015, it also showed a faster recovery of the edge density than the Coron mangroves. Fourth, it can also be observed that the Coron mangrove areas had a relatively stable AI values at about 80%, signifying its compactness in areal growth, while the Balangiga-Lawaan mangroves had more fluctuations of AI from 1989 to 2016. The AI values corresponded with the previous landscape metrics trends. Since Balangiga-Lawaan has smaller area coverage and higher patch densities with fluctuating edge densities, the AI value agrees that Balangiga-Lawaan mangroves had more disaggregated mangrove patches than Coron mangroves.
Overall, the landscape metrics used have shown clear differences on the mangroves’ growth dynamics in our two study areas. These variations can be triggered by either natural or human factors. The next sections will show how the natural disturbances of typhoons and policies of human intervention affected the mangrove areal changes for the two study areas.
3.3. Qualitative Impacts of Tropical Cyclones
Super typhoon Haiyan in 2013 had a significant impact on the mangrove areal extent of the two study areas; to put this context, the historical patterns of tropical cyclones from 1987 to 2016 was also examined. The yearly frequency of tropical cyclones was compared with the areal changes of mangroves, shown in Figure 7. Generally, it can be observed that the correlation is not very significant. The frequency of typhoons can reduce the mangrove areal extent, especially during the years of 1993, 2001, 2003 and 2013 at Coron, and 1989, 2001 and 2013 in Balangiga-Lawaan. However, some exceptions were observed, for instance, 1996, 2004 and 2005 in Coron, and 1996 in Balangiga-Lawaan, where the mangroves increased with the tropical cyclones’ occurrence. Nevertheless, three aspects should be well noted to understand the results in Figure 7. First, the intensity of the tropical cyclones was missing in the data of this study, which may be an important factor towards mangrove change. For instance, the super typhoon Haiyan in 2013 brought a significant decrease to the mangrove regions, although it was the only cyclone in 2013. Second, the exact time of tropical cyclones in each year were also missing which inhibited the ordering of satellite images and tropical cyclones in each year. Thus, the impacts of tropical cyclones may be in the same year or the next year. Third, the impacts of human protection of the mangroves cannot be shown in Figure 7, which can also be an important factor towards the increase or decrease of mangroves. A more detailed discussion of the driving factors of mangroves changes in the Philippines was provided in Section 4.
4. Discussion
4.1. Temporal Changes of Mangroves in the Philippines
Some further comments can be made from the changes in the landscape metric. First, there may be several underlying reasons for the changes in PD: (1) Coron’s CA is directly proportional to its PD—it can be implied that the presence of the patches are signs of new growth for the mangroves. The number of patches per 100 hectares from 1996 to 2009 increased along with the area increases, while the decreases in the patches from 2009 to 2015 may mean removal of the mangrove cover due to disturbances that contributed to the decrease in mangrove area. (2) The Balangiga-Lawaan mangroves started with a very high PD from 1989 to 1996 along with the decrease of its areal coverage, suggesting the possibility of the removal of some patches, though the CA slightly increased from 1996 to 2009 with decreased PD, which may suggest clumping of some patches that contribute to mangrove areal expansion. Second, the changes in ED may suggest that the Balangiga-Lawaan region, with a fringing type of mangrove ecosystem, may have more favorable growth on coasts. Yet, due to the region’s proximity to the open sea, the mangrove areas are highly exposed to disturbances such as strong waves and winds, and show a significantly fluctuating trend of ED values from 1989 to 2016.
One of the most interesting characteristics about the temporal changes of mangroves in Coron and Balangiga-Lawaan in the Philippines is the fluctuating area. Decreasing trends of mangroves forests have been identified as a major phenomenon in many previous studies [29,30,31]. These decreases were mainly caused by human activities (e.g., urbanization, farming and tourism) and disasters such as tropical cyclones [30,32]. A decreasing trend is mainly observed for the global mangrove forest. On the other hand, an expansion of mangrove forests was also reported in some cases [9,31]. Conservation is a critical factor for the expansion of mangrove forests. However, conservation or protection by itself cannot increase the area of mangrove forest, since they just prevent the mangroves from being further destroyed. Other factors or activities should be included to increase the mangroves, such as reforestation. For instance, the increase of mudflat areas derived from rapid urbanization and soil erosion was identified as an important contribution to the increase of mangrove forest [9]. The mangroves in these two study sites have experienced fluctuations in the long term. The main reason is the frequent occurrence of tropical cyclones and frequent deforestation after these disaster events.
There are other causes that may contribute to the fluctuations of mangroves. According on the baseline report made by the Palawan Council for Sustainable Development (PCSD) in 2006, there has been deliberate charcoal production of the communities living in the municipality of Coron, which was evident in the conduct of the transect surveys in 2003. Though it was already emphasized in P.P. 2152 that no commercial activities such as vast clearcutting of the mangrove trees in the Coron mangrove areas be allowed, household uses and small local markets for charcoal can be the driving factors causing the decreased volume of the mangrove cover [33]. The declining trend from 2009 to 2015 was mainly due to the super typhoon Haiyan in 2013. From the classification results in Figure 3, a noticeable amount of mangrove coverage along the middle and eastern coastlines were reduced. About 150 hectares of mangrove area was damaged in Balangiga-Lawaan [34], consistent to the results in this study.
The temporal changes of the two sites at two different time scales were also compared. Figure 4 and Figure 5 illustrate the mangrove areal changes in the two study areas at two different time scales, the annual change and decadal change. It indicates the different scales of possible change. For instance, the annual fluctuation in Coron was not as noticeable at the decadal scale. The phenomenon also indicates that more frequent observation is needed in the mangrove regions using remote sensing, as some changes may not be observed in a coarse time scale.
4.2. Tropical Cyclone Influence on Mangroves in the Philippines
Tropical cyclones are the most common threat experienced by the Philippines, causing damages to infrastructures and the environment. The results showed a weak relationship of the number of tropical cyclones affecting the Coron and Balangiga-Lawaan mangroves, though it did show that the tropical cyclones tend to damage the vegetation and potentially contribute to the decrease in the of the mangrove forests. Even though new policies are being implemented to regain the previous state of the Philippine mangroves, the emerging threats from the natural disasters are becoming more significant. Climate change impacts such as sea level rise, uncertain weather patterns and more intensified tropical cyclones tend to inhibit the continuous growth of mangrove forests. Reforestation efforts can easily be undone by one strong typhoon; hence, mortality rates of the mangroves are becoming higher.
4.3. Anthropogenic Influences on Mangroves in the Philippines
Progress of mangrove forest growth is greatly influenced by the human activities. However, this study showed that the human influence on mangrove forests is a Janus-faced reality. Earlier policies implemented in boosting the fisheries sector by promoting the development of vast fishponds over the protection of the mangrove forests, were intended for welfare of the Filipino people—a good intention—but with the ailing consequence of destroying the natural protection of communities from the threats of tsunami and storm surges. The significance of mangrove forests for the overall ecological balance and its contribution to the mitigation of climate change is now better realized, and new policies are based on a more environment-friendly approach. However, the inception and implementation of newer favorable policies is slow and sometimes stagnant due to the poor law enforcement of the laws.
A Declaration of Marine Protected Areas (MPAs) has been a strategy to protect and conserve the remaining natural resources along the coastlines of the Philippines. Declaration of an area as an MPA can be done by the national government agencies (NGAs) or local government units (LGUs). The two study areas considered both had protected areas being managed under different policies. Different management practices carried out are driven by laws and yet showed different impact on the mangrove forests.
4.3.1. Policies Implementation for Coron Mangroves
As per Presidential Proclamation No. 2151 of 1981, the whole mangrove area of Coron is included in the declaration of Palawan province’s mangrove swamp forest reserve [33]. However, the baseline report by the Palawan Council for Sustainable Development (PCSD) in 2006 for the Coron mangrove forest surveys revealed that the mangroves inside the reservation area were still subjected to threats of clearance for fishpond developments in 2003. The mangrove trees were also cut for other purposes such as timber, fuelwood, charcoal and for low-cost housing materials for the communities [33]. It was in the 1970s to 1980s when deliberate commercial cutting of mangrove started. In 1992, Republic Act 7611 or the Strategic Environmental Plan (SEP) for Palawan Act was passed into law with the aim to promote sustainable development by assisting the implementation of plans, projects and programs that will preserve and enhance the environment while pursuing socio-economic goals. It also encourages the involvement of all sectoral groups to maximize the people’s participation in natural resource management. These two major laws embodied the management of the natural resources of the whole Palawan province. An Environmentally Critical Areas Network (ECAN) Resource Management Plan was required under the SEP law, which ensured the proper zonation of mangroves as core or no take zone, restoration and regulated multiple use zone [35]. Currently, the latest ECAN plan is set for implementation for 2017–2022. It can be observed that there was not a strict adherence to the law for the Coron mangroves declared as a forest reserve since there is an issue between addressing the basic needs of the community and protecting the forest resources. With the formulation of the ECAN plan, it is hoped that the zonation strategies will address the matter effectively.
4.3.2. Policies Implementation on Balangiga-Lawaan Mangroves
A directory of the Marine Protected Areas (MPAs) was provided in the Visayas, Philippines [36]. There are six (6) established MPAs for the municipality of Lawaan and one (1) established MPA for the municipality of Balangiga; however, assessments report that all the MPAs were non-functional. Though, there are no fishponds developed in the area, declining mangrove areal extent is evident. It was reported on BFAR’s Municipal Participatory Coastal Resource Assessment for Balangiga that the major issues and problems being faced by the community’s fisheries sector included cyanide and dynamite fishing, mangrove cutting and weak enforcement of laws. The coastal villages of Balangiga were fully aware of the existence of Coastal Resource Management (CRM), yet enforcement of the laws and policies to properly manage the coastal resources and mangrove forests is weak or even nonexistent (BFAR Region 8). Meanwhile, the municipality of Lawaan, although with several MPAs established, is also facing issues of weak forest law enforcement, weak implementation of fishery ordinance, absence of Forest Management Plan and an outdated Coastal Resource Management plan (Municipal Government of Lawaan).
4.4. Suggestion for the Sustainable Mangroves Management in the Philippines
The key for the successful management of mangrove forests lies mainly on the implementation of harmonized policies and active stakeholder participation. The results of this study manifested how the two study areas’ mangrove management under different policies can affect the mangrove dynamics. The commitment of the national government to protect the Coron mangroves is very evident in the national laws implemented as well as the contribution of the stakeholders—local government, NGOs, POs, Private Organizations. On the other hand, the Balangiga-Lawaan mangrove areas do not have a strong link with the national government since the declaration of MPAs only occur at the local level. It is now needed to call the attention of the national government to provide support to the local communities by empowering them to properly manage its coastal resources. As the current policies shifted to a more comprehensive and integrated approach which considered both the natural and human-impacts—Integrated Coastal Management (ICM), Climate Change Act of 2009, Philippine Disaster Risk Reduction and Management Act of 2010 and National Greening Program (NGP), there is a potential to regain the Philippine mangroves that have been lost in the past. However, implementation of the national policies on the grassroots level must be effective as well. Strong commitments from the national and local level must be established by proper information dissemination, policy education and continuous monitoring and evaluation of the existing programs and projects of the government is all the key for success in mangrove forest management.
5. Conclusions
This study analyzed two sub-regions of the Philippines with significant mangrove forests via change detection techniques for the period of 1987–2016. Both mangrove areas manifested areal extent changes where expansion and shrinkage were evident during the 30-year period. The Coron mangroves, though considered as a protected area, still suffered from mangrove area loss. However, the landscape metrics have proven the better stability of the Coron mangroves since there were no significant fluctuations of the trends, confirming that the mangrove areas in this municipality are still in good conditions. Meanwhile, Balangiga-Lawaan manifested drastic changes as shown by the areal extent trends and the landscape metrics results. It can be observed that the mangrove areas of Balangiga-Lawaanmay be able to naturally recover from disturbance, and has higher tendency to have a permanent change in the landscape over time. The frequent occurrences of typhoons in showed weak impacts to the Coron and Balangiga-Lawaan mangrove areas but do show the negative effects that decrease the areal extent and expansion rates. There may be different factors that are causing strong influences on the mangrove areas other than the frequency of typhoon visits. Further investigation could be done to examine other variables such as the intensity of the typhoons, species and stand composition of the mangroves and other factors. We also demonstrate that government policies may be either beneficial or threatening to the status of the mangrove forests. The two study areas have had issues and gaps in the implementation of the policies due to the conflicting interests of the use and protection of the mangroves. However, it can be noted that the participatory approach is one effective strategy to achieve the aims of the laws implemented. This is where the two mangrove study areas differed from each other. The participation of the communities and stakeholders (NGO, PO, National Government, and Private Institutions) is more evident in Coron than Balangiga-Lawaan. Moreover, unlike Coron mangroves, Balangiga-Lawaan mangroves were included in the locally declared MPAs.
Author Contributions
Conceptualization, H.Z.; Data curation, H.Z.; Formal analysis, H.Z.; Funding acquisition, H.Z.; Investigation, M.J.C.B.; Methodology, M.J.C.B.; Project administration, H.Z. and H.L.; Resources, H.L.
Funding
This research was funded by [Research Grants Council (RGC) General Research Fund] grant numbers [CUHK 14635916 and CUHK 14605917], [National Natural Science Foundation of China] grant number [41401370].
Acknowledgments
The authors would like to thank the three anonymous reviewers for their critical comments and suggestions to improve the original manuscript. The authors highly appreciate Adam Thomas DEVLIN, from Institute of Space and Earth Information Science, The Chinese University of Hong Kong, for his very helpful editing of the manuscript.
Conflicts of Interest
The authors declare no conflict of interest.
References
- Heumann, B.W. Satellite remote sensing of mangrove forests: Recent advances and future opportunities. Prog. Phys. Geogr. 2011, 35, 87–108. [Google Scholar] [CrossRef]
- Donato, D.C.; Kauffman, J.B.; Murdiyarso, D.; Kurnianto, S.; Stidham, M.; Kanninen, M. Mangroves among the most carbon-rich forests in the tropics. Nat. Geosci. 2011, 4, 293–297. [Google Scholar] [CrossRef]
- Cinco, T.A.; de Guzman, R.G.; Ortiz, A.D.; Delfino, R.P.; Lasco, R.D.; Hilario, F.D.; Ares, E.D. Observed trends and impacts of tropical cyclones in the philippines. Int. J. Climatol. 2016, 36, 4638–4650. [Google Scholar] [CrossRef]
- Villamayor, B.R.; Rollon, R.N.; Samson, M.S.; Albano, G.G.; Primavera, J.H. Impact of haiyan on philippine mangroves: Implications to the fate of the widespread monospecific rhizophora plantations against strong typhoons. Ocean Coast. Manag. 2016, 132, 1–14. [Google Scholar] [CrossRef]
- Primavera, J.H. Mangroves and brackishwater pond culture in the philippines. Hydrobiologica 1995, 295, 303–309. [Google Scholar] [CrossRef]
- Garcia, K.B.; Malabrigo, P.L.; Gevaña, D.T. Philippines’ Mangrove Ecosystem: Status, Threats and Conservation; Springer Science+Business Media: New York, NY, USA, 2014; pp. 81–94. [Google Scholar]
- Bambalan, G.C. The Philippines Trajectory in Mangrove Development; Ministry of Foresty: Jakarta, Indonesia, 2013; pp. 30–35.
- Giri, C.; Ochieng, E.; Tieszen, L.L.; Zhu, Z.; Singh, A.; Loveland, T.; Masek, J.; Duke, N. Status and distribution of mangrove forests of the world using earth observation satellite data. Glob. Ecol. Biogeogr. 2011, 20, 154–159. [Google Scholar] [CrossRef]
- Liu, M.F.; Zhang, H.S.; Lin, G.H.; Lin, H.; Tang, D.L. Zonation and directional dynamics of mangrove forests derived from time-series satellite imagery in Mai Po, Hong Kong. Sustainability 2018, 10, 1913. [Google Scholar] [CrossRef]
- Zhang, H.; Wang, T.; Liu, M.; Jia, M.; Lin, H.; Chu, L.; Devlin, A.T. Potential of combining optical and dual polarimetric sar data for improving mangrove species discrimination using rotation forest. Remote Sens. 2018, 10, 467. [Google Scholar] [CrossRef]
- Wan, L.; Zhang, H.; Wang, T.; Li, G.; Lin, H. Mangrove species discrimination from very high resolution imagery using gaussian markov random field model. Wetlands 2018. [Google Scholar] [CrossRef]
- Wang, T.; Zhang, H.S.; Lin, H.; Fang, C.Y. Textural-spectral feature-based species classification of mangroves in mai po nature reserve from worldview-3 imagery. Remote Sens. 2016, 8, 24. [Google Scholar] [CrossRef]
- Paknia, O.; Sh, H.R.; Koch, A. Lack of well-maintained natural history collections and taxonomists in megadiverse developing countries hampers global biodiversity exploration. Org. Divers. Evol. 2015, 15, 619–629. [Google Scholar] [CrossRef]
- Long, J.B.; Giri, C. Mapping the philippines’ mangrove forests using landsat imagery. Sensors 2011, 11, 2972–2981. [Google Scholar] [CrossRef]
- Primavera, J.H. Development and conservation of philippine mangroves: Institutional issues. Ecol. Econ. 2000, 35, 91–106. [Google Scholar] [CrossRef]
- Philippine Atmospheric, Geophysical and Astronomical Services Administration (PAGASA). Climate Map of the Philippines Based on the Modified Coronas Classification. Available online: http://bagong.Pagasa.Dost.Gov.Ph./information/climate-philippines (accessed on 20 March 2019).
- The Palawan Council for Sustainable Development (PCSD). In-Depth Coastal/Marine Resources Survey Report for Busuanga Municipality; Palawan Council for Sustainable Development: Puerto Princesa City, Philippines, 2006.
- Primavera, J.H.; dela Cruz, M.; Montilijao, C.; Consunji, H.; dela Paz, M.; Rollon, R.N.; Maranan, K.; Samson, M.S.; Blanco, A. Preliminary assessment of post-haiyan mangrove damage and short-term recovery in eastern samar, central philippines. Mar. Pollut. Bull. 2016, 109, 744–750. [Google Scholar] [CrossRef] [PubMed]
- Alura, D.P.; Alura, R.P.C. Regeneration of mangrove forest devastated by typhoon haiyan in eastern samar, philippines. Int. J. Curr. Res. 2016, 8, 32373–32377. [Google Scholar]
- Zhang, H.S.; Wang, T.; Zhang, Y.H.; Dai, Y.R.; Jia, J.J.; Yu, C.; Li, G.; Lin, Y.Y.; Lin, H.; Cao, Y. Quantifying short-term urban land cover change with time series landsat data: A comparison of four different cities. Sensors 2018, 18, 4319. [Google Scholar] [CrossRef]
- Lee, T.M.; Yeh, H.C. Applying remote sensing techniques to monitor shifting wetland vegetation: A case study of Danshui River estuary mangrove communities, Taiwan. Ecol. Eng. 2009, 35, 487–496. [Google Scholar] [CrossRef]
- Zhu, Z.; Wang, S.X.; Woodcock, C.E. Improvement and expansion of the fmask algorithm: Cloud, cloud shadow, and snow detection for landsats 4–7, 8, and sentinel 2 images. Remote Sens. Environ. 2015, 159, 269–277. [Google Scholar] [CrossRef]
- Mountrakis, G.; Im, J.; Ogole, C. Support vector machines in remote sensing: A review. ISPRS J. Photogramm. 2011, 66, 247–259. [Google Scholar] [CrossRef]
- Kuenzer, C.; Bluemel, A.; Gebhardt, S.; Quoc, T.V.; Dech, S. Remote sensing of mangrove ecosystems: A review. Remote Sens. 2011, 3, 878–928. [Google Scholar] [CrossRef]
- Green, E.P.; Clark, C.D.; Mumby, P.J.; Edwards, A.J.; Ellis, A.C. Remote sensing techniques for mangrove mapping. Int. J. Remote Sens. 1998, 19, 935–956. [Google Scholar] [CrossRef] [Green Version]
- Zhang, H.S.; Zhang, Y.Z.; Lin, H. A comparison study of impervious surfaces estimation using optical and sar remote sensing images. Int. J. Appl. Earth Obs. 2012, 18, 148–156. [Google Scholar] [CrossRef]
- Vaz, E. Managing urban coastal areas through landscape metrics: An assessment of mumbai’s mangrove system. Ocean Coast. Manag. 2014, 98, 27–37. [Google Scholar] [CrossRef]
- McGarigal, K.; Cushman, S.; Ene, E. Fragstats v4: Spatial Pattern Analysis Program for Categorical and Continuous Maps; University of Massachusetts: Amherst, MA, USA, 2012. [Google Scholar]
- Conchedda, G.; Durieux, L.; Mayaux, P. An object-based method for mapping and change analysis in mangrove ecosystems. ISPRS J. Photogramm. 2008, 63, 578–589. [Google Scholar] [CrossRef]
- Murdiyarso, D.; Purbopuspito, J.; Kauffman, J.B.; Warren, M.W.; Sasmito, S.D.; Donato, D.C.; Manuri, S.; Krisnawati, H.; Taberima, S.; Kurnianto, S. The potential of indonesian mangrove forests for global climate change mitigation. Nat. Clim. Chang. 2015, 5, 1089–1092. [Google Scholar] [CrossRef]
- Cavanaugh, K.C.; Kellner, J.R.; Forde, A.J.; Gruner, D.S.; Parker, J.D.; Rodriguez, W.; Feller, I.C. Poleward expansion of mangroves is a threshold response to decreased frequency of extreme cold events. Proc. Natl. Acad. Sci. USA 2014, 111, 723–727. [Google Scholar] [CrossRef]
- Curnick, D.J.; Pettorelli, N.; Amir, A.A.; Balke, T.; Barbier, E.B.; Crooks, S.; Dahdouh-Guebas, F.; Duncan, C.; Endsor, C.; Friess, D.A.; et al. The value of small mangrove patches. Science 2019, 363, 239. [Google Scholar] [PubMed]
- The Palawan Council for Sustainable Development (PCSD). Baseline Report on Coastal Resources for Coron, Municipality; Palawan Council for Sustainable Development: Puerto Princesa City, Philippines, 2006.
- Alura, D.P.; Alura, N.C.; Alura, R.P.C. Mangrove forest and seagrass bed of eastern samar, philippines: Extent of damage by typhoon yolanda. Int. J. Nov. Res. Life Sci. 2015, 2, 30–35. [Google Scholar]
- Abrenica, M.; Ilagan, G.; Liuag, H.; Napeñas, A.; Tabion, R.; Tamina, R. Municipality of Coron Ecan Resource Management Plan 2017–2022; Che-dcerp; University of the Philippines: Los Baños, Philippines, 2017. [Google Scholar]
- Alcala, A.C.; Bucol, A.A.; Nillos-Kleiven, P. Directory of Marine Reserves in the Visayas, Philippines; Foundation for the Philippine Environment and Silliman University-Angelo King Center for Research and Environmental Management (SUAKCREM): Dumaguete City, Philippines, 2008. [Google Scholar]
Figure 1.
Study Areas: (Left) Mangrove Areas of some of the villages in the Municipality of Coron, Palawan; (Right) Mangrove Areas of the Municipalities of Balangiga and Lawaan in Eastern Samar.
Figure 1.
Study Areas: (Left) Mangrove Areas of some of the villages in the Municipality of Coron, Palawan; (Right) Mangrove Areas of the Municipalities of Balangiga and Lawaan in Eastern Samar.

Figure 2.
Change of mangroves distribution of Coron in 1987–2016.

Figure 3.
Change of mangroves distribution of Balangiga-Lawaan in 1989–2016.

Figure 4.
Areal extent changes of mangroves in Coron and Balangiga-Lawaan during the study period.

Figure 5.
Areal change detection analysis of Coron and Balangia-Lawaan mangroves in multiple Decadal Periods (1987–2016).
Figure 5.
Areal change detection analysis of Coron and Balangia-Lawaan mangroves in multiple Decadal Periods (1987–2016).

Figure 6.
Landscape Metrics Comparison for Coron and Balangiga-Lawaan Mangroves (clockwise from top left): Class Area (CA); Patch Density (PD); Aggregation Index (AI); and Edge Density (ED).
Figure 6.
Landscape Metrics Comparison for Coron and Balangiga-Lawaan Mangroves (clockwise from top left): Class Area (CA); Patch Density (PD); Aggregation Index (AI); and Edge Density (ED).

Figure 7.
Areal changes of mangroves (lines) and yearly frequency of tropical cyclones (bars).

© 2019 by the authors. Licensee MDPI, Basel, Switzerland. This article is an open access article distributed under the terms and conditions of the Creative Commons Attribution (CC BY) license (http://creativecommons.org/licenses/by/4.0/).
Share and Cite
MDPI and ACS Style
Buitre, M.J.C.; Zhang, H.; Lin, H. The Mangrove Forests Change and Impacts from Tropical Cyclones in the Philippines Using Time Series Satellite Imagery. Remote Sens. 2019, 11, 688. https://doi.org/10.3390/rs11060688
AMA Style
Buitre MJC, Zhang H, Lin H. The Mangrove Forests Change and Impacts from Tropical Cyclones in the Philippines Using Time Series Satellite Imagery. Remote Sensing. 2019; 11(6):688. https://doi.org/10.3390/rs11060688
Chicago/Turabian StyleBuitre, Mary Joy C., Hongsheng Zhang, and Hui Lin. 2019. "The Mangrove Forests Change and Impacts from Tropical Cyclones in the Philippines Using Time Series Satellite Imagery" Remote Sensing 11, no. 6: 688. https://doi.org/10.3390/rs11060688
Note that from the first issue of 2016, this journal uses article numbers instead of page numbers. See further details here.