Learning Excel: Basics, Dashboards, Power Query/Get & Transform
Vanessa Da Costa, MPH
Data Consultant | I help orgs working on human & equity-centered programs & projects make sense of their data through collaborative data analytics, visualization, & evaluation services
For those of us with a background in public health, we are often taught in courses how to manage, analyze, and visualize data using SAS, STATA, R, or other data/statistical analysis programs. Those with a programming background in computer science, data science, web development, application development or other related fields are often taught how to code using Python, Java, and HTML among others. However, one platform that is just as relevant but sometimes overlooked is Excel. One practice almost every industry has in common is the use of data to drive decision making and develop solutions. Excel is a tool that is used industry wide and worldwide to contribute to those efforts. As an Excel enthusiast (yes, that's a thing) I'm excited to share with you 3 resources ranging from beginner to advanced to help you navigate Excel for your current and future needs.
"One practice almost every industry has in common is the use of data to drive decision making and develop solutions. Excel is a tool that is used industry wide and worldwide to contribute to those efforts."
Beginner Excel: Back to the Basics. Complete this 29 video tutorial on YouTube by GCF Global. These videos are easy to follow along with because each video ranges from 1-5 minutes and teaches you the basics of Excel. This include how to format cells, create conditional formatting, make charts and graphs, use shortcuts to streamline updates, and create simple formulas. This training also provides an introduction to pivot tables (a summary of data as sums, averages, or other statistical calculations). For further pivot table guidance, checkout this pivot training tutorial. Pivot tables are the foundation of many excel steps (including the development of interactive Excel dashboards mentioned below). This resource can help you get started!
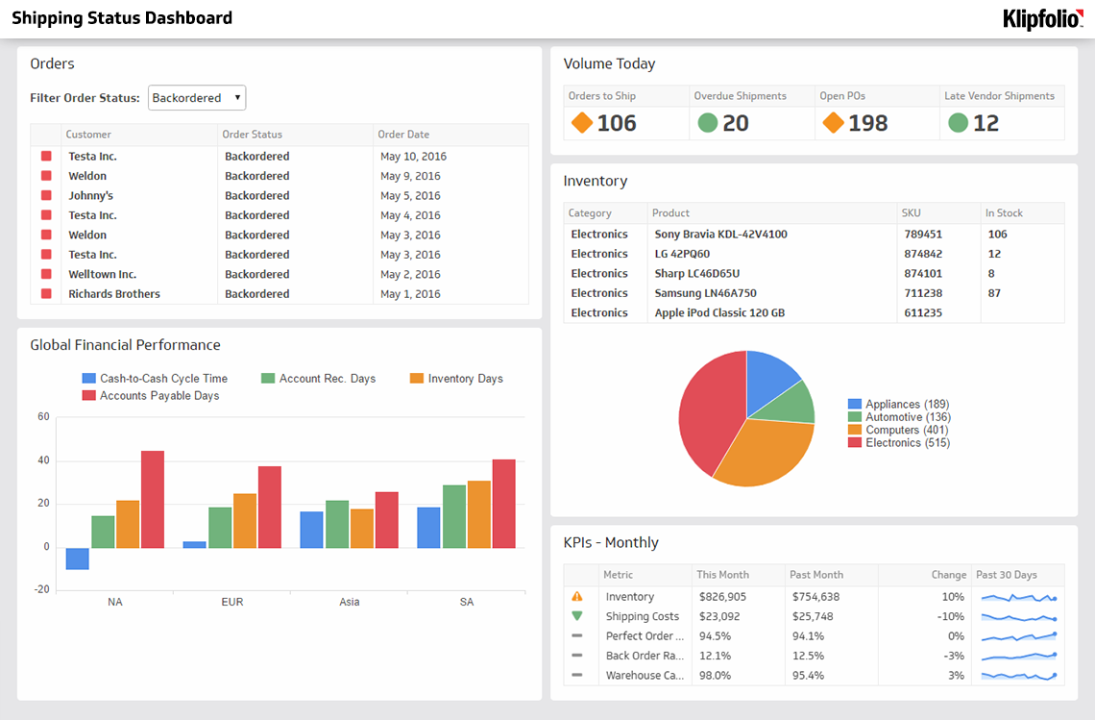
Intermediate Excel: Building an Interactive Excel Dashboard. This is a time when COVID-19 data visualizations are communicated via public media (i.e. tv, online) daily. Many of these visualization and interactive dashboards are developed using data visualization platforms such as Power BI or Tableau. If you don't have access to those platforms for personal or professional use, don't worry-interactive dashboards can also be developed using Excel! This Interactive Excel Dashboard Tutorial is just under 1 hour. It will teach you the fundamental skills needed to create an interactive dashboard with slicers, like the image below. You'll then be able to create a visually pleasing tool to help your audience monitor and review real-time data and Key Performance Indicators (KPIs).

Photo credit: 'How to build Interactive Excel Dashboards by My Online Training Hub via YouTube.'
Advanced Excel: Automating Processes via Power Query/Get and Transform. Power Query/ Get and Transform is truly a game changer for anyone who has to regularly manage, extract, wrangle/transform, and visualize data in Excel. This video series by TrumpExcel will get you up to speed. This feature is available as an add-in on the Data tab in the Windows version of Excel, and is not available in the Mac version of Excel. Power Query/Get and Transform uses the M query language and allows you to set-up automated changes to datasets to streamline processes and avoid repetition. For example, if your raw dataset has the 'date' column written as 2020/09, but you need it separated out into month and year indefinitely, you could create a step that creates 2 columns: 'month' as September and 'year' as 2020. Once this is set-up, you do not need to change or update the step even if there is new data (rows) added to the dataset in the future. Exceptions do apply, as you will learn as you delve further into this platform. There are many features of Power Query/Get and Transform that can help you turn a raw dataset into a final/ ready for analysis or visualization dataset.
Note that the above is not exhaustive, and there are many other Excel skills not mentioned. Whether you're a project manager, data analyst, administrative assistant, or trying to automate a personal or business budget, we hope that these resources can help you get started with Excel!
About the Author: Vanessa Da Costa is a Global Health Professional and the Founder and CEO of Chilombo Global Career Services. Vanessa primarily works in public health programming in the areas of data management, analytics, and visualization. Through her work with Chilombo Careers, Vanessa specializes in career development services (resumes, cover letters, and more) for students and professionals worldwide. To learn more about Chilombo Careers or to access career tips, advice, and services connect with us on LinkedIn, Facebook, Twitter, Instagram, or YouTube!
✋🏽 Stop Funding Your Business With Your Own Money & Invest In Properly Structuring Your Company So You Can Be Set For Life | The Benefits of Having Business Credit Are Virtually Unlimited!
1yVanessa, I like this ,thanks for sharing!
Creative Strategist | Coach
2yThanks for sharing Vanessa!
STEM Workforce Policy Researcher | Speaker on Data Career Design | Adjunct Professor in Biostatistics
3yThese look like excellent resources for accelerating experience with dashboard development! Thanks so much for sharing, Vanessa.
Epidemiologist at Centers for Disease Control and Prevention
3yJamia Haynes, BSPH