What follows is a general theory of natural climate variation supported by observation of the changing temperature of the atmosphere and the sea between 1948 and September 2009. This work suggests that strong warming after 1978 is an entirely natural phenomenon and that a cycle of cooling is imminent.
Imagine a small planet about the size of the Earth orbiting a sun just like our own. The planet has an atmosphere composed of nitrogen (76%), oxygen (23%) and trace gases (1%) of which argon makes up half of that one percent.
Let us further imagine that the sun bombards the Earth with radiation so energetic as to destroy the integrity of nitrogen and oxygen in the planet’s upper atmosphere. The region where this occurs may be called the ‘ionosphere’. When superheated at the highest elevations it can be known as the ‘thermosphere’. The electrically unbalanced particles of the ionosphere possess negative or a positive polarity. Like iron filings scattered across a piece of paper atop a magnetized iron bar, atmospheric ions orient themselves according to the lines of the planets magnetic field. Rotating with the planet, the ionosphere is a place of constant flux. Particles are energized on the dayside and dragged into a long tail on the night-side by the pressure of the solar wind, a highly magnetized stream of helium and hydrogen emanating from the sun. There is an exchange of energy between the wind and the ionosphere and particles are accelerated in one direction or the other and re-distributed according to the tension imposed by the constantly changing electromagnetic medium.
As ionized particles radiate energy and cool they will join up with particles of opposite polarity. The junction of one with the other moves the union closer to a ‘neutral’ state. The orgy of irradiation, excitement, and reorientation, begins anew each day as the sun appears above the horizon. Recombination occurs mainly at night.
Nitrogen requires the most energetic short wave radiation to achieve the ionic state. This energy is available at a higher altitude. Oxygen ions are scarce at altitudes where nitrogen ions are formed because when the music stops, ions of nitrogen grab oxygen partners just as happily as nitrogen partners and there are many more nitrogen partners than oxygen partners.
Where free oxygen ions exist, they do so at a lower level where there is insufficient very short wave radiation to ionize nitrogen.
So, we have two regions of an ionosphere, the lower oxygen rich and the upper oxygen poor and nitrogen rich, ‘ionically’ speaking.
Ions of oxygen will hold hands in groups of three in a molecule called ozone. Although this happens only to a limited extent, it nevertheless creates an ozone rich layer. We call it the stratosphere.
The cumbersome ozone molecule has an ability to trap the relatively long wave radiation of the planet and also some radiation from the sun at the long end of the short wave spectrum. Consequently this ozone rich layer is warmer than the atmosphere above and below it.
The depth of the atmosphere beneath the ozone rich layer is, in the context of the size of the earth, hardly skin deep (only 10Km at mid latitudes and 15Km at the equator) but nevertheless sufficient to effectively cool the Earth. In dry air the lapse rate is 10°C per kilometer. The upper troposphere is very much colder than the surface of the planet. So we must (reluctantly perhaps) conclude that the atmosphere is a very effective vent for surface heat.
Though about three quarters of the atmosphere is below the stratosphere and free of the influence of an electromagnetic field, the remaining portion of the atmosphere is very much under its influence. That part is very much more influential in determining climate at the surface than the 0.04% which is carbon dioxide.
The tropical troposphere tends to lose energy by decompression associated with uplift whereas the subtropical latitudes is a place of descending, compressing air where long wave radiation is the chief means of energy removal. Where decompression is vigorous, the upper troposphere cools to minus 85°C. Elsewhere it reaches a temperature of about minus 55°C. As the equatorial region has warmed the quantum of long wave radiation from the near equatorial zone has diminished while in the subtropics by contrast, where the air is descending, long wave radiation has increased. In the subtropics increased radiation is a signature of a warm and cloud free troposphere and increased radiation incident at the surface. Here is a characteristic of climate change in action.
The surface of the planet is 70% water and the atmosphere near the surface is water vapor rich. Because the air at 1000 meters elevation is already between 6 and 10°C cooler than the surface, clouds of moisture form in rising air. At an elevation of two to four kilometers condensing moisture forms, not water droplets, but ice crystals of many and varied patterns and considerable surface area. Ice crystals populate the atmosphere at a density so low as to make them virtually invisible. But, the ice crystal zone stretches from about 2km to 25km in elevation and it is therefore very much deeper and potentially more reflective than the water droplet zone.
Sensibly therefore, we might expect the temperature at the surface of the planet to relate strongly to the extent of ice crystal formation. Since the upper atmosphere tends to have much the same level of moisture all the time, the population of ice crystals varies inversely with air temperature.
How could the temperature of the ice cloud region change?
The concentration of ozone in the stratosphere and upper troposphere depends upon the rate of mixing of oxygen hungry, mesospheric nitrogen ions into the stratosphere. Where does this mixing occur?
Most of the land is in the northern hemisphere but there is none at the northern pole. Strangely there is a massive landmass at the southern pole. Here the surface is very cold all the year round and particularly so in winter.
The temperature of the Antarctic ice mound is always below the freezing point of water. Any precipitation that falls upon it is trapped. Ice surface area doubles in winter by virtue of the freezing of the sea on its margin. A downdraft is present at all times and it is particularly powerful in winter.
The circulation of the atmosphere is driven by differences in surface temperature and the release of latent heat giving rise to columns of rising air particularly over the tropical rain forests. Air descends over the cold oceans in the subtropics and also over the Polar Regions especially in their winter season when the pole is dark and the surface is at its coldest.
The column of descending air over the Antarctic continent stretches into the mesosphere.
Because nitrogen from the mesosphere enters the stratosphere primarily over the Antarctic continent there is less ozone in the southern hemisphere than the northern hemisphere. But when the downward flow of air within the vortex stalls, ozone builds up throughout the stratosphere and to a more limited but very influential extent in the upper troposphere. The mixing rate of ozone into the upper troposphere varies with latitude.
As the ozone content of the ice cloud region rises, so does its temperature. This depletes ice cloud allowing more solar radiation to reach the surface.
Can a reorientation in the direction, mass density or speed of the ‘solar wind’ or perhaps a change in the intensity of ionizing radiation or a change in the Earth’s magnetic field or a mix of all three shift air from high to low latitudes, lowering surface pressure there and raising it somewhere else? Unambiguously, the answer is yes. There is no process internal to the Earth itself that could account for this shift in the atmosphere. It depends wholly upon the magnetic fields in the ionosphere and the exchange of energy between the solar wind and the ionized atmsophere. So, the distribution of the atmosphere by latitude is determined by the sun and the earth together.
Figure 1 shows the loss of atmospheric pressure at 70-90° south latitude after 1948. Most of the depletion occurred before 1976. However, the forces that created this changed state have continued to maintain it. Not only can the atmosphere move, it can be held in position by the electromagnetic force and it will stay in place until that force relaxes.
Figure 1
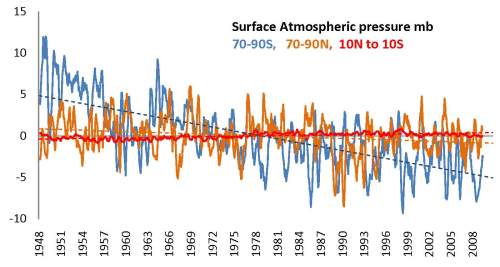
Change in surface atmospheric pressure
Where and when did surface pressure change?
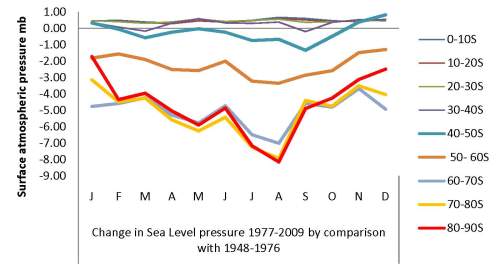
Figure 2 compares the period of global warming after 1977 to the period of relatively stable or cooling temperature prior to 1977.
The change in the atmosphere is striking. After 1977 there is a loss of pressure increasing with latitude between 40° and 90° south latitude, especially in winter. A loss of pressure weakens the vortex, reduces the influx of mesospheric nitrogen oxides allowing ozone levels to increase and stratospheric temperature to rise.
Between the equator and 30° south latitude surface atmospheric pressure has increased. At 40-50° south, which may be a transition zone, surface pressure increased in summer and fell in winter with greatest loss in September. Very similar dynamics manifest at 30-40° south but by and large this latitude has been once of increasing atmospheric pressure.
Figure 2
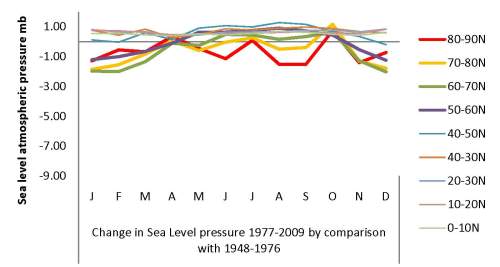
Looking now at the northern hemisphere as represented in figure 3, we observe a loss of pressure in the winter months at high latitudes with losses also in June, August and September. However, the loss of pressure is no more than 1mb, much less than in the southern hemisphere where pressure fell by 2 to 8mb south of 50° south latitude.
After 1977 atmospheric pressure increased in mid year between the equator and 50° north latitude. There is obviously a tendency for pressure to increase at high latitudes in the northern summer at the same time as pressure falls in the southern hemisphere. This represents an atmospheric shift from high latitudes of the southern hemisphere into the entirety of the northern hemisphere in northern summer. This should tend to increase northern vortex activity in the wing months of the northern winter.
Peak months for loss of pressure in high latitudes of the northern hemisphere are November through to February. At this time pressure rises at 40-50° south latitude (aqua line in figure 2). This represents an atmospheric shift from the northern to the southern hemisphere in northern winter. However, there is another contributing factor. It is probable that the Arctic vortex suffers from competitive downdraft activity over the very cold Siberian and North American land masses. It is noticeable that pressure loss in midwinter is greater at 60-70°N (olive green) than at 80-90°N (red).
The ‘Arctic Oscillation Index’ records change in the relationship between surface pressure close to the northern pole and that at mid latitudes in the northern hemisphere. Change in the index goes along with change in the nature of western European weather. It may appear that there are complex influences driving the Arctic Oscillation including perhaps the state of the downdrafts over Antarctica, continental Asia and North America. But in physical terms, the real driving force is electromagnetic and it can be shown that the A.O. index closely follows the flux in surface atmospheric pressure within the Arctic circle and that surface pressure at the north and south pole change in the same direction at the same time.
Figure 3
The relationship between pressure and surface temperature in the tropics
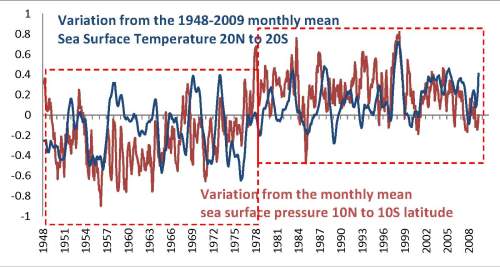
Figure 4 shows the relationship between atmospheric pressure near the equator and sea surface temperature at 20° north to 20° south globally. Warming of the tropics goes hand in hand with increased surface atmospheric pressure. This is a key understanding. It is counter-intuitive because hot air is less dense and will rise in the middle of a low pressure area. But here we have hot air under increased pressure. We are accustomed to observing high pressure air that is associated with subsidence and cloud free skies in the subtropics. This is different. This pressure regime is determined by a shift in the atmosphere from high to low latitudes.
The relationship between these variables is mediated by the change in atmospheric moisture levels. An illustration of this relationship is the failure of the tropics to warm when pressure increased in the year 1999-2000. The precipitation event that followed the marked increase in atmospheric moisture during the El Nino event of 1997-8 created its own momentum (increased atmospheric moisture and cloud cover) and overwhelmed the possibility of a response to the increase in pressure a year later, itself a response to electromagnetic activity in the upper atmosphere. If one appreciates this, we can dispense with the usual statistical tests, proceeding according to logic and the eye. Many a baby has been thrown out with the bathwater after the application of an inappropriate statistical test.
Figure 4
We know that El Nino activity in the Pacific is accompanied by a slackening of the Trades as the pressure difference between the south east Pacific (high pressure) and Indonesia (low pressure) falls away. Figure 5 shows that, when pressure rises in the Indonesian region, it falls very strongly in the waters off the coast of Chile. The weakening of the trade winds is a marker for El Nino activity in the Pacific. The change in pressure relations driving the trade winds is due to the movement of the atmosphere. That movement has its origin in electromagnetic activity in the upper atmosphere.
A glance at figure 4 reveals that the tropical sea cools when surface atmospheric pressure between 10°N to 10°S falls below its long term mean. Figure 6 shows that there is much greater activity in terms of pressure change in the waters off Chile than in the Indonesian theatre. Change in Chilean waters appears to precede change in Indonesia.
A shift in the atmosphere from high to low latitudes increases pressure at 30-40° south latitude. However, in the waters off Chile, we see a loss of pressure as pressure builds at the equator and this is particularly noticeable in March and September when geomagnetic activity peaks due to the favorable orientation of the Earth to the sun at the equinoxes. Surface pressure off Chile at 30-40° south behaves atypically for the latitude. It moves with polar pressure rather than low latitude pressure. This makes Pacific sea surface temperature particularly susceptible to influence from shifts in the atmosphere that changes polar pressure, vortex strength, upper atmosphere ozone content and therefore atmospheric opacity .
Figure 5
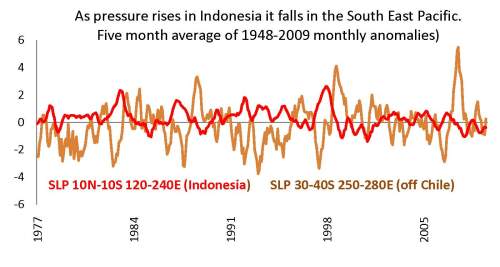
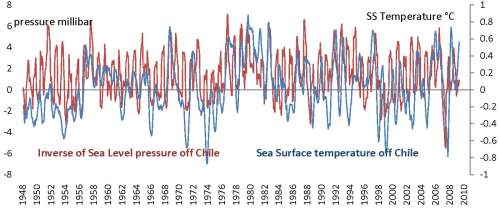
Figure 6 shows that when atmospheric pressure falls off Chile (in figure 6 pressure is inverted so that a rise in the pressure line actually represents falling pressure) sea surface temperature in the intake region for Nino 1 and Nino 2 warms. An increase in the temperature of tropical waters follows as a matter of course. The thing that controls the atmospheric pressure controls the temperature of tropical waters and ultimately the globe. That ‘thing’ is the electromagnetic force in the upper atmosphere. The change in surface temperature is due to a change in the ratio between radiation received at the limits of the atmosphere (almost a constant) and radiation reflected by ice crystals. Variation in reflection is responsible for change in the intensity of radiation received at the surface.
Figure 6
The temperature of the polar stratosphere increases at the time of the year when atmospheric pressure falls.
Figure 7 indicates a marked increase in stratospheric temperature at 10hPa post 1977 that is coincident with the fall in atmospheric pressure illustrated in figure 2.
There can be no shadow of doubt that the increase in the temperature of the upper stratosphere over Antarctica is associated with falling atmospheric pressure, the collapse of the vortex and a diminution of the flow of mesospheric nitrogen ions into the stratosphere. This allows an increase in ozone concentration which accounts for the increase in temperature both in the stratosphere and at the surface.
Ozone absorbs long wave radiation from the earth and UVB from the sun and this energy is rapidly transmitted to adjacent molecules. The upper atmosphere warms and as the ice crystal population falls in southern winter and spring, the temperature of the sea increases in the intake zones for the equatorial currents. In the Pacific this is called El Nino. The conventional explanation of this warming is at odds with reality. Most of the warming activity occurs outside the tropics. It is most pronounced in late winter and spring in the southern hemisphere and it is patently a phenomenon that shows up with greater intensity after the climate shift of 1978. Indeed, the increased frequency and intensity of southern hemisphere warming in spring lies at the heart of the warming of the globe after 1978.
Figure 7
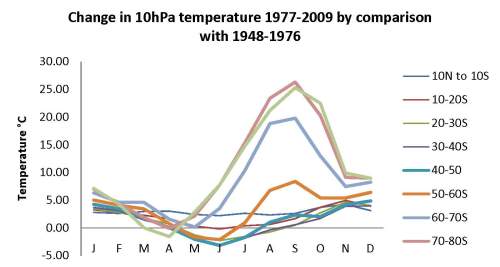
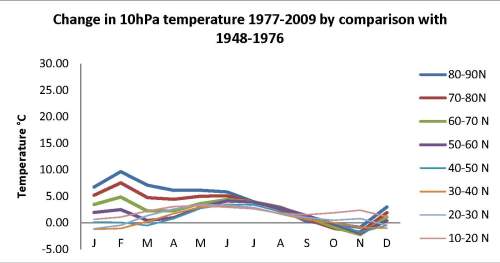
Figure 8 shows that the warming of the northern stratosphere at 10hpa in the middle of northern winter is insignificant if compared to the warming of the southern stratosphere. Stratospheric warming and cooling is just as lopsided as the distribution of the land between the hemispheres.
Some observers attribute sudden stratospheric warming in the polar night to ‘planetary waves’. But planetary waves are more evident in the northern than the southern hemisphere. These observers maintain that the Earthly climate system is free of external influences. Copernicus feared the response of the keepers of the conventional wisdom when he suggested that the sun was at the centre of the solar system rather than the Earth. He kept his opinions to himself until his theories were published close to his death in 1543. Galileo supported the Copernican viewpoint in a forthright fashion in 1632, was tried by his peers in the ‘Inquisition’ and spent the rest of his life in detention. Geo-centrism is alive and well to this day and it thrives in the field of climate science. Trial by ones peers can be a harrowing affair. As Galileo would no doubt observe: ‘My colleagues, though well meaning, are sadly deluded’.
Figure 8
The extent of warming of the polar stratosphere in winter increases with elevation
Figure 9 reveals that temperature gain in the Antarctic stratosphere after 1977 increases with elevation. This is in conformity with the notion that a mesospheric influence on stratospheric ozone is the driver of stratospheric temperature at the poles and it acts via a variation in vortex activity brought on by change in the weight of the atmospheric column as expressed in changing surface pressure.
Figure 9
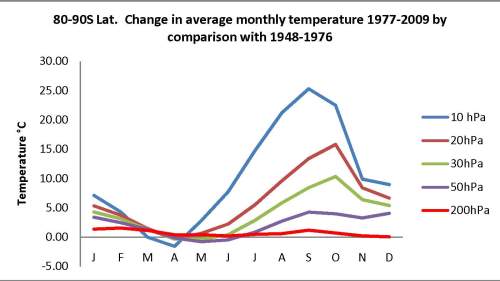
Figure 10, relating to the northern hemisphere shows temperature gain increasing with altitude as is the case in the southern hemisphere. Peak temperature gain is in February when surface pressure loss after 1977 is maximal (see figure 3).
Figure 10
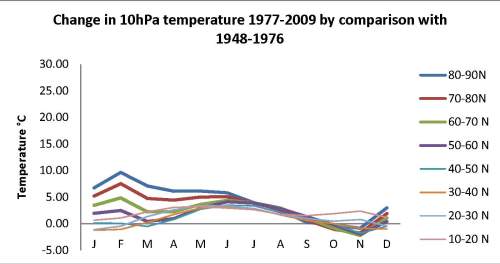
Figure 11 shows the relationship between surface atmospheric pressure in the tropics and the aa index of geomagnetic activity. Anomalies are calculated with respect to mean monthly data for the period 1948-2009. The trend lines are third order polynomials selected for best fit. It appears that this cycle may be about 80 years from trough to trough. A cycle of about this length has been called the Gleissburg cycle. The currently falling pressure at the equator heralds cooling. A simple projection of trend indicates perhaps thirty years of cooling ahead.
In considering figure 11 one must bear in mind that the atmosphere must first be ionized before it comes under the influence of the solar wind. We know little about the cycles in very short wave ionizing radiation. Nor, it seems do we know much about the driving force behind the change in the Earth’s magnetic field. The electromagnetic movement of the atmosphere is a multi-factorial phenomenon. Figure 11 deals with a single contributing factor and compares its oscillation with surface pressure near the equator. The field of change is much wider than the equator. The dynamics of pressure change are driven by many factors including the tilt of the Earth’s axis of rotation, the revolution of the earth around the sun, the distribution of the land and the sea, the variation in the temperature of the sea at the same latitude, variations in the magnetic emanations from the Sun and variations in the strength of the Earth’s magnetic field from place to place. At times surface pressure at both poles moves in the same direction and at other times pressure increases at one pole and decreases at the other. The atmosphere behaves quite differently when the earth is warm to when it is cool. The pressure systems move at quite different latitudes along with the jet stream.
Accordingly, one cannot say that geomagnetic activity drives surface temperature. It contributes as one element of a complex matrix in a constantly changing climate system. Do the climate modelers realize this?
Figure 11
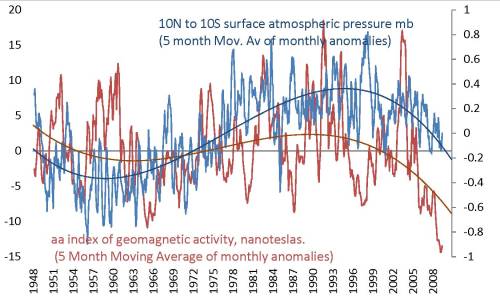
Figure 12 is astonishing in its symmetry. Prior to 1977 peak anomalies in 30hpa temperature at 80-90°S latitude occurred in April-May. After 1977 peak anomalies occur in October. After 1977 October anomalies are as strongly positive as they were negative prior to 1977. This change relates directly to the warming of the southern oceans in southern winter-spring that is expressed in El Nino activity in the Pacific. But the Pacific is only one of the theatres of action in the global tropics. All theatres of action are affected by change in atmospheric pressure in Antarctica.
Figure 12

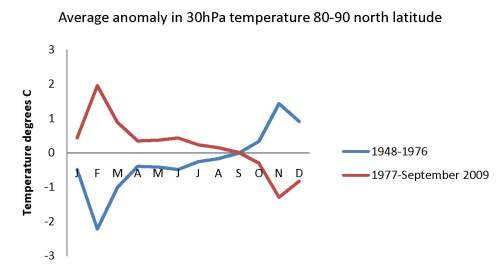
Figure 13 shows 30hpa temperature anomalies at 80-90°north in the Arctic. Again the symmetry is astonishing. Let there be no mistake. Here is evidence that the climate system is alternating between two very different modes of activity. One is a cooling mode and the other a warming mode. Temperature anomalies are positive only for a period of time, and they move to the negative. When October anomalies are positive in Antarctica they are negative in the Arctic and vice versa.
Figure 13
Consequences of the warming mode of 1977-2009 for the temperature in the ice cloud zone of the upper troposphere
Figure 14 shows the character of the warming mode that prevailed after 1977 in the northern upper troposphere at 200hPa. There is sufficient ozone at this level for temperature to be driven by vortex phenomena rather than surface phenomena.
In relation to the northern hemisphere: After 1977, at latitudes greater than 50° north, the upper troposphere warmed slightly in summer between June and November but is actually cooler during the winter months. At low latitudes the troposphere is warmer all year but particularly so in northern winter. I hope some greenhouse theorists read this. Perhaps they can explain how the upper troposphere can warm when outgoing long wave radiation is at its annual minimum.
Figure 14
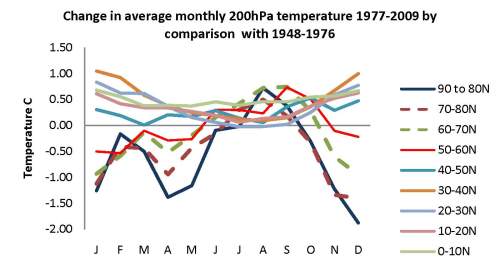
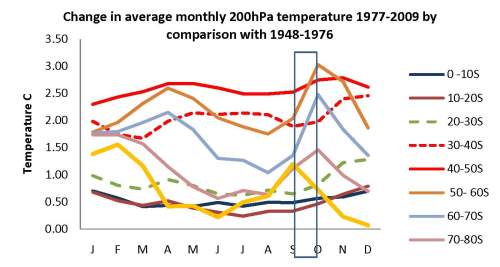
Figure 15 illustrates the dramatic influence of the warm mode on temperature in the southern hemisphere upper troposphere. Strong warming occurs between 20° and 70° south latitude. Peak warming occurs about the time of the equinoxes when the coupling of the solar wind with the Earth’s atmosphere is strongest.
When the polar vortex stalls, it allows ozone levels to rise at high altitudes above the pole. A strong peak in 200hpa temperature occurs in September at 80-90° south latitude and this peak appears at mid latitudes within a month, testifying to the speedy rate of mixing of ozone into the upper troposphere at 200hpa.
Figure 15
Surface temperature follows the lead of the stratosphere via change in ice cloud density
Figure 16 shows the relationship between the 20hpa temperature anomaly at 10° north to 10° south latitude on the one hand and sea surface temperature in the in-feed zone in the south east Pacific near Chile on the other. The obvious way that the stratosphere and upper troposphere can affect surface temperature is via change in ice cloud density affecting the reflectivity of the atmosphere. An increase in temperature reduces ice cloud density allowing more radiation to reach the surface.
High amplitude variation in 20hPa temperature is seen between 1950 and 1976 when geomagnetic activity, stratospheric and surface temperature was depressed. This phenomenon might be interpreted this way: When stratospheric temperature is low due to low ozone content (high surface pressure at the pole and strong vortex) a small reduction in the inflow of nitrogen ions from the mesosphere can produce a large change in ozone and 20hpa temperature. The law of diminishing returns applies. In periods where ozone levels are already high (low atmospheric pressure and collapsed vortex), the extent of change in 20hpa temperature from further collapse in the vortex is small.
After the year 2000 the flux in 20hpa temperature is large as it was during the cooling period prior to 1977.
Sea surface temperature in the south east Pacific follows 20hpa temperature with more fidelity and vigour after 1978 when change in southern hemisphere 200hpa temperature became the dominant mode of ENSO variation. Patently, the heating trend between 1977 and 2000 is due to a marked increase in the temperature of the ice cloud zone.
Figure 16
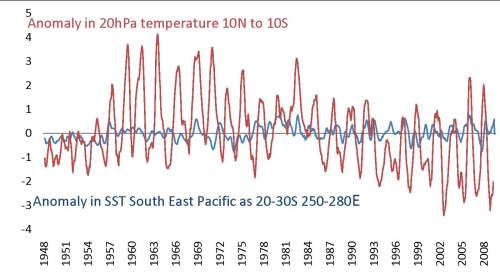
Figure 17 shows the relationship between 200 hPa (upper troposphere ice cloud zone) temperature and sea surface temperature at 40-50° north.
When the upper troposphere warms strongly, relative humidity must fall and the surface temperature response to high amplitude change in upper troposphere temperature then lacks coherence and vigour. Compare the cooling period after 1998 with the warming period ten years earlier. This observation suggests there is little increase in atmospheric moisture content as the troposphere warms. Moisture content, if it increases at all, lags the temperature increase. There is no amplifier here for a greenhouse effect.
Figure 17
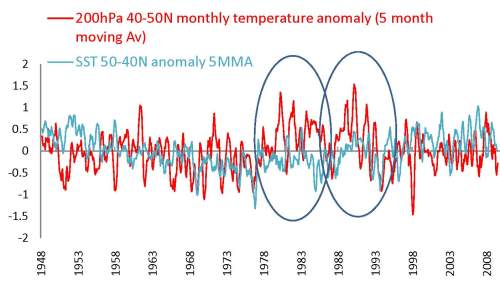
Figure 18 shows the increase in surface pressure that accompanies warming at 40-50° north latitude. The increase in pressure relates to falling pressure at the poles and an increase in the temperature of the stratosphere as ozone content builds.
Figure 18
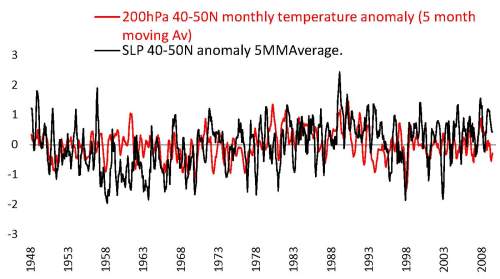
Figure 19 shows the repeating pattern of positive anomalies in 20hpa temperature in southern spring at 70-90° south and the frequent symmetry in the rise in sea surface temperature at 40-50° north. The relationship between these two variables will never be absolutely deterministic because of the other influences that impinge. Firstly, there is the independent activity in the northern vortex as it becomes more or less active leading into northern winter. Secondly, the flux in high altitude specific humidity determines the response rate. Thirdly, the atmosphere is never homogeneous consisting as it does of a series of traveling pressure cells responding to forces that move them as a band either towards or away from the poles.
Repeating positive anomalies in southern spring is the essence of the change that occurred in the climate system after 1978. When these anomalies disappear, the earth will cool. This can only happen as the atmospheric shift away from Antarctica goes into reverse.
Figure 19
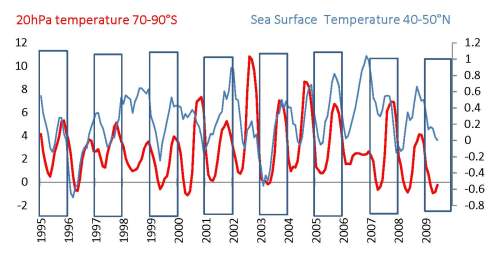
There is great interest in the driver of sea surface temperature in the North Atlantic and the North Pacific. Enormous store is put in the notion that the Pacific Decadal Oscillation is capable of influencing global temperatures and potentially reversing the trend in global warming. However, the actual forces determining sea surface and global temperature lie in the upper atmosphere rather than in the oceans themselves. There is no mystery as to where warm water appears or does not appear. It is always at the surface and it is always dissipating into the atmosphere via evaporative transfer, surface contact and radiation. There is only one thing that can warm the surface of the sea on a large scale and that is solar radiation.
The temperature of the southern stratosphere increased much more than the northern stratosphere after 1977
In line with the dominance of the southern vortex in determining stratospheric temperature we would expect a strong increase in temperature in the high latitudes of the southern hemisphere over the period of study. Figure 20 shows a 12 month moving average of 30hpa temperature in selected latitude bands of the southern hemisphere. It is apparent that the last great rise in 30hpa temperature at 80-90° south occurred just prior to the climate shift of 1978. Can planetary wave theorists explain this warming of the stratosphere above Antarctica at this time?
What theory explains why the high latitudes of the southern hemisphere have warmed so strongly while in low latitudes the stratosphere has cooled? Changes in gas composition will not suffice. Planetary waves will not suffice.
As the atmosphere shifts to mid and low latitudes the zone of heaviest ozone concentration in the stratosphere moves a little further away from the earth. This produces cooling. There has been a continuous fall in 30hpa temperature at 0-10° south latitude over the period. This may be due in part to the reduction in outgoing long wave radiation as cooling via decompression has become more important close to the equator. But, between 20° and 40° south the cooling of the stratosphere is likely related to the local thickening of the atmosphere.
Figure 20
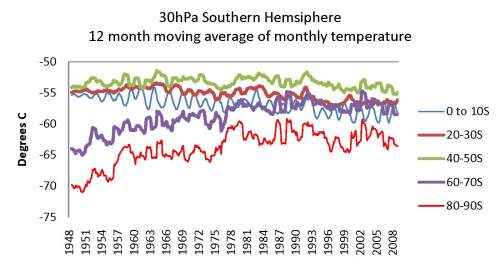
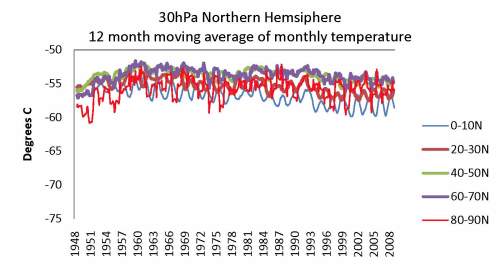
Figure 21 shows that, as the atmosphere in the northern hemisphere has ‘thickened’, due to the atmospheric shift, 30hpa temperature has declined slightly at all latitudes. This has nothing to do with greenhouse gas activity in the troposphere. Greenhouse theorists who maintain that the stratosphere cools while the troposphere increases in temperature may care to comment on the rise in the temperature of the Arctic stratosphere between 1948 and 1978!
Figure 21
Two climate modes
“Mad dogs and Englishmen go out in the midday sun. The sun is much too sultry and one must avoid its ultry violet rays”. Noel Coward 1932.
Perhaps Noel Coward’s observation is particularly pertinent in the southern hemispherewhere there is less ozone to absorb UVB. During the warming mode, protective ice crystals evaporate, allowing the surface to warm. Most of the warming activity post 1978 has been in the southern hemisphere in late winter and spring. This warming activity is plainly driven by shifts in atmospheric pressure affecting vortex activity.
The warming mode:
- There is a shift of the atmosphere from the poles towards mid and low latitudes under electromagnetic forcing of ionized air.
- Weakening of the polar vortexes curtails the flow of ionized nitrogen into the upper stratosphere allowing the survival of oxygen ions and increased ozone formation.
- Intermixing of ozone into the upper troposphere raises temperature in the ice cloud zone. Ice crystals evaporate.
- More solar radiation reaches the surface which warms.
- In the southern hemisphere 200hpa temperature rises much more than in the northern hemisphere exhibiting strong equinoctial maxima.
- Peak anomalies in stratospheric temperature occur in September-October rather than March.
- A southern spring deficit in ice cloud density promotes warming across all southern latitudes which promotes the El Nino pattern of sea surface warming at the equator.
The Cooling Mode
- Surface atmospheric pressure increases at the poles as the electromagnetic force in the ionosphere/thermosphere relaxes. This happens at solar minimum as the quantum of ionizing radiation falls to its lowest levels. It also tends to happen at solar maximum as the suns magnetic polarity reverses and magnetic fields emanating from the sun tend to be self cancelling. The manifestation in the Pacific Ocean is La Nina cooling.
- Strengthening of the polar vortexes introduces ionized nitrogen into the stratosphere reducing the population of oxygen ions and ozone.
- A loss of ozone in the ice cloud zone reduces temperature enhancing the formation of reflective ice crystals.
- Less solar radiation reaches the surface which cools.
- A generally low ozone level in the stratosphere results in high amplitude change in stratospheric temperature during the ENSO cycle. This is expressed in high amplitude variation in 20hpa temperature at the equator. At the surface, the swing from El Nino warming to La Nina cooling is more violent and extreme.
- Change is more extreme in the southern hemisphere where the polar vortex is generally cooler especially at the highest altitudes. In the cool mode stratospheric temperature exhibits a March maximum probably in line with enhancement of orbital rather than geomagnetic influences on stratospheric temperature. The earth is closest to the sun in January.
- A cooler stratosphere and upper troposphere in southern spring promotes ice cloud formation reducing the flux of solar radiation to the surface establishing a La Nina dominant regime in the Pacific Ocean.
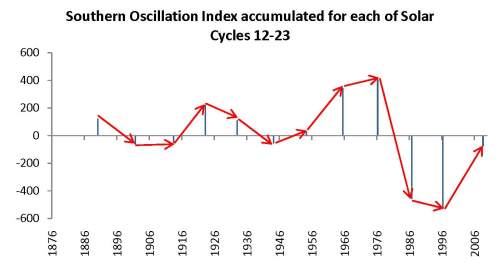
The pattern of change from the cool to the warm mode and back again is well expressed in figure 22 showing the pattern of change of the (Darwin –Tahiti) Southern Oscillation Index when compartmentalized according to solar cycle time intervals. A fall in this index represents warming. A dramatic fall in the index occurred about 1978. With the end of solar cycle 23 the globe is emerging from the strongest period of warming in the period of the instrumental record. The Southern Oscillation Index, based on barometric pressure, is not affected by the distortions present in the temperature record.
Figure 22
The smoking gun for natural climate variation is an increase in the temperature of the southern stratosphere and troposphere increasing with latitude all the way to the southern pole with a marked variation in southern hemisphere temperature in winter/spring between cool and warm episodes. This determines the strength of El Nino warming events across the tropics.
The smoking gun for greenhouse effects should be a generalized warming at all latitudes without any marked seasonal bias. If there were to be a seasonal bias it should be present as an increase in temperature above the norm when outgoing long wave radiation is maximal in the summer season. There should be no great difference between the hemispheres. That is far from what is actually observed. The evidence suggests that natural variation rather than anthropogenic influences drives climate change.
Conclusion
Between 1948 and 1976 the tropics and the globe as a whole was fairly stable in temperature with obvious cooling discernable in the decade prior to 1976. From 1977 through to 2000 the tropics and the globe warmed. By comparing data from the earlier period with that for the later period one can discern change in the atmosphere that resulted in more solar radiation reaching the surface of the earth causing it to warm.
Atmospheric conditions in the near earth environment are strongly influenced by the sun. The observed warming of the last decades of the twentieth century can be attributed to natural influences. There is no evidence of any warming signature due to the increased presence of so called ‘greenhouses gases’. It is suggested that the greenhouse hypothesis takes little cognizance of the manner in which the atmosphere actually functions. The atmosphere cools the planet but a change in its temperature causes a change in ice crystal density and the quantum of radiation reaching the surface.
Climatic models suggest that any greenhouse effect should be strongest in the tropical upper troposphere where water vapor is in higher concentration. In point of fact warming of the upper troposphere at the equator is less likely as the globe warms because the quantum of outgoing radiation diminishes as convection and de-compressive cooling is enhanced. It is in the subtropics that outgoing long wave radiation increases and in particular in the high pressure cells where the air is descending and warming and the sky tends to be cloud -free both in terms of liquid and ice crystal density. A water vapor feedback mechanism would require an increase in specific humidity levels in these high pressure areas. The reverse is observed. If a greenhouse effect were present it would be unamplified and tiny. Any warming tendency in these areas is more likely to be due to a loss of ice cloud density than a greenhouse effect.
If the Earth enters a period of cooling, as it has since 1998, it suggests that the natural factor is pre-eminent. If there is a strong relationship between ice cloud density and surface temperature it confirms the point that moisture in the upper troposphere cools rather than warms the planet and the basis of the greenhouse feedback mechanism is negated. Without a water vapor amplifier a change in so called ‘greenhouse gas’ levels can have little or no effect upon surface temperature.
If we can rid ourselves of the foolish mantra that surface temperature is governed by so called greenhouse gas, much unnecessary pain can be avoided. We are threatened by zealous governments keen to interfere in markets, raise taxation and redistribute incomes. The absurd notion that carbon is a pollutant is daily promoted. ‘Will of the wisp’ schemes to generate renewable energy burden the public purse. Nothing is to be gained by these stratagems. Innovation has its own rewards and investment in all forms of innovation is already well enough subsidized and feverishly exploited. Man needs no urging to innovate and will do so quite happily in the absence of artificially inflated monetary incentives. The introduction of market distorting incentives and disincentives destroys rather than creates wealth. This is the tool of the central planner, the social activist, the miscreant.
Distraction and absurdity are our unhappy lot, parading as morality and virtue. Snake oil salesmen multiply by the minute. These are unfortunate times.
There are none so blind as those who will not see. The authority of ‘Science’ and the United Nations organization has been subverted to the activists cause. This is a sorry time for mankind. It is a time when belief is substituted for science and the two are irretrievably tangled and confused.
DATA
The data used in this study can be downloaded from: http://www.esrl.noaa.gov/psd/cgi-bin/data/timeseries/timeseries1.pl
As I understand it the NCEP/NCAR reanalysis project uses a computer model to cross check the validity of data from many sources with the aim of representing the surface and the atmosphere of the entire globe. Data for one atmospheric parameter is related to other parameters that vary together in a known fashion. When a temperature recording station shifts site there is a discontinuity in the data. The reanalysis project is designed to overcome this sort of problem. This dataset is particularly valuable for research on climate change.
The sea surface data from the NCEP/NCAR dataset exhibits much greater variability than other Sea surface temperature datasets. The NCEP/NCAR data reflects skin temperatures that respond rapidly to atmospheric change. Winter minima are lower while summer maxima are similar. Change is faster in the skin data with earlier seasonal maxima and minima.The NCEP /NCAR sea surface temperature data incorporates ice and land surface temperature at high latitudes.
I understand that satellite derived sea surface temperature data for areas beyond about 60° latitude requires an adjustment for the extent of floating ice. Some SST datasets do not extend to higher latitudes. Because the NCEP/NCAR dataset provides skin temperature it covers all latitudes.
Some sources of SST data relate more to a near surface rather than a skin temperature reflecting the origin of data in the measurement of water temperature from engine intake, bucket or floating buoy. This is not the case with the NCEP/NCAR dataset.
P.S. This piece was revised in May 2010. It was corrected via the inclusion of missing letters, minor improvements in expression, correction of an error in reporting the concentration of carbon dioxide in the atmosphere and the elimination of a comment that was in poor taste.
This paper (or maybe a synopsis) should be OBLIGATORY reading for all delegates of the UN climate change junket in Copenhagen, a reality check for the misadvised and AGW fundamentalist junta.
By: De Vivar. on November 8, 2009
at 12:01 pm
Erl, great article. I don’t pretend to understand it all yet, but it seems to me to be obvious that the gases which make up the largest portion of the atmosphere have the most effect. Nitrogen, oxygen, water vapour/ice crystals. Co2 is a bit player.
One thing that springs to mind is the pyrheliometry studies of Doug Hoyt. Would these not reveal changes in ice crystal density? He reports no overall trend globally for atmospheric transmission of incoming radiation. Maybe worth looking at antarctic pyrheliometry?
Keep it up, you are getting warmer… Stay cool.
TB
By: tallbloke on November 8, 2009
at 8:04 pm
Hi Tallbloke. You need to have a very close look at this article. It clearly establishes for the first time that the essence of climate change lies in the waxing and waning of the SOI. And the SOI is clearly driven from the Stratosphere-Mesosphere. If you can follow the introduction and appreciate the importance of figures 11 through to 15 you have got it.
Thanks for the suggestion and I will follow it up.
By: erlhapp on November 8, 2009
at 9:43 pm
My Gawd Earl,
Thou must have a manager of utmost skill and dedication managing your vinyards. It surely cost you and eternity to investigate your claims.
I hope you compensate your charges well and they ccast the villians to the fire.
I have been overly worshiped for dropping my apple.
I hope I find you in good health and spirit,
Isaac Newton
P.S. and no I be not a jew.
By: Nano Drv on February 5, 2010
at 4:29 pm
You don’t understand De Vivar. The UN and the Warmists could care less about scientific proofs or explainations. They don’t care about facts. They just care about cash and how much they can con out of the US, Canada, and the EU. No cash and they will fade away muttering
“racist fascists.”
By: C. H. Booker on November 9, 2009
at 1:52 am
Nice article, neat theory and all around great stuff BUT … it will fall on deaf ears. Especially if world average temperatures go up, and exactly what prevents that?
The Big Lie in these insane times is the idea that “Global Warming” would be a catastrophe of unimaginable horrors. It would not!
Warmer weather, longer growing seasons, more rain, CO2 enhance crop production, lower heating costs, less ice and snow etc. By most measures a warmer world would be a better world.
Should “Global Warming” become a non-problem esoteric arguments as to its cause will become strictly academic.
By: Steve Case on November 9, 2009
at 8:25 am
Steve, thanks for the comment. World average temperatures will decline. But, I agree with you when you imply that the globe is by and large a little cool. Most people when they retire head for warmer climates, especially in the winter.
Whatever happens we are better off knowing the ways things work. Unless we know people are open to exploitation by those who wish to push an agenda.
By: erlhapp on November 9, 2009
at 9:29 am
There seems to be quite a dependence on ice crystal density, but I don’t see any evidence showing their changes with your conclusions. Do you have evidence of changes in ice crystal density?
Interesting paper. Thank you.
By: Michael D Smith on November 9, 2009
at 8:57 am
Michael, Thanks for your observations. I don’t think anyone has evidence of change in ice crystal density influencing the flux of radiation to the surface. But the relationship between temperature in the upper atmosphere and temperature at the surface is unequivocal and if you trace that back it very clearly relates to the interaction of the mesosphere with the stratosphere in the polar regions. So, regardless of what the mechanism is, there is a chain of linkages between the sun and the surface temperature.
Temperature in the upper troposphere varies by much more than temperature at the surface. It is maintained by some people that the sun heats the Earth and the Earth heats the atmosphere. But, can a rise of one degree at the surface produce a rise of three degrees at 200hPa? Now, look at it from the other end. Could a rise of three degrees at 200hPa cause a rise of 1 degree at the surface? From your understanding of physics is the latter not a more reasonable proposition?
Water can be present in the atmosphere as vapour, a liquid or a solid state. In the vapour state it does not inhibit the transmission of light. But in the other states it certainly does. If you wanted best bang for your buck which state would you choose if you wanted to inhibit light transmission?
By: erlhapp on November 9, 2009
at 9:46 am
[…] This post was mentioned on Twitter by Jeremy McNamara and Priority 1 Medical, Nathan Woodford. Nathan Woodford said: Here is omething you probably want to know about climate change: http://bit.ly/3SNFQ […]
By: Tweets that mention The Climate Engine « Climate Change -- Topsy.com on November 9, 2009
at 1:22 pm
“can a rise of one degree at the surface produce a rise of three degrees at 200hPa? ”
That I’m not sure of, but a 0.35C rise in SST seems to be able to produce a 0.7C rise in lower troposphere temp.
http://www.woodfortrees.org/plot/uah/from:1997/to:2000/plot/hadsst2gl/from:1997/to:2000/offset:-0.2
By: tallbloke on November 9, 2009
at 5:04 pm
Hi Tallbloke. I wrote this in reply to a question from Bob Tisdale but it is also relevant to the consideration you raise here.

See this graph:
Consider these questions:
1. Where does change begin?
2. Why does the 200hpa anomaly line lie below the SST line and then it moves above the SST anomaly line?
3. Why does 200hpa temperature have more structure to its variation than does sea surface temperature? Is SST a dampened version of change in the upper atmosphere or is it the other way round?
4. What could be the causative factor that accounts for the relationship between 200hpa temperature and SST that so obviously exists?
By: erlhapp on November 15, 2009
at 2:28 am
Thank you for such a comprensive overview. I wish people would quit watching sponge bob long enough to read something important like this.
By: Sue Brown on November 9, 2009
at 9:58 pm
Very good article thanks, i myself quit believing the global warming crap after vancouver’s two coldest winters in a while…
Vancouver,bc canada
By: Kornel on November 10, 2009
at 12:00 am
I remember Nasa talking about skylab falling from orbit due to friction with the upper atmosphere due to the atmosphere heating and expanding.. I was still in middle school at the time but I remember thinking it was odd since the surface temps were low and there was talk of an ice age coming. It now makes sense given the data in your report.
We also had an example last December you should research. I though we were heading for a severe winter then a shock wave from a magnatar hit the atmosphere at the end of december and the cold spell over the northern hemisphere abruptly moderated for a couple weeks. Accuweather had an article which showed an animation of the shock wave hitting the atmosphere and the resulting temperature changes. I think they titled the article a magnificent magnatar. It and the solar flare which hit in early January about three years ago are sriking examples of your theory. The solar flare ended a bad cold spell in Nov-Dec and caused 70 degree weather in the early part of January. In both cases the events in the upper atmosphere translated into a temperature change on the ground within a weeks time frame and it took about three weeks for the temperature to return to normal in both casas.
By: Danil Jimison on November 10, 2009
at 2:03 am
Observation is everything. There was a report earlier this year linking the detection of cosmic rays deep underground and sudden stratospheric warmings. Cosmic rays penetrate further through a thinner atmosphere. I wrote about it in an earlier post “he atmosphere dances in the solar wind…El Nino shows his face” and documented the increase in ozone in the stratosphere that accompanies the stalling of the vortex as the atmospheric feed from the mesosphere is cut off by lower pressure at the pole.
I think that there is a growing recognition that ozone is controlled from the mesosphere and that nitrogen ion content in the mesosphere increases with geomagnetic activity. But the mainstream does not know about this yet, or finds it a bit inconvenient.
By: erlhapp on November 10, 2009
at 6:36 am
[…] https://climatechange1.wordpress.com/2009/11/08/the-climate-engine/ […]
By: the climate engine « Charlie's World on November 10, 2009
at 2:06 am
Thank you for your article. I’ll need to read it again to fully understand it.
I hope for some sharp remarks from other readers that will benefit the quality of the article.
By: ipper on November 10, 2009
at 3:36 am
Sharp remarks are welcome. Improvement is always possible.
By: erlhapp on November 10, 2009
at 6:37 am
[…] Erl Happ Climate Change, November 8, […]
By: The Climate Engine « An Honest Climate Debate on November 10, 2009
at 5:46 am
I find your posts to be ground breaking. Climate science needs more people like you. I absorb more each time I read through your work. One thing I am failing to grasp so far though even though I can see the obvious coorellation; I understand how nitrogen ions filter through to the stratosphere, especially through the vortex, and how the creation of ozone warms the atmosphere. What I seem to be missing is the understanding of the initial process of how when the energy flowing from the sun diminishes, and I assume that there are then fewer nitrogen ions created in the mesosphere, how then is the vortex activity enhansed by this so as to dampen the creation of ozone and begin the process of cooling the atmosphere.
By: John Gelzer on November 13, 2009
at 10:12 am
Hi John,
As I see it, any loss of air pressure at the pole will reduce the downward flow of air from the mesosphere via the vortex. There is evidence that the amount of ozone in the stratosphere increases if the nitrogen oxides and dioxides from the mesosphere, that have the capacity to soak up oxygen atoms and reduce the formation of ozone, is cut off. The loss of pressure represents that choking off of the air supply from the mesosphere. It is accompanied by an increase in temperature at the highest levels of the stratosphere where nitrogen species from the mesosphere interact with oxygen in the stratosphere. The polar vortex, and in particular that in the Antarctic, represents the zone of heaviest interaction.
A loss of pressure in the Antarctic occurs as pressure rises northwards of 40°S latitude all the way to the northern pole. I suggest that is due to electromagnetic attraction and repulsion of atmospheric species that align with the Earths magnetic field. These aligning species are subject to forces that are generated in the ionosphere by the solar wind. These re-distributing forces are reflected in what we call ‘geomagnetic activity’ measured as dips and deflections in magnetic needles at the surface of the Earth.
So, I see vortex activity varying directly with atmospheric pressure at the surface under the vortex.
In addition, there is also good evidence that the concentration of nitrogen oxides in mesospheric air varies with solar activity. This potentially provides a double whammy effect.
But I would also envisage that the ratio between the strong and steady solar wind that emanates from the suns polar regions and the episodic wind from other sources like flares and sunspots affects the process of energy transfer from the solar wind to the ionosphere. Ultimately this affects the stratosphere. I say this because a small change in geomagnetic activity at solar minimum seems to have a disproportionately large effect on the atmosphere at that time.
That strong wind from the suns poles would continue during a maunder type minimum in solar activity generating large swings in surface temperature of the sort we saw in solar cycle 20 and other small solar cycles.
By: erlhapp on November 15, 2009
at 2:22 am
[…] documento lo trovate qui . Buona lettura. AKPC_IDS += "5340,";Popularity: unranked Ti è piaciuto l'articolo? […]
By: La Porsche nel Maggiolone | Climate Monitor on November 18, 2009
at 3:01 am
[…] Science; Scientists who have been silenced by CRU start to speak out here Air Vent comments here. Calls for scientists from the IPCC to be sacked. A general theory of natural climate variation here. […]
By: Add your name! 28/11/09 « TWAWKI on November 27, 2009
at 4:55 pm
Very very interesting post..I like this one. gotta bookmark this one.
By: Solar Panels For Homes on November 28, 2009
at 2:14 pm
[…] attinenti alla complessità del sistema, qualche settimana fa abbiamo pubblicato il commento ad una lunga trattazione che affronta questi temi da punti di vista molto simili, e che presenta delle interessanti […]
By: Più che mai piccoli nel Cosmo | Climate Monitor on December 26, 2009
at 8:04 am
[…] […]
By: Anonymous on December 28, 2009
at 9:33 am
Thanks Erl and Carl. This is an excellent article and needs to be read more widely. We all need to work together to get the message across as to what real science is about.
I’m currently in correspondence with Britain’s Climate Minister, Joan Ruddock and I’m pressing her to come clean about the unreported dropping of these 806 ‘cold’ weather stations as first noted by ChiefIO
Over at http://www.climategate.com we are running desperately seeking help from volunteers with expertise in computer data analysis in our investigation of the facts behind the dropping of 806 ‘cold’ ground weather stations in one year from the GHCN data set. So far, we’ve gone through part of that long list checking into the details of the dropped stations – particularly their location – whether rural or urban and thus likely to be contaminated by the urban heat island (UHI) effect.
You may well have guessed that what we’re finding so far from the few stations we’ve analysed is a trend that its mostly rural stations that have been dropped e.g. the dropped Australian and New Zealand stations are mostly rural (e.g. Port Nelson, Ruttan Lake, Joutel). Our readers successfully determined that the station count for the U.S. (in the GHCN v2_mean file) dropped from 1177 to 136 in April 2006. We were able to confirm this by importing the data and by doing a simple count of all station ID’s beginning with “425″ for the year 2006. Replication is straightforward apparently ( I’m no stats man -my contribution is as volunteer writer and legal commentator). I’m told this is a trivial task for any application developer to write the code to import this data and then analyse it. The most significant observation we have noted is that most of the stations left in the U.S. are airports (for the years 2006 and going forward- that’s a clear UHI type contamination in itself).
What we desperately need is help from other volunteers to complete our task of checking all 806 dropped stations. I want to be able to press the case confidently against the UK Climate Minister as soon as practicable to shame and blame the guilty and to lobby hard for a re-think of the culture of closed-door science and research.
If there is anything anyone can offer I would be extremely grateful. For more info and to read a copy of my latest letter to the Minister please see:
http://www.climategate.com/allow-me-to-correct-you-uk-climate-minister-joan-ruddock
Best wishes and keep up the great work!
John O’Sullivan
By: John O'Sullivan on January 13, 2010
at 4:28 pm
in figures 12 and 13 showing the average anomoly in 30 hPa temperature for 80-90 latitude n and s, it is clear that pre and post 1977 climate has a different signal for this indice. Can you update this chart since 2009? Has the climate reverted back to pre 1977 characteristics at this time?
By: John Gelzer on June 4, 2010
at 1:43 pm
Hi John,
Update coming shortly I hope. 30hPa temperature at the poles is in decline as the polar vortexes strengthen due to increasing atmospheric pressure at the pole. Here is a relevant comment I just happen to have made elsewhere:
The AO is very strongly related to atmospheric pressure at 80-90°N. A negative AO corresponds to high pressure at the pole and weaker pressure at latitudes between 50°N to 50°S latitude. So, we are talking of a shift in the atmosphere here, and a plot of pressure over time will reveal the oscillation. Currently, polar pressure is increasing and it has been doing so since 1990 in the Arctic and about 1999 in the Antarctic. Looking at the episodic short term shifts, pressure can be seen to increase and decrease at both poles simultaneously. As atmospheric pressure increases at the pole/falls at low latitudes so also does tropical sea surface temperature fall and with it global temperature.
So, it’s possible there is a weakening of pressure in the subtropical high pressure cells as polar pressure increases and a resulting increase in cloudiness at lower latitudes.
By: erlhapp on June 14, 2010
at 7:42 am
Erl
Compliments – thought provoking.
Suggest exploring your data further by synchronizing with the 21 year solar cycle as discovered by WJR Alexander.
See WJR Alexander
Causal linkages between solar activity and climatic responses
Water Resource and Flood Studies March 2006 , University of Pretoria, Dept. Civil & Biosystems Engineering
http://www.nuclear.com/archive/2006/03/17/Alexander.pdf%E2%80%9D
“It will later be demonstrated that it is not the annual sunspot densities that are important in identifying the relationship, but the rate of change in the densities. . . .
The minimum and maximum (H) autocorrelation coefficients occur respectively at 10 (-0.83) and 21 (+0.70) years, which are well in excess of the 95% confidence limits.
The following conclusions are based on the three-year study of a very large (18 000 observations) hydrometeorological database.
There is an unambiguous, regular and therefore predictable, statistically significant (95% level), 21-year periodicity in South African annual rainfall, river flow, flood peak maxima, groundwater levels and lake levels. . . .
As long ago as in 1995 . . . I asked the question ‘What causes El Niño? . . .Well, I can now answer that question. It is the direct consequence of changes in solar magnetic polarity. . . .
I demonstrated an undeniable linkage between changes in solar magnetic polarity and concurrent changes in South African rainfall and river flow. The strongest, and scientifically undeniable linkage, is that between reversals in solar magnetic polarity of which sunspot minima are a measurable manifestation, and the concurrent, sudden reversals from drought to flood sequences that started in December.
. . . It now becomes obvious that the floods were not caused by Pacific sea surface temperatures (La Niña), but that the floods and La Niña were both caused by regular, and therefore predictable, changes in solar magnetic activity.”
Then note Leif Svalgaard observed:
“the [galactic cosmic ray] flux is always higher for minima between odd and even cycles [23 to 24], than between even and odd cycles [22 to 23],. . .”
To: “. . . any light on which components of the solar radiation spectrum might account for that Leif?”
“Not due to any ‘radiation’, but to the polarity of the solar polar fields, which for one orientation screens the cosmic rays a wee bit more efficiently than for the opposite direction.”
This may help separate effects of the 21 year solar cycle from other causes.
By: David Hagen on July 17, 2010
at 1:33 pm
[…] brrrm, start up The Climate Engine. It’s a long article, but worth it, and it’s this week’s must-read: Atmospheric […]
By: Global Warming Hoax Weekly Round-Up, Nov. 12th 2009 « The Daily Bayonet on October 11, 2010
at 11:05 am
I think you lost me at nitrogen from the mesosphere, but generally this does explain the difference in temperature variations between the southern and northern hemisphere. In theory at least.
By: Dan James on October 11, 2010
at 11:56 pm
[…] at https://climatechange1.wordpress.com/2011/01/17/earths-changing-atmosphere/ and earlier at https://climatechange1.wordpress.com/2009/11/08/the-climate-engine/ Share this:SharePrintDiggFacebookStumbleUponTwitterRedditEmailLike this:LikeBe the first to like […]
By: Climate changes – oh so naturally. « Climate Change on December 17, 2011
at 7:29 pm
[…] at https://climatechange1.wordpress.com/2011/01/17/earths-changing-atmosphere/ and earlier athttps://climatechange1.wordpress.com/2009/11/08/the-climate-engine/ Share this:ShareFacebookDiggTwitterStumbleUponPrintRedditEmailLike this:LikeBe the first to like […]
By: Erl Happ: Climate changes – oh so naturally « Tallbloke's Talkshop on June 12, 2012
at 2:26 am
Hi, I desire to subscribe for this webpage to take most up-to-date updates, thus where can i do it please assist.|
By: Robert Crowl on July 2, 2013
at 10:53 pm