
E6S-209 Process Pulse Part 1 - Statistical Process Control (SPC)
Like / Dislike **We'd Appreciate Your Opinion**
Email me: aaron@e6s-methods.com
Leave a Review! http://bit.ly/E6S-iTunes;
Donations: http://bit.ly/E6S-Donate
Intro: Welcome to the E6S-Methods podcast with Jacob and Aaron, your weekly dose of tips and tricks to achieve excellent performance in your business and career. Join us as we explore deeper into the practical worlds of Lean, Six Sigma, Project Management and Design Thinking. In this episode number 209, we introduce various types of statistical process control charts in "Process Pulse - Part 1." If you're just tuning in for the first time, find all our back episodes at our podcast table of contents at e6s-methods.com. If you like this episode, be sure to click the "like" link in the show notes. It's easy. Just tap our logo, click and you're done. Tap-click-done! Here we go. http://bit.ly/E6S-209 Leave a Review! http://bit.ly/E6S-iTunes
*** The Process Pulse - SPC ***
Objection 1: We don't have time to look at and analyze every data point.
Counter 1: SPC will actually save you time, by avoiding major disruptions you could have detected before they became a problem, and by not spending time on common cause signals
Objection 2: We already do SPC, but it really doesn’t help us with anything.
Counter 2: Why? Are you doing it real-time? If you don't use it properly, it's useless. SPC
I Note!: Lots of images in this series. Take a look at the show notes
II SPC – Statistical Process Control
a. History- invented by Walter A. Shewhart working for Bell Labs in the 1920s
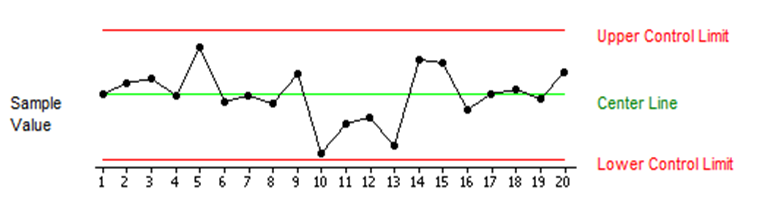
b. “Anatomy”
i. line drawing with connected dots
ii. individual plotted points in time order with on the X-axis and key measure on the Yaxis
iii. A center line is drawn at the value of the mean of all measurements
iv. Upper and lower control limits (sometimes called "natural process limits") that indicate “out-of-control” situation
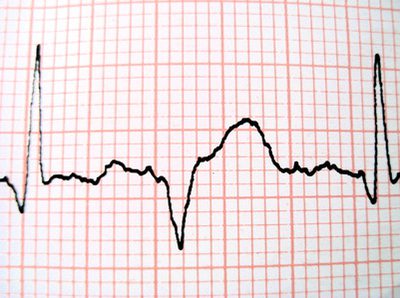
c. Monitors the health (pulse) of the process, and detects unanticipated change. (ekg reading?)
i. Trends
ii. Abnormal changes in variation
iii. Too far from target
iv. See prior episodes
1. E6S-064 - In the eye of the Cash-holder Part 1A- Stable & Capable
2. E6S-065 - In the eye of the Cash-holder Part 1B- Stable & Capable
d. Example: An operator on a ceramics coating process monitors the coating weights applied to each part. The process flags for rule 1 violation for statistically lighter than usual coating weight.
i. Proper action
1. Pause the process (where it makes sense)
2. Inspect the part. Is it still within specification?
3. Investigate the process. Did something change?
4. If part is good and nothing changed, make a note that you investigated the process and continue running as is with no changes
5. If the part is out of spec or something changed in the process. Seek any necessary help to adjust the process. Make a note of changes made. Start the process again.
III Different types of SPC charts
a. Most Basic
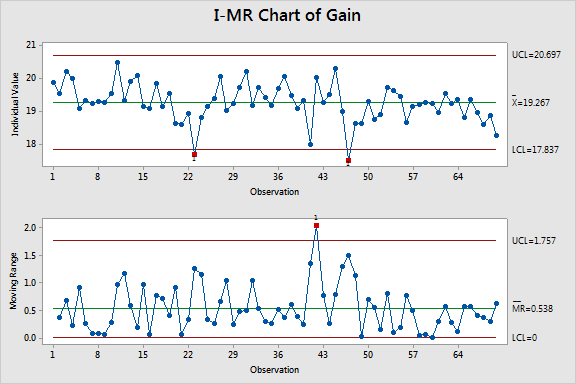
i. I-MR – Individual Moving Range (Continuous Data - No subgroups)
ii. XbarR – Mean and Range (Continuous Data - with rational subgroups)
iii. P – Proportions Chart (Discrete/Attribute Data – with rational subgroups)
iv. U – Plots defects per opportunity (DPU) – ((Discrete/Attribute Data – with rational subgroups)
1. When multiple defect opportunities exist on a single unit –
2. output will be an “average count” with some decimal places, if multiple units are being examined
b. Slightly more complex
i. XbarS – Mean and Standard Deviation (Continuous Data - with rational subgroups)
1. When subgroup sample sizes are large
ii. NP – plots individual counts of defective units (as opposed to proportions) – ((Discrete/Attribute Data – with rational subgroups)
iii. C - plots individual counts of defects (as opposed to defective units) – ((Discrete/Attribute Data – with rational subgroups)
iv. Z MR– or “Short Run” – plots points in terms of the “Z” score. (Continuous Data – no subgroups)
1. Analyzed in units of standard deviation
2. Useful for high mix low volume production, where only small samples from each part type are produced.
3. Leverages data from all parts run on the same equipment
v. Laney P and Laney U – adds correction factor for control limits P or U charts to correct for “overdispersion” due to large subgroup sample sizes
c. Somewhat advanced
i. EWMA – Exponential Weighted Moving Average (Continuous data - individual with or without rational subgroups)
1. Plots a combined measurement with some weight given to the previous point and some weight given to the new measurement (no subgroups)
2. Used to detect small shifts from target when process is in control.
ii. CUSUM - Cumulative Sum (Continuous data - individual with or without rational subgroups)
1. Plots a cumulative sum of the deviations of each sample value from the target value.
2. Used to detect small shifts from target when process is in control.
iii. Zone Charts (Minitab only?) – Hybrid of Xbar and CUSUM charts. (Continuous data - individual with or without rational subgroups)
1. Plots a cumulative score, based on "zones" at 1, 2, and 3 standard deviations from the center line
2. Used to simplify interpretation – only one rule (score > 8)
d. Others?…
i. Multivariate
ii. Rare event charts
Outro: Thanks for listening to episode 209 of the E6S-Methods podcast. Stay tuned for episode 210 for "Process Pulse- Part 2," where we discuss the Western Electric Rules. Don't forget to click "like" or "dislike" for this episode in the show notes. Tap-click-done! If you have a question, comment or advice, leave a note in the comments section or contact us directly. Feel free to email me "Aaron," aaron@e6s-methods.com, or on our website, we reply to all messages. If you heard something you like, then share us with a friend or leave a review. Didn't like what you heard? Join our LinkedIn Group, and tell us why. Don't forget you can find notes and graphics for all shows and more at www.E6S-Methods.com. "Journey Through Success. If you're not climbing up, you're falling down." Leave a Review! http://bit.ly/E6S-iTunes