Sanitation Park Nathuwawala, Dehradun: A Study of Solid Waste Management in Uttarakhand
Anita Joshi1 * and Neeraj Joshi1
http://dx.doi.org/10.12944/CWE.15.1.12
Copy the following to cite this article:
Joshi A, Joshi N. Sanitation Park Nathuwawala, Dehradun: A Study of Solid Waste Management in Uttarakhand. Curr World Environ 2020; 15(1). DOI:http://dx.doi.org/10.12944/CWE.15.1.12
Copy the following to cite this URL:
Joshi A, Joshi N. Sanitation Park Nathuwawala, Dehradun: A Study of Solid Waste Management in Uttarakhand. Curr World Environ 2020; 15(1). Available from: https://bit.ly/33QWPkW
Download article (pdf) Citation Manager Publish History


Introduction
Sanitation is directly related to public health and a variety of health related facilities are provided by the government to the society but basically public health is associated with sanitation. In general, sanitation is the responsibility of local bodies like Nagar Nigam, Nagar Palika Parishad and Nagar Panchayat at urban level and Gram Panchayat and Jila Panchayat at rural level. Though these bodies are responsible for multiple services like education, registration of birth/death, street light, construction of internal roads and drains in cities/towns etc but sanitation is the main focus of these local bodies. The base of all the living conditions depends upon sanitation and the level of Sanitation depends upon the solid waste management process adopted by these bodies. Kumar (2010) has indicated a report of a high power committee on Urban Solid Waste Management in India which has pointed out that Urban Solid Waste Management is one of the most neglected area of Urban Development.
Establishment of Solid Waste Management Processing Plant is essential for proper Solid Waste Management. Waste Management applies those techniques and systems that ensure proper storage, collection, transportation and disposal of a waste stream (Pichtel, 2014). Public Participation is required to solve the problem of any area. The role of NGO is also very important. According to Shorholy and others (2008) the involvement of people and private sector through NGOs could improve the efficiency of MSWM. Public awareness should be created. Proper segregation, Scientific and systematic waste management is required for a successful waste management. Jasti and Subbaiah (2010) has also focussed upon adaptation of technologies to provide environmental friendly processing of waste saying that MSW disposal does not entirely depend upon the efficiency of Municipal Corporation. Ahsan and others (2014) has also stated that integrated solid waste system should be based on local needs, socio-economic setting and technological capabilities. Solid Waste Management Rules (2016) and Advisory on On-site Decentralized Composting of Municipal Organic Waste (2018) focus on decentralized waste treatment system.
In Uttarakhand, all the Urban Local Bodies are facing sanitation problems due to a lack of systematic solid waste management planning. Solid Waste Management Processing plants have been established and are functional only in Nagar Nigam Haridwar and Nagar Nigam Dehradun in the state. Both of the plants are running under Public Private Partnership (PPP) mode. The major objective of “Swachh Bharat Mission” is to motivate private sector in expenditure. In Dehradun, Sheeshambara plant is centralized plant covering 69 wards of the city and whereas 31 wards still uncovered by the plant. This plant was established in 2017 and is facing many problems including public opposition. Waste management problems are enhanced with addition of 40 ward (72 villages) in 2018. So Nagar Nigam has started solid waste management process in decentralized way as a pilot project in Nathuwawala ward, Dehradun (uncovered by Sheeshambara plant) and is handed over to Feed back Foundation (Non Governmental organisation) for solid waste processing. The Foundation has developed the solid waste processing area as Sanitation Park and declared the Nathuwawala ward zero waste zone. So the researchers have decided to study the Solid Waste Management process of Nathuwawala, which is known as “Sanitation Park ” at present.
Objectives of the Study
- To locate salient features of the Sanitation Park.
- To identify the existing process of Solid Waste Management in ward Nathuwawala.
- To find out whether the solid waste management rules 2016 are followed in SWM process in Sanitation Park.
- To identify the different practices adopted by the NGO from the starting of the plant.
- To get the response of the people towards Sanitation Park.
Methodology
In Uttarakhand there are 90 urban local bodies. Out of them, there are 8 Nagar Nigams (Municipal Corporations), 41 Nagar Palika Parishad and 41 Nagar Panchayats. The detailed information of Urban Local Bodies in the state are given below in table 1
Table 1: Details of Urban Local Bodies in Uttarakhand
|
S No. |
District Name |
ULB Name |
Current City Population |
Total Solid Waste Generated (in TPD) |
S No. |
District Name |
ULB Name |
Current City Population |
Total Solid Waste Generated (in TPD) |
|
|
1 |
Almora |
Dwarahat (NP) |
2749 |
1. 5 |
47 |
Bageshwar |
Bageshwar (NPP) |
25045 |
7 |
|
|
2 |
Ranikhet (NPP) |
5100 |
1. 53 |
48 |
Kapkot (NP) |
5365 |
2 |
|||
|
3 |
Bhikyasain (NP) |
4906 |
2 |
49 |
Pithoragarh |
Dharchula (NPP) |
7039 |
6. 5 |
||
|
4 |
Almora (NPP) |
39627 |
10 |
50 |
Pithoragarh (NPP) |
62502 |
30 |
|||
|
5 |
Chamoli |
Badrinathpuri (NP) |
5000 |
5 |
51 |
Gangolihat (NP) |
11000 |
0. 55 |
||
|
6 |
Joshimath (NPP) |
20000 |
5 |
52 |
Berinag (NP) |
11000 |
1 |
|||
|
7 |
Chamoli (NPP) |
45000 |
7. 5 |
53 |
Didihat (NP) |
7969 |
3. 6 |
|||
|
8 |
Nandprayag (NP) |
2447 |
4 |
54 |
Rudraprayag |
Kedarnath (NP) |
612 |
0. 5 |
||
|
9 |
Gauchar (NPP) |
16500 |
6 |
55 |
Rudraprayag (NPP) |
15000 |
3 |
|||
|
10 |
Karnaprayag (NPP) |
9850 |
8 |
56 |
Ukhimath (NP) |
3638 |
4 |
|||
|
11 |
Gairsain (NP) |
8665 |
2 |
57 |
Augustmuni (NP) |
6557 |
2. 1 |
|||
|
12 |
Pokhari (NP) |
5295 |
0. 36 |
58 |
Tilwara (NP) |
2900 |
0. 78 |
|||
|
13 |
Tharali (NP) |
4649 |
0. 85 |
59 |
Tehri |
Kirtinagar (NP) |
2517 |
0. 9 |
||
|
14 |
Pipalkoti (NP) |
6900 |
0. 56 |
60 |
Devaprayag (NP) |
2868 |
5 |
|||
|
15 |
Champawat |
Champawat (NPP) |
12756 |
4 |
61 |
Tehri (NPP) |
24014 |
12 |
||
|
16 |
Lohaghat (NP) |
7932 |
4. 5 |
62 |
Chamba (NPP) |
10457 |
4 |
|||
|
17 |
Tanakpur (NPP) |
21484 |
5. 3 |
63 |
Ghansali (NP) |
7775 |
4. 4 |
|||
|
18 |
Banbasa (NP) |
6023 |
3 |
64 |
Lambgaon (NP) |
1061 |
1 |
|||
|
19 |
Dehradun |
Vikasnagar (NPP) |
24019 |
10 |
65 |
GAJA (NP) |
2098 |
1 |
||
|
20 |
Herbertpur (NPP) |
10567 |
4. 7 |
66 |
Chamiyala (NP) |
5017 |
2 |
|||
|
21 |
Doiwala (NPP) |
61370 |
30 |
67 |
Narendranagar (NPP) |
6049 |
1. 2 |
|||
|
22 |
Rishikesh (N. N) |
106320 |
60 |
68 |
Muni Ki Reti (NPP) |
28636 |
16 |
|||
|
23 |
Mussoorie (NPP) |
30118 |
18 |
69 |
US Nagar |
Kashipur (N. N) |
175819 |
50 |
||
|
24 |
Dehradun (N. N. ) |
803983 |
280 |
70 |
Mahua Dabra (NP) |
8058 |
2 |
|||
|
25 |
Garhwal |
Pauri (NPP) |
25440 |
12. 5 |
71 |
Jaspur (NPP) |
56156 |
25 |
||
|
26 |
Dogadda (NPP) |
2422 |
1 |
72 |
Sultanpur (NP) |
14745 |
2 |
|||
|
27 |
Kotdwara (N. N) |
135000 |
60 |
73 |
Bazpur (NPP) |
31172 |
5. 5 |
|||
|
28 |
Swargashram Jonk (NP) |
4669 |
2. 5 |
74 |
Rudrapur (N. N) |
175723 |
60 |
|||
|
29 |
Satpuli (NP) |
7369 |
2. 5 |
75 |
Kichha (NPP) |
74356 |
25 |
|||
|
30 |
Srinagar (NPP) |
44000 |
12 |
76 |
Dineshpur (NP) |
15200 |
6 |
|||
|
31 |
Haridwar |
Jhabrera (NP) |
11186 |
10 |
77 |
Shaktigarh (NP) |
7784 |
1. 2 |
||
|
32 |
Manglaur (NPP) |
52971 |
16 |
78 |
Khatima (NPP) |
58494 |
6. 25 |
|||
|
33 |
Laksar (NPP) |
25760 |
6 |
79 |
Gularbhoj (NP) |
7177 |
5. 6 |
|||
|
34 |
Shivalik Nagar (NPP) |
38650 |
2 |
80 |
Mahua Kheraganj (NPP) |
15000 |
4. 5 |
|||
|
35 |
Bhagwanpur (NP) |
25000 |
10 |
81 |
Kela Khera (NP) |
14423 |
6. 5 |
|||
|
36 |
Piran Kaliyar (NP) |
25000 |
6. 61 |
82 |
Gadarpur (NPP) |
23289 |
12. 5 |
|||
|
37 |
Roorkee (N. N) |
121923 |
104 |
83 |
Sitarganj (NPP) |
31711 |
19 |
|||
|
38 |
Landhaura (NP) |
18370 |
7 |
84 |
Nanakmatta (NP) |
8487 |
1 |
|||
|
39 |
Haridwar (N. N) |
251000 |
240 |
85 |
Uttarkashi |
Barkot (NPP) |
7414 |
3 |
||
|
40 |
Nainital |
Bhimtal (NP) |
14882 |
2. 5 |
86 |
Uttarkashi (NPP) |
27102 |
12 |
||
|
41 |
Haldwani (N. N) |
280604 |
120 |
87 |
Gangotri (NP) |
110 |
0. 55 |
|||
|
42 |
Ramnagar (NPP) |
54787 |
24 |
88 |
Purola (NP) |
7931 |
0. 75 |
|||
|
43 |
Lalkuan (NP) |
7644 |
4. 2 |
89 |
Chinyalisaur (NPP) |
8844 |
2. 5 |
|||
|
44 |
Nainital (NPP) |
41377 |
22 |
90 |
Naugaon (NP) |
7000 |
2 |
|||
|
45 |
Bhowali (NPP) |
8457 |
2 |
Total |
3492131 |
1505. 61 |
||||
|
46 |
Kaladhungi (NP) |
9246 |
3. 62 |
|||||||
N. N (Nagar Nigam), NPP (Nagar Palika Parishad) NP (Nagar Panchayat) TPD (Ton per day)
Source: Directorate of Urban Development, Uttarakhand Dehradun on the basis of Swachh Survekshan 2020, Month of December
Table 1 reveals that in Uttarakhand, Dehradun is the largest Solid Waste Generator city while Haridwar is in second place. Solid Waste Management Plants are running in both the cities. Nagar Nigam Dehradun has 100 wards having population of 0. 803 million at present after including 40 wards (72 villages are included in 2018). The Sanitation Park Nathuwala, Dehradun is the single project started in decentralized mode in Uttarakhand. The researchers selected this project of Nagar Nigam Dehradun for study. The map and layout of the area is given below.
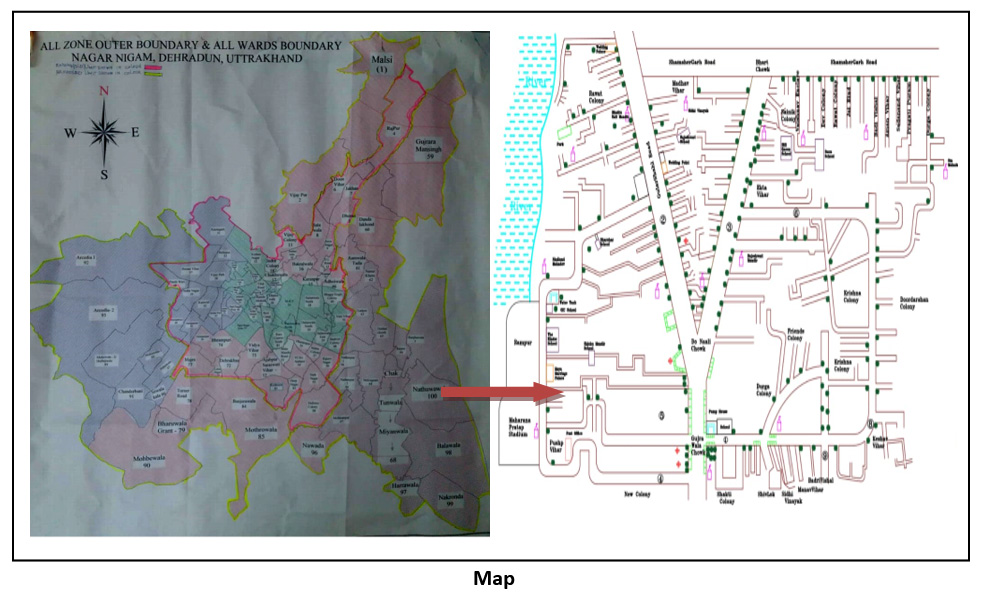 |
Map Click here to view Map |
Case study method was adopted for study. Interview, survey and observation techniques were followed for the research work. The researchers interviewed the CEO Mr. Ajay Sinha and other staff of the NGO and Mrs. Swati Dobhal, the ward member of Nathuawala ward, Dehradun. Interview was followed by survey and observation methods. Researchers have visited the ward several times. The population was 13000 people of the ward. A sample of 130 people, one from each family, was randomly selected for survey. The ward is divided into 6 clusters and minimum 20 residents from each cluster are included in sample.
Findings
Researchers have found that the Sanitation Park was started on 16th may 2019 covering a population of 13000 in Nathuwawala ward (ward no. 100) as a pilot project of Nagar Nigam. The total land area occupied for the project is 30, 000 Sq. ft. Land is acquired on rent basis with the special efforts of the ward member Mrs. Swati Dobhal. It was a challenging task for Nagar Nigam and Feedback Foundation to occupy a land on rent basis for the purpose of Solid Waste Management. The project was earlier sanctioned by Nagar Nigam for Sewla Kala ward and it was shifted to another ward due to unavailability of land. Residents of the ward had not favoured it. Zhu and others (2008) have also described that it is difficult to find sites for solid waste management process that meet public approval. It is also indicated in Solid Waste Management Manual (2016) that all the ULBs are striving to meet proper Solid Waste Management due to limited financial resources, technical capacities and land availability.
The people of Nathuwawala ward also primarily opposed to establish the solid waste management processing facility in and around area but Mrs. Swati Dobhal’s exemplary move of providing 30000 Sq. ft. land and her initiative to convince the community with municipal officers worked well in favour of the project. Out of 30000 Sq. ft. area, only 4500 Sq. ft. is used for Solid Waste Management process and rest portion is developed as a public park and the whole area is named as ‘Sanitation Park’. 4500 Sq. ft. is divided into three parts –Waste tipping area, recyclable material shed and compost area. 10 compost pits are constructed for the treatment of wet waste and a limited area is developed for dry waste segregation, where dry garbage is segregated in 28 ways and kept in 28 different cabins to be sold to vendors for recycling. The NGO is earning on an average of USD 432. 98 per month from the sale of waste. In this way the waste is treated as a resource in Sanitation Park as directed in Solid Waste Management Rules 2016. In this partnership programme, facilities provided by Nagar Nigam Dehradun to the NGO (Feedback Foundation) are given below-
- Land facility
- Electric and water facilities
- Vehicle Facility for waste collection and transportation
Shed construction, technical support, awareness programme and operation maintenance has been handled by the NGO. It’s a combined effort of Municipal officers, NGO (Feedback Foundation), Ward member and citizens of Nathuwawala. Salient features of Sanitation Park regarding Solid Waste Management are given below in tabulation form.
Table 1: Details of Waste Generators
|
S No |
Category of Waste Generator |
No of Generators |
|
1. |
Domestic |
3259 |
|
2. |
Commercial |
262 |
|
3. |
Institutional |
14 |
|
Total |
3535 |
|
The above table shows that in Sanitation Park Nathuwawala, waste is collected from 3535 families/groups and out of them 3259 are domestic generators, 14 are institutes and rest 262 are shopkeepers. The average waste composition is shown in table given below.
Table 2: Composition of Waste (Average of Nov. 2019)
|
S No. |
Category |
Quantity (per day in kg) |
|
1. |
Bio-degradable waste |
1888. 00 (68%) |
|
2. |
Dry Waste |
759. 00 (27%) |
|
3. |
Domestic bio-medical Waste |
87. 00 (3%) |
|
4. |
Domestic hazardous waste |
51. 00 (2%) |
|
Total |
2785. 00 (100%) |
|
Above table reveals that out of the total waste the largest quantity is of bio-degradable waste, domestic bio-medical waste and domestic Hazardous waste is very less in quantity. To deal with the waste and waste generator a team of 21 people is working with high efficiency. Details of the working staff is in table no. -3
Table 3: Details of Staff
|
S. N. |
Post |
No. |
|
1 |
Project Manager |
01 |
|
2 |
Project Coordinator |
01 |
|
3 |
Caretaker of Park |
01 |
|
4 |
Swachhata Sainik |
12 |
|
5 |
Cluster Coordinator (IEC) |
06 |
|
Total |
21 |
|
It was observed during field visits that Solid Waste Management rules, 2016 were followed regarding waste management process in Sanitation Park. According to Solid Waste Management Rules 2016, following steps are essential for SSWM (Scientific Solid Waste Management) of garbage:
- Segregation at Source and door to door collection of waste.
- Transportation to SWM Processing Plant in segregated form
- Composting of Biodegradable Wastage
- Recycling of non biodegradable waste and land filling process of Non Recyclable waste
- Landfill of inert waste
Segregation at source is the first and foremost important point; the success of Solid Waste Management depends upon it. Segregation at source is a very easy process while segregation at dumping yard is very difficult. Source segregation as per the SWM Rules 2016 demand segregation at three ways-
- Wet Garbage (Bio degradable) – Kitchen waste, garden waste, vegetable peels, fruit waste, fish and meat etc.
- Dry waste (Non Bio degradable) – Metal, plastic, wire, paper, cardboard, rubber, wood, clothes etc.
- Hazardous Waste – Battery, CFL, household medical waste, bulb, CFL, paints, printer cartridges etc.
It was found in an observation that garbage is segregated at source in four ways in Natuwawala sanitation park. Transportation is also in segregated four stream given below
- Bio-degradable waste
- Dry Waste
- Domestic bio-medical Waste
- Domestic hazardous waste
During the interview the project manager provided the details of the user charges charged by NGO (Feedback Foundation). These charges are shown in Table-4 given below.
Table 4: Details of User Charges
|
Category |
Category detail |
Fixed Charges (per month in USD) |
|
1 |
Household of category I |
0. 80 |
|
2 |
Household of Category II and Shops |
1. 33 |
|
3 |
Schools and Institutions |
4. 00 |
|
4 |
Wedding Points |
9. 32 |
|
5 |
Large event areas |
13. 33 |
It is clear from table-4 that charges are fixed according to the income groups in category of Household. The project manager informed that NGO has collected USD 2877. 10 as user charges in Dec. 2019. Project coordinator and staff members told that waste is collected on a daily basis and the waste is treated scientifically in four ways.
SWM has economic, social and environmental dimensions (Ramchandra, 2009). It was found during field visit that the NGO is using 10 tricycles and 05 vehicles having four sections for different streams of waste. Waste is weighed every day before unloading it in tipping area. In tipping area, the dry waste is segregated again in 28 ways, kept in 28 cabins to be sold to the vendors, whereas cocopeat and bacteria culture is added to wet waste and is shifted to Nadep/compost pit for preparing compost. It is also observed that there are 10 compost pits in recycle area. Date of turning is indicated in every compost pit as waste is turned in three cycles in a cycle of 15 days. After 60 days compost is ready to use. Biomedical waste and hazardous waste is also handed over to vender. Even Construction and Demolition waste of the ward (Inert waste) was used for construction of internal roads of the park.
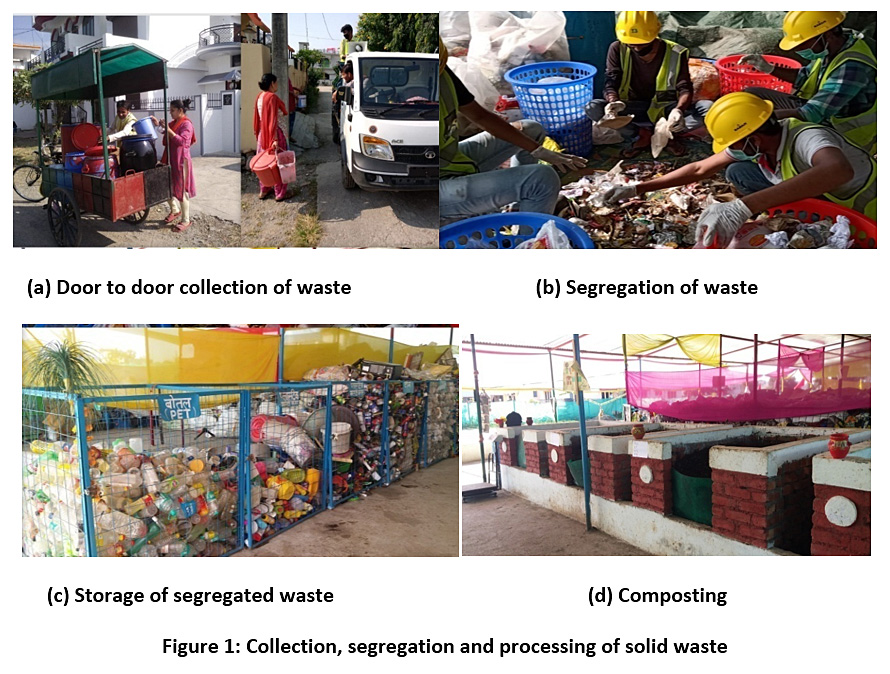 |
Figure 1: Collection, segregation and processing of solid waste Click here to view Figure |
It was also found that the waste generated in ward is scientifically and systematically treated and residents of the ward are motivated to reduce waste by in -house composting process. There are 83 houses and 14 institutions composting wet waste in their own compound.
The results of the survey are similar to observation as presented in table given below.
Table 5: Response of the ward residents on parameters of waste management
|
S. N. |
Statements |
Responses |
No. of respondents |
Percentage |
|
1 |
The method of waste disposal used by the respondents |
Burning the waste |
05 |
03. 8 |
|
Thrown in open area |
0 |
- |
||
|
Given to kuda Gadi |
130 |
100. 0 |
||
|
Other than stated above |
03 |
02. 3 |
||
|
2 |
Waste collected by NGO |
Daily |
95 |
73. 0 |
|
Once in a week |
0 |
0 |
||
|
Twice in a week |
06 |
04. 6 |
||
|
Thrice in a week |
28 |
21. 5 |
||
|
3 |
Waste given by the respondent |
Segregated |
130 |
100. 0 |
|
Mixed |
0 |
- |
||
|
4 |
Waste collection streams |
One |
0 |
- |
|
Two |
19 |
14. 6 |
||
|
Three |
01 |
00. 7 |
||
|
Four |
110 |
84. 6 |
||
|
5 |
The method of waste disposal used by the respondent prior to entry of NGO |
Given to waste collector |
64 |
49. 2 |
|
Thrown in open area |
15 |
11. 5 |
||
|
In –house disposal |
33 |
25. 3 |
||
|
Burning the waste |
19 |
14. 6 |
Table 5 reveals that 100 percent residents are giving waste to kuda vehicle in segregated form. As per Solid waste Rules, 2016 it is the duty of the waste generator to segregate waste, store separately and hand over to municipal worker or authorized waste pickers. A large proportion of people accept that garbage is collected on daily basis.
Education and spreading awareness is also necessary for Solid Waste Management. With the help of education India has eradicated many social problems. At present India is facing problems in the field of sanitation. Due to the process of urbanization all the cities are facing the problem of Solid Waste Management. The Prime minister has motivated the public of India toward sanitation by launching the “Swachh Bharat Mission”. Public education campaigns are going to be conducted under the banner of “Swachh Bharat Mission”. Students are also associated with this programme. Public educational programmes are very essential to change the attitude of the people. Education can provide knowledge but continuous efforts are necessary to change attitude. The World Bank (1999) argued that education equips people with knowledge, skills and attitude to tackle any crises. Fredric and others (2018) have indicated that education is used to install knowledge, change attitude and develop skills to transform communities in management of resources, including waste management.
The researchers gathered information regarding public education programme through interview and survey. During interview the project manager stated that in first phase the NGO has started public education programme (Figure-2) towards sanitation for the residents of the ward. The project was completed in three months and public education programmes were started in a planned way. Every ward is divided into six clusters. All the institutions, commercial and residents of the wards are covered by the programme. Cluster co-ordinators are appointed specially for public education. It was identified that NGO has adopted different practices, like door to door campaigns, meetings, Rallies, informative sessions to motivate the residents /shopkeepers/and other people of the ward for source segregation.
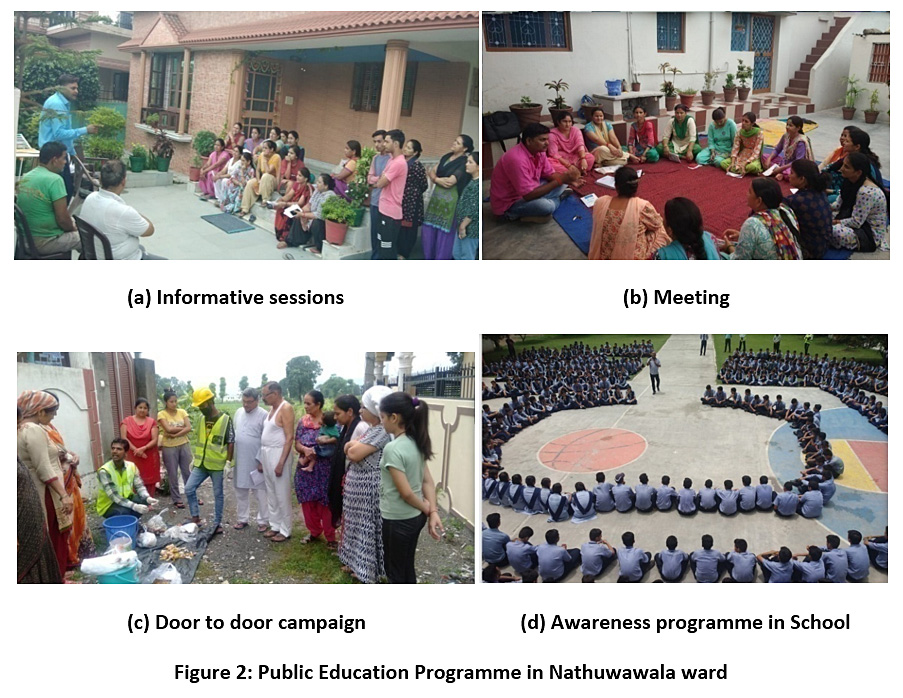 |
Figure 2: Public Education Programme in Nathuwawala ward Click here to view Figure |
Community participation is essential for the smooth and efficient operation of a SWM system (Bajaj, 2010). The researchers found that community participation and change of attitude are taken as essential parts of the programme as these are the key factors for behavioural change. According to Fredric and others (2018) education and change of attitude are interrelated. But change cannot be brought about by education alone and that behaviour changes can be brought about by social and psychological factors. Foreign countries are organising public education campaign for this purpose. Joshi and Joshi (2016) have also found that knowledge is included by adding topics in text books of different classes in Uttarakhand but results are not positive yet now. So public education is necessary. It was found that through public education campaign the NGO has made a bonding with community to join the project so that they become aware towards the cleanliness and sanitation-bringing about an inherent change in their behaviour. They have educated them about the four categories of waste, harmful results of unscientific management of waste, benefits of segregating the waste, techniques of reducing the waste and motivated them for in-house composting to reduce waste. Results of the survey regarding public education of the NGO are presented in table-6.
Table 6: Response of Public Education Programme
|
S. N. |
Statements |
Responses |
No. of respondents |
Percentage |
|
1 |
Source of Education about solid waste management |
Feedback Foundation |
111 |
85. 4 |
|
Have previous knowledge |
25 |
19. 2 |
||
|
2 |
NGO has educated me about segregation in four ways through |
Door to door campaign |
56 |
43. 1 |
|
Meeting/Rally |
32 |
24. 6 |
||
|
Showing example |
01 |
0. 07 |
||
|
All the above |
48 |
36. 9 |
||
|
3 |
Educated me about compost formation |
Positive |
111 |
85. 3 |
|
Negative |
19 |
14. 6 |
||
|
4 |
Educated me about harms of unsystematic disposal of waste |
Positive |
123 |
94. 6 |
|
Negative |
07 |
05. 4 |
||
|
5 |
Educated me about reducing waste |
Positive |
122 |
93. 8 |
|
Negative |
08 |
06. 2 |
||
|
6 |
I use the above knowledge in waste management |
Positive |
130 |
100 |
|
Negative |
0 |
- |
||
|
7 |
Public Education has influenced the citizen of the ward |
Positive |
126 |
96. 9 |
|
Negative |
04 |
03. 07 |
||
|
8 |
Public education has improved the sanitation level of the ward |
Positive |
130 |
100 |
|
Negative |
0 |
- |
Table 6 shows that a public education has influence upon the citizen of the ward. A large number of respondents have accepted that Feedback foundation is the source of knowledge for them regarding waste management and 100 percent respondent have accepted that public education has improved the sanitation level of the park and they use their knowledge for waste management. So public education is found as the basic factor for community participation towards zero waste management.
It was found in an observation that every waste generator of the ward has given a specific card with a specific code number having the information about the name of waste generator, type of waste generator, number of family members and address of waste generator in it. Dry waste and wet waste and hazardous waste is treated systematically on daily basis inside the Sanitation Park, while biomedical waste is handed over to Nagar nigam on alternate days at present till the search of biomedical treatment agency (search is in process). The park has no eyesore even in collection and segregation area. Recreational facilities are provided in Sanitation Park. Facility for playing badminton and basket ball is provided to the children of the ward (Figure-3) and there is future proposal for fixing benches and rides in Sanitation Park.
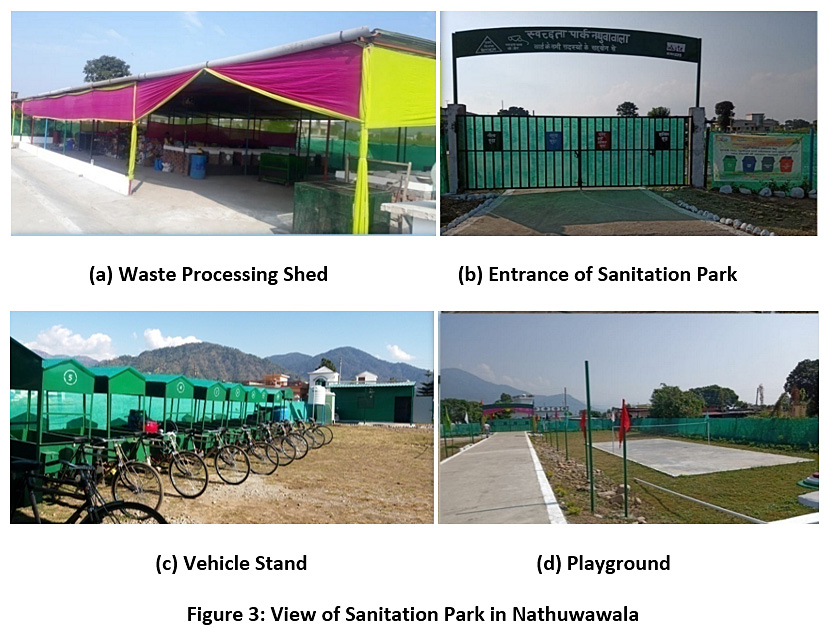 |
Figure 3: View of Sanitation Park in Nathuwawala Click here to view Figure |
Concept of waste reduction is also practised in Sanitation Park. The waste from one person is used by another person as a resource. Outer wall of the sanitation park is used as “Neki ki Diwar” and the needy are finding resources (clothing and other items) here. During interview project coordinator has stated that the NGO was getting a large amount of clothes, footwear and other items in posh area. So the NGO has decided to start Neki ki Diwar. Pichtel (2014) has described textile as a common component of MSW and kept clothing, footwear, carpet and non durable items in this category. According to him a total of 13. 1 million tons of textile was generated in 2010 in MSW category.
The survey results regarding evaluation of the Sanitation Park by the residents of Nathuwawala is presented in Table-7
Table 7: Responses of the Residents of Nathuwawala towards Sanitation Park
|
S. N. |
Statement |
Responses |
No. of respondents |
Percentage |
|
1 |
Knowledge about that waste is processed inside the Sanitation Park |
Positive |
122 |
93. 8 |
|
Negative |
08 |
06. 2 |
||
|
2 |
Evaluation of Sanitation Park |
Excellent |
88 |
67. 7 |
|
Good |
42 |
32. 3 |
||
|
Bad |
0 |
- |
Above table shows that no one has evaluated it in bad category It shows that Solid Waste Management process in Nathuwawala ward is successful.
Conclusion and Suggestions
The factors responsible for the success of the solid waste management in Sanitation park are given below-
1-Decentralization of Waste Management process
2. Public education for waste management
3-Source segregation and door to door collection
4-Community participation
5-Participation of NGO with expertise in scientific solid waste management
It is found that in the decentralized method, collection and transportation services are properly managed and residents of the ward are convinced through public education and motivated to pay user charges. It can be also concluded that public education campaigns are helpful in changing behaviour of the community. The NGO earned USD2877. 10 per month as user charges in 3535 waste generators in a single ward while in Centralized method USD18861. 01 (comparatively low) earned per month (Dec. 2019) from 0. 126 million waste generator in 69 ward due to lack of motivational activities and improper collection and transportation services. Nagar Nigam has to pay total USD29. 37 (Processing fee USD 13. 31and collection and transportation fee USD16. 06) for waste management of per ton garbage. Whereas Nagar Nigam is not paying any fee to Sanitation Park, so economically decentralised process is better for Nagar Nigam.
In this project special emphasis is given to source segregation and door to door collection and found that source segregation and door to door collection is feasible in decentralized model. Joshi and Ahmad (2016) have also focused that PPP mode is not successful in India under Municipal Solid Waste Management. Installation of decentralized solid waste units in metropolitan cities is the need of the hour.
This pilot project is an example of successful waste management process. In Uttarakhand, out of 90 Urban Level Bodies, 47 have a population less than Nathuawala Ward (See table No - 1). They can adopt the waste management system of Nathuwawala ward in which segregation, collection, transportation and processing of waste is according to SWM rules 2016. It may be taken as a role model for urban local bodies all over India.
It is also suggested that project work of 10 marks should be included in Science subject to develop attitude and skill so that behaviour of the future generation could be changed towards solid waste management.
Acknowledgement
We would like to express our special thanks to Mr Sunil Uniyal Gama, Mayor of Nagar Nigam Dehradun and Mrs Swati Dobhal, Councilor of Nathuawala ward and Officials of Urban Development Department Uttarakhand who helped us in gathering information regarding Sanitation Park Nathuawala.
Our Special thanks to Mr Ajay Sinha, CEO Feedback Foundation for co-operating us during field visits. Last but not the least we would like to thank citizens of Nathuawala ward, Dehradun for providing positive support in data collection.
References
- Advisory on On-Site and Decentralized Composting of Municipal Organic Waste (2018): Central Public Health and Environmental Engineering Organisation, Ministry of Housing and Urban Affairs.
- Ahsan A. , M. Alamgir and Others (2014): Assessment of municipal Solid waste Management System in a Developing Country, Chineses Journal of Engineering, retrived from www. hindawj. com.
- Bajaj Amrita (2010): Solid Waste Management in India, in Solid Waste Management, Present and Future Challanges, Edited by Jagbir Singh and Al. Rang Nathan, IK International Publishing House Pvt. Ltd. , New Delhi
- 4-Fredrick Mugwari, Joseph C. oonyu and others (2018): Influence of Education on Solid Waste Management Practices of Communities in Kampala City, retrived from www. researchgate. net
- Jasti Sudhir Kumar and K. Venketa Subbaiah (2010): Municipal Solid Waste Management Scenario in India, Australian Journal of Engineering research, SCIE Journals.
- John Pichtel (2014): Waste Management Practices, Municipal, Hazardous and Industrial, CRC Press, Tylor and Francis Group, London New York.
- Joshi Neeraj and Anita Joshi (2016): Sustainable Development through Imparting Education For Waste Management Processes in Uttarakhand in “Sustainable development in Indian Himalayan region: Prospects and Challanges”, edited by Joshi Atul and Neeraj Rubali, Jagdamba Publishing Company, New Delhi.
- Joshi Rajkumar and Sirajuddin Ahmad (2016): Status and Challenges of Municipal Solid Waste Management in India: A Review, Cogent Environmental Science, vol. 2, Issue -1.
- Kumar Sheel (2010): Sustainability of Urban solid Waste, in Solid Waste Management, Present and Future Challanges, Edited by Jagbir Singh and Al. Rangnathan, IK International Publishing House Pvt. Ltd. , New Delhi
- Municipal Solid Waste Management Manual (2016): Central Public Health and Environmental engineering Organisation (CPHEEO), Ministry of Urban Development, Govt. of India.
- Ramchandra T. V. (2009): Management of Municipal Solid Waste, Commonwealth of Learning, Indian Institute of Science.
- Sharholy Mufeed, Kaffel Ahmad and others (2008): Municipal Solid Waste Management in Indian Cities-A Review, Waste Management, 28, retrived from www. researchgate. net
- Solid Waste Management Rules (2016): Notification of Ministry of Environment, Forest and Climate Change, Govt. of India.
- The World bank (1999): Quoted in Fredrick Mugwari, Joseph C. oonyu and others (2018) in Influence of Education on Solid Waste Management Practices of Communities in Kampala City, retrived from www. researchgate. net
- Zhu da, P. U. Asnani and others (2008): Improving Municipal Solid Waste Management in India-A Sourcebook for policy Makers and practitioners.


